This article addresses the design and validation of an updated questionnaire that makes it possible to understand the use patterns and attitudes of university youth on social networks. The authors utilized a panel of 20 judges who were social media experts and a sample of 640 university students. The exploratory factor analysis (EFA) explained 66.523% of the total variance. The confirmatory factor analysis (CFA), carried out to verify the dimensional structure of the instrument, reflected the appropriate parameters. The reliability study showed a Cronbach’s alpha of 0.864. These data corroborated the development of a robust and reliable questionnaire. The resulting instrument did not contain items alluding to specific social networks (Facebook, Twitter, Instagram, or LinkedIn), but rather students’ usage patterns of them. The exclusion of items that referred to particular social networks during the research demonstrated a convergence in behavior on social media regardless of the nuances of each platform. This fact suggested that the platform was of secondary importance in the context of a new paradigm in which the type of use (viewing, posting, participating, or interacting) took precedence over the name of the network itself.
- social networks
- structural equation modeling
- validity
- reliability
- university
1. Content Validity Analysis
Content validation was carried out in three successive rounds in which the panel of expert judges assessed the pertinence, relevance, and precision of each of the 28 questions in the questionnaire. In each of these three rounds, the panel of experts received a template in which each item was quantitatively scored on a ten-point Likert scale.
In the first round of assessment, judges gave high scores on the pertinence of the questions (M = 8.32, SD = 1.26). The second stage also received positive assessments regarding the relevance of the items in the questionnaire (M = 8.91, SD = 0.95). Finally, the third round also reflected optimal results regarding the level of precision in the wording of the questions (M = 8.37, SD = 0.98). Despite the above, poorly scored items were also identified at all stages.
In line with the approaches of previous studies [1][2], in each round, the authors discarded those items with average values less than seven. This refinement criterion led to eliminating nine of the 28 items in the first version of the instrument (Item 1, Item 2, Item 3, Item 4, Item 8, Item 9, Item 10, Item 13, and Item 19), generating a second version of the questionnaire with 19 items.
2. Comprehension Validity Analysis
The study of comprehension validity, like the subsequent analyses, was carried out based on the data obtained after the questionnaire was administered to the sample of students participating in the study. For this analysis, the SDs were extracted in addition to skewness and kurtosis values (see Table 1). Items with SD > 1 and skewness and kurtosis values between -1 and one were considered adequate [3].
Table 1.
Standard deviation values and skewness and kurtosis indicators.
| Item | SD | Skewness | Skewness Standard Error | Kurtosis | Kurtosis Standard Error |
|---|
| Item 5 | 1.456 | 0.972 | 0.145 | −0.519 | 0.290 |
| Item 6 | 1.733 | −0.110 | 0.145 | 1.231 | 0.290 |
| Item 7 | |||||
| 5.407 | |||||
| 0.145 | |||||
| 29.381 | |||||
| 0.290 | |||||
SD values, as well as skewness and kurtosis values were considered acceptable for 18 of the 19 items. Only Item 28 was eliminated, for presenting an SD less than one and skewness and kurtosis values outside of the specified range. Item 28 pertained to the device students used to access social networks. This question, because it was answered in the same way by nearly every subject (a smartphone), did not contribute to gathering meaningful information. After eliminating this item, a third version of the measurement instrument was generated, with 18 items.
The level of discrimination of each item was also examined using item-total correlation statistics (see Table 2). The items considered adequate were those with corrected item-total correlation values of > 0.20 and for which the elimination of the item did not substantially increase the reliability expressed by Cronbach’s alpha [4].
Table 2.
Item-total correlation statistics.
| Item | Scale Variance If Item Deleted | Corrected Item-Total Correlation | Cronbach’s Alpha If Item Deleted |
|---|
| Item 5 | 77.796 | 0.158 | 0.714 | |||||||
| Item 6 | 77.142 | 0.125 | 0.723 | |||||||
| 1.780 | 0.368 | 0.145 | −1.402 | 0.290 | ||||||
| Item 7 | 77.556 | 0.103 | 0.727 | |||||||
| Item 16 | 0.768 | Item 11 | 1.097 | −0.207 | 0.145 | −0.470 | 0.290 | |||
| Item 11 | 0.601 | Item 12 | 1.008 | |||||||
| Item 11 | 74.742 | 0.422 | 0.686 | 0.802 | 0.145 | |||||
| Item 12 | 76.702 | 0.419 | 0.290 | |||||||
| 0.354 | 0.693 | |||||||||
| Item 18 | 0.851 | Item 14 | 1.095 | −0.388 | 0.145 | −0.566 | 0.290 | |||
| Item 14 | 73.596 | 0.488 | ||||||||
| Item 22 | 0.680 | 0.841 | Item 15 | 1.177 | 0.451 | |||||
| Item 15 | 0.145 | 0.731 | −0.736 | |||||||
| Item 12 | 0.480 | |||||||||
| Item 21 | 0.841 | |||||||||
| Item 20 | 0.769 | |||||||||
| Item 26 | 0.698 | |||||||||
| Item 27 | 0.687 | |||||||||
| Item 25 | 0.668 |
These four factors accounted for 66.523% of the total variance of the instrument. Their compositions are detailed below.
Factor 1 included four items (Item 17, Item 14, Item 16, and Item 11) that explained 22.673% of the variance. These items referred to the importance assigned to the viewing of photos, videos, and GIFs, searching for information, and the use of mentions of friends and/or family members. The authors labelled this factor “viewing.”
Factor 2 contained four items (Item 18, Item 22, Item 15, and Item 12) that explained 19.639% of the variance. These items referred to the importance of posting photos, videos, and GIFs, making status updates, and the use of mentions to prominent figures. This factor was labeled “posting.”
Factor 3 includes two items (Item 21 and Item 20) that explained 12.368% of the variance. These addressed the importance assigned to participation in surveys, games, and discussions. The authors labelled this factor “participating.”
Finally, Factor 4 contained the last three items (Item 26, Item 27, and Item 25). These explained 11.843% of the variance and referred to the frequency of use of hashtags, likes, and mentions. This factor was labeled “interacting.”
3.2. CFA
Once the dimensional structure of the instrument was known, its validity was confirmed by means of CFA. This CFA was done by estimating the parameters of the model under the maximum likelihood criterion. The model produced by the analysis, with its respective standardized regression coefficients and the covariances between factors, is reflected in Figure 2.
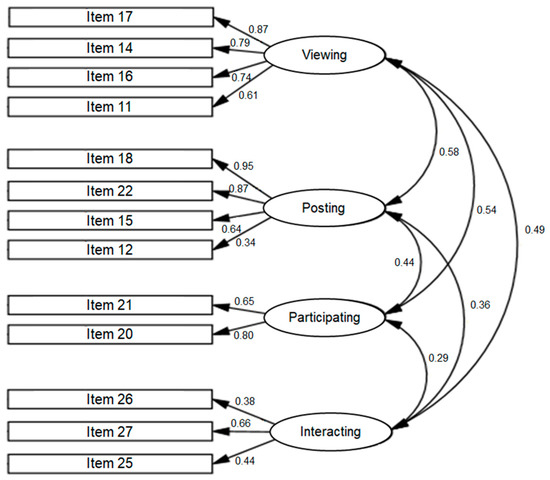
Figure 2. Confirmatory factor analysis (CFA) model for the questionnaire assessing the use of social networks. Source: created by the authors (AMOS 20).
The evaluation of the CFA model was carried out by examining the usual indicators: CFI, GFI, RMSEA, and SRMR. The model fit, measured as the chi-squared/degrees of freedom ratio (χ2/df), was 2.473, presenting the following fit indicators: CFI = 0.935, GFI = 0.925, RMSEA = 0.073, and SRMR = 0.0596.
The CFI can be interpreted as a multivariate coefficient of determination, which is considered optimal when greater than 0.90 [7]. Similarly, the GFI is a comparative fit indicator that is also considered appropriate at 0.90 to 0.95 [8]. The RMSEA reflects the difference between the population matrix and sample model and indicates a good model fit when less than 0.08 [9]. Finally, the SRMR represents the status of standardized residuals, and a value below 0.08 again indicates an optimal fit [10].
4. Reliability Analysis of The Final Instrument
The reliability and internal consistency of the final version of the questionnaire were examined using Cronbach’s alpha. This coefficient explores the homogeneity of the items contained in each factor, revealing whether they are interconnected [11].
The internal consistency of the items comprising the first factor (viewing) showed a Cronbach’s alpha of 0.831. The items included in the second factor (posting) presented a Cronbach’s alpha of 0.798. The internal consistency for the third factor (participating) showed a value of 0.684. The items of the fourth factor (interacting) had a Cronbach’s alpha of 0.604. According to Kerlinger and Lee [12], reliability coefficients between 0.600 and 0.850 for each of the constructs are considered optimal. Similarly, the reliability of the instrument as a whole also had a satisfactory overall coefficient of 0.864.
To conclude, in accordance with Calderón et al. [1], the reliability analysis was completed by examining the AVE. The AVE was above 0.50 for each of the four factors, further corroborating the reliability of the final instrument.
5. Descriptive Results Obtained with the Validated Questionnaire
Table 4 presents the descriptive results obtained for each item of the final questionnaire. The results are organized by factor. Factor 1 (viewing) highlights the importance assigned to viewing photos and searching for information. Factor 2 (posting) demonstrates that participants assigned great importance to posting photos and posting status updates on their profiles.
Table 4.
Descriptive results of the validated questionnaire.
| Item | Description | Average | SD |
|---|
| Factor 1: Viewing | ||||||||||
| Item 17 | Importance placed on looking at photos | 3.80 | 1.026 | |||||||
| Item 14 | Importance placed on watching videos or GIFs on the network | 3.55 | 1.095 | |||||||
| Item 16 | Importance placed on searching for or accessing information | 3.89 | 1.032 | |||||||
| Item 11 | Importance placed on mentioning friends and/or family members | 3.24 | 1.097 | |||||||
| Factor 2: Posting | ||||||||||
| Item 15 | 72.124 | 0.290 | ||||||||
| 0.523 | 0.675 | |||||||||
| Item 18 | Importance placed on posting photos | 3.12 | Item 16 | 1.032 | −0.810 | 0.145 | 0.162 | 0.290 | ||
| 1.023 | Item 16 | 73.834 | 0.511 | 0.680 | ||||||
| Item 22 | Importance placed on posting status updates | 2.96 | 1.020 | Item 17 | 1.026 | −0.711 | 0.145 | 0.104 | 0.290 | |
| Item 17 | 73.410 | 0.540 | 0.677 | |||||||
| Item 15 | Importance placed on posting videos or GIFs on the network | 2.35 | 1.177 | Item 18 | 1.123 | −0.203 | 0.145 | |||
| Item 18 | 70.947 | −0.598 | 0.290 | |||||||
| Item 12 | Importance placed on mentioning prominent figures | 2.20 | 1.008 | Item 20 | 1.251 | 0.386 | 0.145 | −0.857 | 0.290 | |
| 0.621 | 0.667 | |||||||||
| Item 20 | 71.934 | 0.493 | 0.677 | Item 21 | 1.186 | 0.378 | 0.145 | −0.760 | ||
| Factor 3: Participating | Item 21 | 74.750 | 0.290 | |||||||
| 0.380 | 0.689 | Item 22 | 1.120 | |||||||
| Item 21 | Importance placed on taking part in discussions | 2.47 | −0.192 | 0.145 | −0.700 | 0.290 | ||||
| 1.286 | Item 22 | 72.078 | 0.559 | |||||||
| Item 20 | 0.673 | Importance placed on participating in surveys or games | 2.53 | 1.351 | Item 23 | 1.436 | 0.276 | 0.145 | −1.278 | 0.290 |
| Item 24 | 1.399 | |||||||||
| Item 23 | 81.285 | 0.024 | 0.728 | |||||||
| Factor 4: Interacting | 0.012 | 0.145 | ||||||||
| Item 24 | 84.244 | −1.265 | 0.290 | |||||||
| −0.087 | 0.738 | |||||||||
| Item 26 | Frequency of use of the hashtag function | 1.91 | 0.946 | Item 25 | 0.956 | 0.056 | 0.145 | −0.628 | 0.290 | |
| Item 25 | 79.817 | 0.243 | 0.706 | Item 26 | 0.946 | 0.841 | 0.145 | 0.022 | ||
| Item 26 | 80.939 | 0.290 | ||||||||
| 0.222 | 0.711 | Item 27 | 1.071 | −0.487 | 0.145 | −0.254 | 0.290 | |||
| Item 27 | 78.141 | 0.247 | 0.702 | Item 28 | 0.407 | |||||
The table shows acceptable corrected correlation and Cronbach’s alpha values for 13 of the 18 items, suggesting that five items may be deleted (Item 5, Item 6, Item 7, Item 23, and Item 24). Thus, before analyzing the construct validity and final reliability of the instrument, a fourth, and a priori final, version of the questionnaire was obtained, consisting of 13 items.
3. Construct Validity Analysis
Before proceeding with the factor analyses (EFA and CFA) required to analyze construct validity, the Kaiser–Meyer–Olkin test for sampling adequacy and Bartlett’s test for sphericity were run. The purpose of extracting these two statistics was to evaluate the fit of the data to the planned factor analyses. The Kaiser–Meyer–Olkin value obtained was 0.764, better than the recommended value of 0.600. Bartlett’s test of sphericity yielded a statistical significance of 0.000. Both results confirmed the existence of sufficient correlations between the items, so factorial analyses were appropriate [5][6].
3.1. EFA
Before the EFA, the authors extracted the scree plot (see Figure 1). This graph provided an initial approach that identified four factors or dimensions. These four dimensions could be observed by the existence of three turning points: a first and evident turning point in Element 2 and two slight turning points matching more with Elements 11 and 12.
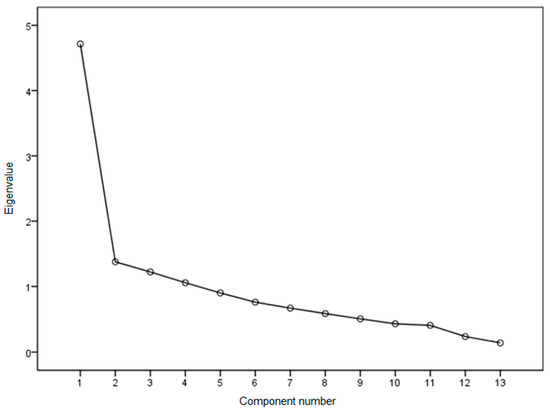
Figure 1.
Scree plot. Source: created by the authors (SPSS.25).
The EFA was carried out following the extraction of main components, with varimax rotation, applying the criterion of eigenvalue > 1 for factor extraction. The rotated component matrix extracted showed the dimensional structure of the instrument, revealing, in accordance with the scree plot, the existence of four underlying factors in the set of items (see Table 3).
Table 3.
Rotated component matrix.
| Item | Factor 1 | Factor 2 | Factor 3 | Factor 4 |
|---|
| Item 17 | 0.841 | |||
| Item 14 | 0.775 | |||
| Item 27 | ||||
| Frequency of use of “like” function or similar | ||||
| 3.43 | ||||
| 1.071 | ||||
| Item 25 | ||||
| Frequency of use of the mentions function | ||||
| 2.65 | 0.956 |
Likewise, of note in Factor 3 (participating) was the item referring to participation in surveys or games. However, the responses to this item had a high dispersion, which denoted a low degree of consensus among the participants on this question. Finally, in Factor 4 (Interacting), the item that stood out was on the subjects’ high frequency of the use of the “like” function.
6. Discussion and Conclusions
The questionnaire designed by the authors filled the need to obtain up-to-date information regarding the social network use patterns among university youth. This work provided an updated measurement instrument that could be used to understand the realities of social networking, as a step before the development of pedagogical practices that incorporate these technologies.
The analyses carried out indicated that the resulting questionnaire was robust and reliable. The content validity, assessed by a panel of expert judges, presented high scores and levels of agreement in terms of pertinence, relevance, and precision in the wording of the items. The comprehension validity included adequate values for SD, skewness, kurtosis, and corrected item-total correlation for the items in the final instrument. Similarly, the construct validity, examined by EFA, explained 66.523% of the variance, and the subsequent CFA yielded optimal values of CFI, GFI, RMSEA, and SRMR. Likewise, the reliability analysis of the final questionnaire revealed an overall Cronbach’s alpha of 0.864, as well as appropriate AVE values.
The procedure presented led to a questionnaire whose final version was comprised of four factors or dimensions (viewing, posting, participating, and interacting) spread across 13 items. These 13 items allowed information to be gathered on aspects such as the type of content that was searched for and posted, participation and collaboration with other users, and the ways users interacted within the social media setting.
It should be noted that the final version attained after the process of developing and validating the instrument did not contain items that referred to any specific social network, but rather students’ patterns of use within them. The elimination of items that made explicit mention of specific platforms reflected, in the authors’ view, a convergence in behaviors within social media regardless of the different nuances of each network. The authors concluded, therefore, that the distinctive and characteristic elements of each platform were of secondary importance in a new paradigm in which the type of use (viewing, posting, participating, or interacting) prevails over the name and brand image of the network itself.
These findings were in line with previous studies highlighting the volatile and fleeting nature of many social media platforms. Examples of this were the works by Matosas-López and Romero-Ania [13] and by Matosas-López, Romero-Ania and Romero-Luis [14], studies in which the authors addressed how certain networks disappeared and gave way to others. From the opposite perspective, the results of this research came into conflict with those of previous studies on the use of social networks, works that focused their analyses on specific platforms of a general nature such as WhatsApp [15] or platforms specialized in education such as Edmodo [16].
In view of the above, the authors underline that one of the main advances of this work was that it demystified the topic of what platform to use to put the focus on what to do regardless of whether it is a platform or another.
On the other hand, the overall descriptive results obtained through the final questionnaire confirmed many of the findings of previous studies. Factor 1 (viewing), in line with the study by Monge Benito and Olabarri Fernández [17], revealed the importance participants placed on viewing content on these networks. In addition, this factor confirmed the usefulness of these platforms as tools for searching for information, noted by Prendes Espinosa et al. [18].
Factor 2 (posting), consistent with the findings of Sánchez-Rodríguez et al. [19], emphasized the importance students placed on sharing content with their network. This factor also confirmed what Valerio Ureña and Serna Valdivia pointed out [20]: university students are always interested in updating their status on their profiles.
Likewise, Factor 3 (participating), in line with Abella García and Delgado Benito [21], corroborated the importance university students placed on these platforms as tools for discussion and information exchange. This factor also confirmed the findings of García-Ruiz et al. [22] and Doval-Avendaño, Domínguez Quintas, and Dans Álvarez [23] regarding the entertainment potential of these technologies.
Finally, Factor 4 (interacting) highlighted the use of the “like” function, confirming what was reported by García Galera, Fernández Muñoz and Del Hoyo Hurtado [24] in their work on cooperation and ways of interacting among young university students in the digital age.
In light of the above, the authors concluded that the developed questionnaire was valid and reliable for evaluating the use patterns of university youth on social networks at the present time. The instrument made it possible to obtain necessary information for the implementation of pedagogical practices supported by these platforms.
References
- Calderón, A.; Arias-Estero, J.L.; Meroño, L.; Méndez-Giménez, A. Diseño y Validación del Cuestionario de Percepción del Profesorado de Educación Primaria sobre la Inclusión de las Competencias Básicas (#ICOMpri3). Estud. Sobre Educ. 2018, 34, 67–97.
- Sean M. Bulger; Lynn D. Housner; Modified Delphi Investigation of Exercise Science in Physical Education Teacher Education. Journal of Teaching in Physical Education 2007, 26, 57-80, 10.1123/jtpe.26.1.57.
- Susana Lloret-Segura; Adoración Ferreres-Traver; Ana Hernandez; Ines Tomas; El análisis factorial exploratorio de los ítems: una guía práctica, revisada y actualizada. Anales de Psicología 2014, 30, 1151–1169, 10.6018/analesps.30.3.199361.
- Lacave Rodero, C.; Molina Díaz, A.I.; Fernández Guerrero, M.M.; Redondo Duque, M.A; Análisis de la fiabilidad y validez de un cuestionario docente. Rev. Investig. Docencia Univ. Inf. 2016, 9, 2.
- Henry F. Kaiser; An index of factorial simplicity. Psychometrika 1974, 39, 31-36, 10.1007/bf02291575.
- Amiel T. Sharon; C. J. Bartlett; EFFECT OF INSTRUCTIONAL CONDITIONS IN PRODUCING LENIENCY ON TWO TYPES OF RATING SCALES. Personnel Psychology 1969, 22, 251-263, 10.1111/j.1744-6570.1969.tb00330.x.
- J. S. Tanaka; G. J. Huba; A fit index for covariance structure models under arbitrary GLS estimation. British Journal of Mathematical and Statistical Psychology 1985, 38, 197-201, 10.1111/j.2044-8317.1985.tb00834.x.
- P. M. Bentler; Comparative fit indexes in structural models. Psychological Bulletin 1990, 107, 238-246, 10.1037//0033-2909.107.2.238.
- James H. Steiger; Structural Model Evaluation and Modification: An Interval Estimation Approach. Multivariate Behavioral Research 1990, 25, 173-180, 10.1207/s15327906mbr2502_4.
- Li‐Tze Hu; Peter M. Bentler; Li‐tze Hu Department of Psychology University of California Santa Cruz CA; Peter M. Bentler Department of Psychology University of California Los Angeles; Cutoff criteria for fit indexes in covariance structure analysis: Conventional criteria versus new alternatives. Structural Equation Modeling: A Multidisciplinary Journal 1999, 6, 1-55, 10.1080/10705519909540118.
- Cea D’Ancona, M.A. Métodos De Encuesta: Teoría Y Práctica, Errores Y Mejora; Síntesis: Madrid, Spain, 2004; ISBN 9788497562508.
- Kerlinger, F.N.; Lee, H.B. Investigación Del Comportamiento. Métodos De Investigación En Ciencias Sociales; 4a.; McGraw-Hill: México D.F., Mexico, 2008; ISBN 9789701030707.
- Matosas-López, L.; Romero-Ania, A. Preferencias de uso de redes sociales entre los estudiantes universitarios de ciencias sociales. In Proceedings of the XIX Congreso Internacional de Investigación Educativa: Investigación Comprometida para la Transformación Social; AIDIPE: Madrid, Spain, 2019; pp. 164–170.
- Matosas-López, L.; Romero-Ania, A.; Romero-Luis, J. Similarities and differences in the use patterns of social networks by university students: Comparative Spain—Azerbaijan. In Proceedings of the Congreso Universitario Internacional Sobre La Comunicación En La Profesión Y En La Universidad De Hoy: Contenidos, Investigación, Innovación y Docencia (CUICIID); Padilla Castillo, G., Ed.; Fórum XXI: Madrid, Spain, 2019; pp. 754–757.
- Vílchez Vilela, M.J.; Reche Urbano, E.; Marín Díaz, V. Diseño y validación de un cuestionario para valorar Whatsapp en la regulación de trabajo en grupo. Rev. Científica Electrónica Educ. Comun. Soc. Conoc. 2015, 15, 245–272.
- Alonso-García, S.; Morte-Toboso, E.; Almansa-Núñez, S; Redes sociales aplicadas a la educación: EDMODO. EDMETIC Rev. Educ. Mediática TIC 2014, 4, 88-111, 10.21071/edmetic.v4i2.3964.
- Monge Benito, S.; Olabarri Fernández, M.E. Los alumnos de la UPV/EHU frente a Tuenti y Facebook: Usos y percepciones. Rev. Lat. Comun. Soc. 2011, 66.
- Prendes Espinosa, P.; Gutiérrez Porlán, I.; Castañeda Quintero, L; Perfiles de uso de redes sociales: estudio descriptivo con alumnado de la Universidad de Murcia. Revista Complutense de Educación 2015, 26, 175–195, 10.5209/rev_rced.2015.v26.46439.
- Sánchez-Rodríguez, J.; Ruiz-Palmero, J.; Sánchez-Rivas, E; Uso problemático de las redes sociales en estudiantes universitarios. Revista Complutense de Educación 2015, 159, 1130–2496, 10.5209/rev_rced.2015.v26.46360.
- Gabriel Valerio Ureña; River Serna Valdivia; Redes sociales y bienestar psicológico del estudiante universitario. Revista Electrónica de Investigación Educativa 2018, 20, 19, 10.24320/redie.2018.20.3.1796.
- Abella García, V.; Delgado Benito, V. Aprender a usar Twitter y usar Twitter para aprender. Profr. Rev. Currículum Form. Profr. 2015, 19, 364–378.
- Rosa García-Ruiz; Ramón Tirado Morueta; Angel Hernando Gómez; Redes sociales y estudiantes: motivos de uso y gratificaciones. Evidencias para el aprendizaje. Aula Abierta 2018, 47, 291-298, 10.17811/rifie.47.3.2018.291-298.
- Doval-Avendaño, M.; Domínguez Quintas, S.; Dans Álvarez, I. El uso ritual de las pantallas entre jóvenes universitarios/as. Prism. Soc. 2018, 21, 480–499.
- García Galera, M.D.C.; Fernández Muñoz, C.; Del Hoyo Hurtado, M. Ciudadanía informada, ciudadanía participativa. la movilización de los jóvenes en el entorno digital. Prism. Soc. 2017, 18, 124–143.