In the present world, cancer is considered as one of the significant cause of death. In the last few years, there is tremendous advancement in the Nanotechnology is offering a cutting edge for cancer treatment by addressing the limitations of conventional therapeutic cancer treatments such as instability and their toxicity to healthy cells.
- Ag-Zn nanoparticles
- anti-cancer activity
- biochemical synthesis
- Cytotoxicity
- Cell line study
- MTT
Nanomaterials are widely used in photonics, electronics, catalysis and medicine.[1][2][3] due to their enhanced physiochemical, structural, optical and electronic applications in contrast with macro materials[4]. Beside these applications, scientists are focusing on biomedical applications of these materials as bioinformatics, biotechnology, bio-imaging, drug delivery, cancer therapy, antimicrobial, antifungal etc[5][6].Nanoparticles are considered as best alternatives for conventional therapeutic treatments of cancer including chemotherapy, immunotherapy and targeted therapy owing to their specific advantages such as stability, less toxicity, biocompatibility, permeability and precise targeting[7]. The main objective is to use nanotechnology for the diagnosis and novel treatment of diseases such as cancer.
Nanomaterials have different dimensions from 0D to 3D. Among those mostly 0D nanoparticles are used due to their vast ap[8]plications and also their easy approach on to the cell, rather than nanorods, nanobars or nanosheets those have problems due to their one of the dimensions greater than 100 nm to achieve the targeted delivery in vivo or in vitro[7].
Additionally, different monometallic (MN) nanoparticles including, metal oxide NPs, metallic NPs, quantum dots and carbon based NPs are widely used in biomedical applications as diagnosis, bioimaging and nanomedicine[9][10][11][12].[13][14][15] Among MNs, Ag and Zn NPs are mostly employed for biomedical applications due to their low toxicity and high biocompatibility[16]. These two NPs are robust due to their easy biodegradability and absorption in the body. Also these are indispensable for humans as they easily regulate in homeostasis and metabolism[17][18]. Earlier, electrodes of ZnO and Ag NPs functionalized MWCNTs were used towards the detection of folic acid, dopamine and paracetamol[19]. The folic acid among other nutrients mainly intake by women during pregnancy. Its deficiency causes gigantocytic anemia, neurosis, leucopoenia and de-evolution of mentality with increasing heart-attack chances[20][21][22]. Folic acid contains imide, tertiary amine, amino, carboxyl, hydroxyl and imino groups, which provides platform for intermolecular hydrogen-bonding, to make chemical linkages with NPs[23][24][25]. Few studies have reported the formation of F.A- ZnO quantum-dots (QDs) for anticancer imaging[26]. Similarly, PVA stabilized F.A/ZnO NPs and PVA-ZnO-F.A films were synthesized and used for antimicrobial activity[27]. Moreover, F.A-ZnO QDs grafted titania-nanotube (TNTs) have been used as antibacterial and drug loading with releasing were also evaluated[28].
Nanoparticles have generally two types which commonly used, (i) monometallic (MN) and (ii) bimetallic (BN). The BN have advantage over MN, due to their higher surface to volume ratio and higher affinity, double action due to two metals.
This study reveals the ecofriendly biochemically synthesized Ag-Zn NPs stabilized with folic acid (F.A). The method adopted was facile and called biochemical due to the use of ecofriendly chemicals namely folic acid (vitamin B12) as stabilizer and ascorbic acid (vitamin C) as reducing agent. These zero dimensional (0-D) Ag-Zn NPs have been used as anticancer agents.
- Materials and Methods
2.1 Chemicals
Ascorbic acid (A.A) (Sigma Aldrich, UK), folic acid (Sigma Aldrich, UK), silver nitrate (Sigma Aldrich, UK) and zinc nitrate (Merck, UK) were used without further purification. To maintain the pH, NaOH was used. The reaction was done in deionized water. Anticancer cell line studies with MTT and crystal violet were purchased from Sigma Aldrich and trypan blue (Invitrogen Inc., USA) have been done. The HepG-2 cancer cell line was collected from Center for Research in Molecular Medicine, The University of Lahore
2.2 Preparation of Ag-Zn@F.A NPs Reaction Mixture
The Ag-Zn NPs stabilized by F.A were synthesized by taking 2.0 g F.A in 50 mL distilled water d water, the solution was stirred for 10-15 minutes at room temperature. The chemical reduction method was adopted for this purpose. Then, equimolar solution of 0.01 mM AgNO3 and Zn (NO3)2.6H2O were stirred together in 10 mL deionized water for 45 minutes by co-precipitation method. This Ag-Zn solution was then added in F.A reaction container and elevate the temperature upto 65℃ under nitrogen purge to produce oxygen free zone. Now, 5 mL of 0.05 M ascorbic acid was added dropwise to reduce the Ag-Zn to NPs and pH was enhanced to 8.8 using 0.09 M NaOH. The color of the reaction environment changes to light pale yellow to dark. The mixture was washed with alcohol followed by centrifugation over 7000 rpm to separate liquid and solid Ag-Zn@F.A NPs products, ready to subjected for characterization and applications (Fig. 1).
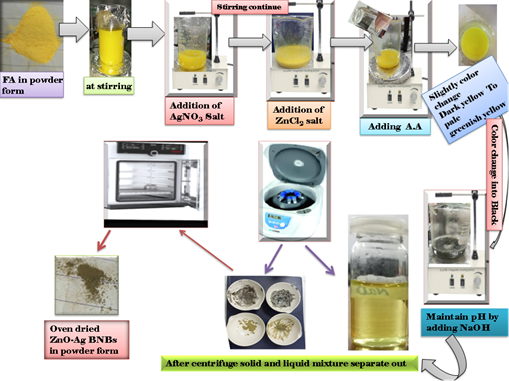
Figure 1. Figure 1. Schematic representation of Ag-Zn NPs@F.A
2.3 Instrumentation
To analyze Ag-Zn@F.A NPs UV/Vis (CECIL CE7400s Aquarius, UK) was used to determine the presence of Ag-Zn@F.A NPs inside the reaction mixture. Also, it was used for antioxidant activity for full scan 300-800 nm. The functional groups present in Ag-Zn@F.A NPs were determined over ATR-FTIR (Bruker α-II, UK). The x-ray diffraction (Bruker D8, UK) having specifications, Cu-Kα with 1.5406Å λ, was done to confirm the crystallinity, Millar indices, crystallite size and the nature of Ag and Zn metals. The topology of Ag-Zn@F.A NPs with % elemental analysis (EDX) were visualized over FESEM (NOVA 450, LUMS Pakistan).
2.4 Making solution of Drug
0.024µg of powdered drug is added in 50ml water and sonicate it for 20 minutes in sonicator.
2.5 Culturing of HepG-2 Cell Lines
The HepG-2 cell line was cultivated with the DMEM-HG in a culturing Flask along with PRP, streptomycin and penicillin was added. HepG-2 cells achieved 70-80% confluence when cultivated. The splitting was conducted by washing with normal saline and incubated with trypsin-EDTA until the cells detached from the walls of the culturing flask. PRP was added to the culturing flask and stirred. Centrifugation of the mixture was done at 2000 rpm for 5 minutes. After centrifugation the supernatant was discarded and pellet was re-platted.
2.6 Treatment of HepG-2 cell line with plant extracts
HepG-2 cell lines at 2nd passage were culture onto 96-well plate for cell proliferation Cultured -HepG-2 cell lines were divided into six groups for Ag-Zn NPs@F.A. One of each six groups was considered as normal. Remaining five groups for Ag-Zn NPs@F.A were named as HepG-2 treated with 10 µg, 50µg, 100µg, 200µg and 400µg respectively. The cultured cells were then subjected to 24 hours’ treatment. Later 24 hours, 96 well plates used for cell proliferation assay, trypan blue, crystal violet assay and the harvested medium from all experimental groups was used for further biochemical assays.
2.7 Cell proliferation assay
To compare proliferative potential of different groups of HepG-2 cell line, MTT assay was conducted on 96 well plate for cultured cells. Phosphate buffer saline (PBS) (Invitrogen Inc., USA) was used to wash the monolayer of cells, afterwards the cells were incubated with MTT solution (Invitrogen Inc., USA) for 2 h. Tetrazolium salt is converted into purple colored formazan in living cells which is used to measure the cell activity and measured at 570nm(Fig. 2).
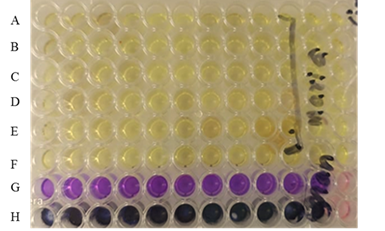
Figure 2. 96 well plate while performing MTT assay in ‘A’ to ’F’ rows, Crystal Violet assay in ’ G’ row and Tryptan blue assay in ‘H’ row
2.8 Trypan Blue
Trypan blue is used as prohibiting agent for live and dead cells to assess the cell viability. The cells were washed with PBS, incubated in Trypan blue in a 96 well plate for 15 minutes and examined under microscope. Stained cells with trypan blue were considered as dead. Percentage was calculated by dividing cells without staining with total number of cell sand multiplying by 100.[29]
2.9 Crystal violet
Crystal violet is used to assess the cell viability. Medium from different experimental group was discarded from wells of plate and washed with PBS. After washing 0.1% crystal violet dye mixed with 2% ethanol was added on the wells, incubated at room temperature for 15 minutes. Dye was discarded from the wells. Solubilization of the stain was done by adding 100µl of 1% SDS for 10-15 minutes in each well. The absorbance was taken at 590nm on micro titer plate[30].
- Results and discussion
3.1 UV/Vis
The UV/Vis studies were used to reveal the confirmation of Ag-Zn@F.A NPs. The peaks at 360 nm and 440 nm appeared due to the Zn and Ag NPs respectively, which depicts the presence of Ag-Zn NPs inside system. Mostly the λmax of Ag NPs appeared between 400-430 nm and Zn around 350-380 nm [31]. But here the red shift in λmax of Ag NPs arose due to the existence of Zn NPs. Moreover, spectra of F.A and Ag-Zn NPs@F.A shows clearly the presence of Ag and Zn NPs at respective λmax as there were no peaks appeared at these wavelengths in F.A spectrum (Fig. 3a).
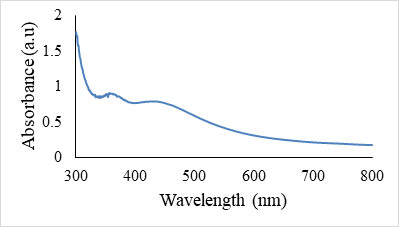
Figure 3a. UV/Vis spectra of Ag-Zn NPs@F.A
3.2 FTIR
To find the functional groups present in Ag-Zn NPs@F.A, ATR-FTIR studies were done (Fig.3b). The absorption peaks were examined in the scanning range from 4000-550 cm-1. The functional groups owing to capping (F.A) and reducing (A.A) agent present in Ag-Zn@F.A NPs shows the absorption peaks at 1590 cm-1 due to imide group’s stretching vibration of F.A and peaks at 1010 cm-1 correlate with C-C stretching of –COOH, R-OH, RCOOR’, R-O-R of A.A[32]. Furthermore, 1590 cm-1 peak can be credited to –NH3 of amino acids[33]. The 1342 cm-1 peak attributed to C-N stretching vibrations associated to aromatic amines[34]. The broad –OH stretching illustrates at 3273 cm-1, which provides attachment sites for Ag-Zn NPs for stabilization and 2925 cm-1 appeared due to C-H stretching, which isn’t much broader in folic acid’s spectrum[35][36]. Phenyl group’s peak appeared at 753 cm-1[37].
3.3 SEM and EDX
To evaluate the morphology of Ag-Zn@F.A NPs, SEM micrographs were taken for different resolutions 200 nm, 500 nm and 1µm for Ag-Zn NPs and at 500 nm for F.A. The figure represents the voids in F.A’s topology. These pores are available for the stabilization of Ag-Zn NPs (Fig. 4(i-iv)). These NPs have strong interactions with F.A which stabilizes them. The DLS (Fig. 4a) shows the average particle size (Davg) of Ag-Zn@F.A NPs around 65.22 nm. Furthermore, EDX result proving the presence of Ag and Zn NPs inside F.A voids by showing their peaks at different dispersive energy values in Fig. 4b.
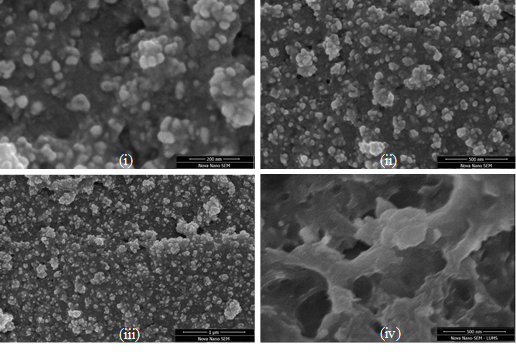
Figure 4. (i-iv) SEM images of Ag-Zn@F.A NPs at different resolutions
3.4 XRD analysis
To evaluate the crystallinity of Ag and Zn metals, XRD was used as characterization technique. The Cu-Kα was used as X-ray source with wavelength 1.54 Å. The 2θ peaks at 28.25, 40.39, 50.51, 66.15 and 73.02 having Miller indices values (100), (110), (111), (210) and (211) respectively endorse that the Ag-Zn are cubic in nature which in evidence with JCPDS (29-1155)[38]. The crystallite size (D) was 3.29 nm calculated using Debye Scherer equation (eq. 1). Details of XRD analysis has been enlisted in table 1.
D = Kλ / βcos(θ) (eq. 1)
Table 1. XRD pattern’s data of Ag-Zn NPs stabilized by F.A
|
2 thetha |
Theta |
d spacing (A) |
Hkl |
FWHM |
D (nm) |
Average Crystallite Size (nm) |
|
28.25 |
14.125 |
3.156 |
100 |
0.32921 |
4.632 |
3.2964 |
|
40.39 |
20.195 |
2.231 |
110 |
0.65339 |
2.411 |
|
|
50.51 |
25.255 |
1.822 |
111 |
0.56002 |
2.92003 |
|
|
66.15 |
33.075 |
1.411 |
210 |
0.59222 |
2.9802 |
|
|
73.02 |
36.51 |
1.288 |
211 |
0.51991 |
3.5392 |
3.5 Anticancer activity
The anti-proliferative and cytotoxicity effect of Ag-Zn@F.A NPs against HepG-2 was performed. The study demonstrates remarkable cytotoxic action against cancer cells. (Fig. 6) The graph depicts the antiprolifrative activity of nanoparticle on Hep-G2 cell line using various concentrations concentration i.e: 10µg/mL, 50µg/mL, 100µg/mL, 200µg/mL and 400µg/mL of Ag-Zn@F.A NPs. In vitro cytotoxic activity against Hep-G2 at various concentrations was evaluated and compared with the standard drug cyclophosphamide There was not any significant cytotoxic effect shown in the graph when cells treated with concentration from 10µg/ml to 100µg/ml while a drastic decrease in cell viability was observed when dose increases to 200µg/ml. The anticancer activity is greatly influenced by Ag-Zn@F.A NPs concentration.. The highest dose which shows highest cytotoxic effect was 400µg/ml which reduces the approximated 70% cell viability when compared to the control (Fig. 6). Ag-Zn@F.A NPs exhibit good results when compare with the standard cyclophosphamide. Immune cells infiltration is very challenging in the extracellular matrix caused by cancer cells. Conventional treatments interfere with the cell functioning and causes adverse effects on cells, this increases the demand for a novel method of treatment for precise targeting of cancer cells[39][40][41].
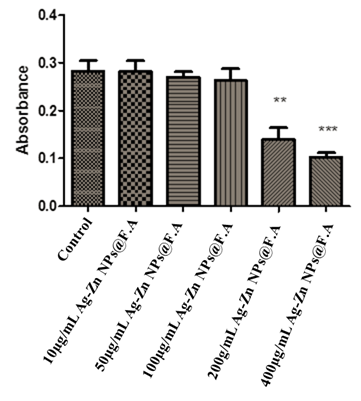
Figure 6. Anticancer potential of different concentrations of Ag-Zn@F.A NPs, When compared with control. Where* showing the significance difference between a control and treatments P≤0.05.
Statistical analysis
The grouped data were statistically evaluated and presented as the mean ±SD of the four replicates of each experiment Table 2.
Table 2. Values obtained on Graph Pad Prism using Ag-Zn@F.A NPs
|
MTT |
Control |
10µg/ml |
50µg/ml |
100µg/ml |
200µg/ml |
400µg/ml |
|
Mean |
0.281
|
0.281
|
0.270
|
0.262
|
0.139
|
0.102 |
|
Standard deviation |
±0.0395 |
±0.0395
|
±0.0193 |
±0.0428 |
±0.0432 |
±0.0166 |
3.6 Crystal violet
Cell viability of Hep-G2 cell line after the treatment of Ag-Zn@F.A NPs at the highest effective concentrations. The graph illustrates that, there were approximated 50% of the cell viability was observed after treated with Ag-Zn@F.A NPs when compared to the control cells (Fig. 7).
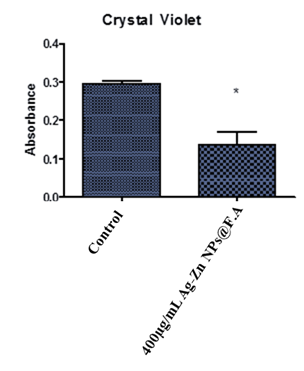
Figure 7. Anticancer potential of nanoparticle, where 1st group is control 2nd is Ag-Zn@F.A NPs 400µg/mL. Where * showing the significance difference between a control and treatments P≤0.05.
3.7 Trypan Blue
The followed graph depicts the difference between live and dead cells after the treatment of Ag-Zn@F.A NPs. When Hep-G2 cells treated with the highest effective concentration (400µg/ml) of Ag-Zn@F.A NPs, it shows the dead cells due to the toxicity of the nanoparticle which shows the absorbance of dead cell which were approximated 80% of the total cells (Fig. 8).
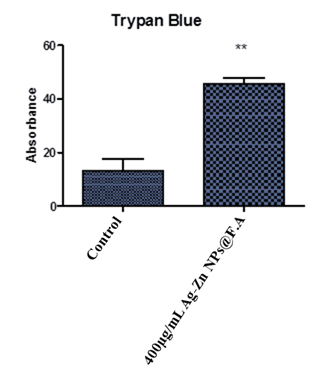
Figure 8. Percentage of dead cells in cancer cells treated with Ag-Zn@F.A NPs, where 1st group is control 2nd is Ag-Zn@F.A NPs 400µg/mL. Where* showing the significance difference between a control and treatments P≤0.05.
Living organisms are made up of cell. The subunits of cells carry proteins which are nano sized, even smaller than 5nm, these proteins are camparable to the nanoparticles and thus can be used as precise targeted therapy without interfereing cell signaling pathway that are vital in malignant behaviors and normal homeostatic functions of the epidermis and dermis[42]. Physiochemical interactions of the Ag-Zn@F.A NPs with the nitrogen bases, phosphate group of DNA and functional groups of the intracellular protein are responsible for the cytotoxic effect of Ag-Zn@F.A NPs[43]. The former studies revealed that the nanoparticles show potential ability to decelerate the activities of abnormally expressed signaling proteins, for instance Akt and Ras, cytokine-based therapies, DNA- or protein based vaccines against specific tumor markers, and tyrosine kinase inhibitors which exhibit a consistent antitumor effect[44][45].
- Conclusions
In the present study, folic acid was used as reducing agent for the synthesis of Ag-Zn@F.A NPs. UV–Vis spectroscopy and FT-IR analysis confirmed the formation of the Ag-Zn@F.A NPs. The size of Ag-Zn@F.A NPs was confirmed by SEM analysis, which illustrates that Ag-Zn@F.A NPs were spherical in shape with size ranging from 21 to 98 nm. The Ag-Zn@F.A NPs were compared and showed promising cytotoxicity activity against HepG-2 cell line. This method was simple, efficient, and environment friendly. From the study, it can be concluded that these nanoparticles possess high cytotoxicity activity against cell line which suggests the potential therapeutic use of these nanoparticles for further research for treating cancer.
References
- S. Hong, S. Myung, Nature nanotechnology, 2 (2007) 207-208
- B.K. Teo, X.H. Sun, Chemical Reviews, 107 (2007) 1454-1532.
- D.F. Emerich, C.G. Thanos, Expert opinion on biological therapy, 3 (2003) 655-663.
- E. Roduner, Chemical Society Reviews, 35 (2006) 583-592.
- S.M. Moghimi, A.C. Hunter, J.C. Murray, The FASEB journal, 19 (2005) 311-330.
- K. Riehemann, S.W. Schneider, T.A. Luger, B. Godin, M. Ferrari, H. Fuchs, Angewandte Chemie International Edition, 48 (2009) 872-897.
- S. Gavas, S. Quazi, T.M. Karpiński, Nanoscale Research Letters, 16 (2021) 1-21.
- Z. Cheng, M. Li, R. Dey, Y. Chen, Journal of Hematology & Oncology, 14 (2021) 1-27
- R.R. Arvizo, S. Bhattacharyya, R.A. Kudgus, K. Giri, R. Bhattacharya, P. Mukherjee, Chemical Society Reviews, 41 (2012) 2943-2970.
- S. Laurent, D. Forge, M. Port, A. Roch, C. Robic, L. Vander Elst, R.N. Muller, Chemical reviews, 108 (2008) 2064-2110.
- Z.F. Yin, L. Wu, H.G. Yang, Y.H. Su, Physical chemistry chemical physics, 15 (2013) 4844-4858.
- L. Lacerda, A. Bianco, M. Prato, K. Kostarelos, Drug Deliv. Rev, 58 (2006) 1460-1470.
- H. Hong, T. Gao, W. Cai, Nano today, 4 (2009) 252-261.
- Y. Wang, L. Chen, Nanomedicine: Nanotechnology, Biology and Medicine, 7 (2011) 385-402.
- R. Hao, Synthesis, functionalization, and biomedical applications of multifunctional magnetic nanoparticles. adv Mater, 22 (2010) 2729-2742.
- C. Bi, J. Li, L. Peng, J. Zhang, Biomed. Res, 28 (2017) 2065-2069.
- O.C. Farokhzad, R. Langer, Advanced drug delivery reviews, 58 (2006) 1456-1459.
- J. Zhou, N.S. Xu, Z.L. Wang, Advanced Materials, 18 (2006) 2432-2435.
- M. Kumar, B.K. Swamy, S. Reddy, W. Zhao, S. Chetana, V.G. Kumar, Journal of Electroanalytical Chemistry, 835 (2019) 96-105.
- S.N. Young, Canadian Journal of Physiology and Pharmacology, 69 (1991) 893-903.
- H. Beitollahi, I. Sheikhshoaie, Journal of Electroanalytical Chemistry, 661 (2011) 336-342.
- X. Wang, Z. You, Y. Cheng, H. Sha, G. Li, H. Zhu, W. Sun, Journal of Molecular Liquids, 204 (2015) 112-117.
- A. Vora, A. Riga, D. Dollimore, K.S. Alexander, Thermochimica Acta, 392 (2002) 209-220.
- S. Palanikumar, L. Kannammal, B. Meenarathi, R. Anbarasan, International Nano Letters, 4 (2014) 1-9.
- F. Muhammad, M. Guo, Y. Guo, W. Qi, F. Qu, F. Sun, H. Zhao, G. Zhu, Journal of materials chemistry, 21 (2011) 13406-13412.
- Y.-Y. Ma, H. Ding, H.-M. Xiong, Nanotechnology, 26 (2015) 305702.
- S. Mallakpour, M. Lormahdiabadi, Journal of Polymer Research, 27 (2020) 1-16.
- Y. Xiang, X. Liu, C. Mao, X. Liu, Z. Cui, X. Yang, K.W. Yeung, Y. Zheng, S. Wu, Materials Science and Engineering: C, 85 (2018) 214-224.
- D.L. Felice, J. Sun, R.H. Liu, Journal of Functional Foods, 1 (2009) 109-118.
- M. Feoktistova, P. Geserick, M. Leverkus, Cold Spring Harbor Protocols, 2016 (2016) pdb. prot087379.
- K.A. Elsayed, M. Alomari, Q. Drmosh, M. Alheshibri, A. Al Baroot, T. Kayed, A.A. Manda, A.L. Al-Alotaibi, Alexandria En-gineering Journal, 61 (2022) 1449-1457.
- A. Khorramdoust, M. Ashoor, K. Saberyan, A. Eidi, Digest Journal of Nanomaterials and Biostructures, 12 (2017) 909-915.
- T. Häber, U. Schmitt, C. Emmeluth, M.A. Suhm, Faraday Discussions, 118 (2001) 331-359.
- H. Veisi, L. Mohammadi, S. Hemmati, T. Tamoradi, P. Mohammadi, ACS omega, 4 (2019) 13991-14003.
- N.A. Ibrahim, A.A. Nada, A.G. Hassabo, B.M. Eid, A.M. Noor El-Deen, N.Y. Abou-Zeid, Chemical Papers, 71 (2017) 1365-1375.
- X. Li, J. Hu, R. Qiu, X. Zhang, Y. Chen, D. He, Environmental Science: Nano, 7 (2020) 3062-3073.
- S. Ali, A. Riaz, H. Nawaz, M.I. Majeed, M.A. Iqbal, H.N. Bhatti, N. Rashid, M. Kashif, M. Tahir, S. Nasir, Spectrochimica Acta Part A: Molecular and Biomolecular Spectroscopy, 232 (2020) 118162.
- ] C. Sun, R. Sze, M. Zhang, Journal of Biomedical Materials Research Part A: An Official Journal of The Society for Bio-materials, The Japanese Society for Biomaterials, and The Australian Society for Biomaterials and the Korean Society for Biomaterials, 78 (2006) 550-557.
- S.A. Rosenberg, N.P. Restifo, J.C. Yang, R.A. Morgan, M.E. Dudley, Nature Reviews Cancer, 8 (2008) 299-308.
- E.E. Voest, R. Bernards, Cancer Discovery, 6 (2016) 130-132.
- M. Lacouture, V. Sibaud, American journal of clinical dermatology, 19 (2018) 31-39.
- I. Melero, A. Rouzaut, G.T. Motz, G. Coukos, (2014).
- Y.P. Blagoi, V. Galkin, G. Gladchenko, S. Kornilova, V. Sorokin, A. Shkorbatov, 1991.
- M.I. Sriram, S.B.M. Kanth, K. Kalishwaralal, S. Gurunathan, International journal of nanomedicine, 5 (2010) 753
- D. Martins, L. Frungillo, M.C. Anazzetti, P.S. Melo, N. Durán, International journal of nanomedicine, 5 (2010) 77.