Your browser does not fully support modern features. Please upgrade for a smoother experience.
Please note this is a comparison between Version 1 by Sujit Nair and Version 2 by Rita Xu.
Diabetes is one of the most frequently occurring metabolic disorders, affecting almost one tenth of the global population. Noncoding RNAs (ncRNAs), including microRNAs (miRNAs) and long noncoding RNAs (lncRNAs), are involved in the regulation of gene expression as well as various disease pathways in humans. Several ncRNAs are dysregulated in diabetes and are responsible for modulating the expression of various genes that contribute to the ‘symptom complex’ in diabetes.
- microRNA
- lncRNA
- biological network
- signal transduction
- clinical trial
- epigenetics
- diabetes
- diabetic nephropathy
1. Introduction
Diabetes is the most commonly occurring metabolic disorder, affecting almost 366 million people, and is estimated to affect 10% of the world population by 2035 [1]. It is characterized by elevated blood glucose (hyperglycemia) occurring due to malfunctions in insulin action, insulin production or both [2]. There are three main types of diabetes mellitus—type 1 diabetes (T1D), type 2 diabetes (T2D) and gestational diabetes mellitus (GDM). Type 1 is caused by an autoimmune reaction destroying beta cells, which eventually leads to hampered production of insulin in the body. T2D occurs when the body fails to use insulin properly, causing dysregulation of blood glucose. Gestational diabetes is a condition that develops during pregnancy. However, gestational diabetes usually subsides post-pregnancy [3]. Diabetes was the seventh leading cause of death in the U.S. in the year 2017 [4]. Globally, in the year 2019, the prevalence of diabetes was estimated to be 9.3% (463 million worldwide) and was predicted to rise to 10.2% (578 million globally) by the year 2030 and to 10.9% (700 million globally) by 2040 [5].
Noncoding RNAs (ncRNAs) are a heterogenous group of RNA molecules which do not code for any proteins but play a major role in post-transcriptional gene regulation and epigenetic gene silencing. Introns which are present in both protein-coding and non-protein-coding genes are the major source of regulatory noncoding RNAs [6]. Examples of ncRNAs include microRNAs (miRNAs), long noncoding RNAs (lncRNAs), small interfering RNAs (siRNAs), circular RNAs (circRNAs), competing endogenous RNAs (ceRNAs) and piwi-interacting RNAs (piRNAs) [7]. MiRNAs are a class of small endogenous molecules comprising around 21 nucleotides. They are known to regulate cell cycle proliferation, differentiation, angiogenesis and apoptosis by repressing biomolecules such as RNA transcripts, which regulate these processes, or via the degradation of mRNA [8]. Studies show [9] that miRNAs have complementarity to their target genes and, thus, can regulate different mRNA targets. miRNAs are produced from a double-stranded stem–loop structure generated from an endogenous single-stranded precursor, which is further processed by two endonucleases, RNase III enzyme drosha and RNase III endonuclease dicer complex. It has been reported that the knockdown of the dicer enzyme-encoding gene in pancreatic beta cells leads to the development of diabetes [10]. MiRNA expression studies have shown that miR-375 is highly expressed in islet cells. The dysregulation of miR-375 affects the insulin-secreting beta cells. Other abundantly expressed miRNAs in islet cells, such as miR-29a, miR-29b, miR-200 and miR-7, influence the synthesis of insulin by playing a role in the development and proliferation of beta cells and, thus, can be proposed as biomarkers for diabetes [11].
Biological networks have been useful in studies to decipher disease etiologies and biological mechanisms, and in studies predicting therapeutic responses at system as well as molecular levels [12]. Biological networks help to find and prioritize candidate genes responsible for various diseases, facilitate target identification and are involved in drug discovery by capturing therapeutic responses and identifying systemic perturbations and disease-associated subnetworks [13]. RWesearchers have previously elucidated the ncRNA interactome in cancer chemoprevention [7][14][15][7,14,15], mesothelioma [8], prostate cancer [16] and neuropathic pain [17], and also delineated miRNA-lncRNA interactions [18]. Cell-free RNAs, also called extracellular RNAs [19], are released into the circulatory system as a result of cell necrosis or apoptosis [20][21][20,21]. Cell-free ncRNAs have been observed to be dysregulated in peripheral blood samples of T2D patients. For example, miR-29a and miR-29b were upregulated, whereas lncRNA H19 was downregulated [22], exosomal miR-20b-5p was upregulated [23] and miR-210 was upregulated in peripheral blood [24]. Further, circRNA hsa-circCAMSAP1 in the peripheral blood of patients had a negative association with T2D [25], and hsa-circRNA11783-2 was reported to be downregulated in T2D [26].
Diabetic neuropathy is the most common symptom associated with diabetes, wherein the structure and function of the peripheral nerves are affected. RWesearchers have recently discussed the molecular pathways underlying the health-beneficial role of K2-7 in diabetes and other complications, and also summarized several clinical trials involving K2-7 supplementation as a useful intervention [27]. In addition, reswearchers have reviewed the utility of K2-7 supplementation in the global diet and underscored its beneficial effects in managing peripheral neuropathy resulting from diabetes [28]. Other conventional medications in the management of diabetes may cause unpleasant side effects to patients, eventually leading to non-compliance and even failure of treatment [29].
2. Dysregulated Human ncRNAs in Diabetes
2.1. Dysregulated ncRNAs in T1D
2.1.1. Upregulated miRNAs in T1D
A study [30][33] investigating the miRNA expression profile using plasma samples of 33 T1D patients reported that several miRNAs such as miR-21-5p, miR-101-3p, miR-103a-3p, miR-148b-3p, miR-155-5p, miR-200a-3p, miR-210-3p and miR-1275 were significantly upregulated. Among these miRNAs, the expressions of miR-21 and miR-101 were induced by inflammatory cytokines (TNF and IL-1β) [31][34], showing their role in beta-cell destruction mediated by cytokines. Further, miR-200a-3p regulates TP53 in the apoptosis pathway along with other genes involved in the insulin pathway and innate immune system; miR-210-3p regulates PTPN1 (tyrosine-protein phosphatase non-receptor type 1) in the insulin pathway; and IRS2 (Insulin receptor substrate 2) is regulated by both miR-200a-3p and miR-103a-3p [30][33]. Interestingly, there was no difference detected in the miRNA expression between the control group and T1D patients diagnosed for more than 5 years. Barutta et al. [32][35] conducted a cross-sectional nested case–control study to examine the differential expression of miRNAs in the serum samples of type 1 diabetic patients. It was reported that miR-140-3p, miR-574-3p, miR-139-5p, miR-106a, miR-17, miR-486-3p, miR-16, miR-222 and miR-885-5p were significantly upregulated. CXCL10 is targeted by miR-16, resulting in the inhibition of pancreatic β-cells [33][36]. Vascular homeostasis is regulated by miR-222 by negatively regulating STAT5A (signal transducer and activator of transcription 5A) in T1D patients, showing its anti-angiogenic properties [34][37]. In a study [35][38] using isolated human islets exposed to high glucose concentrations, and the serum samples of 22 patients with T1D, miR-23a and miR-98 were reported to be highly upregulated and targeted important signaling pathways involved in β-cell regulation and islet homeostasis, indicating that they might be useful biomarkers for T1D. miR-197 was seen to be highly overexpressed in the serum samples of children with new-onset T1D [36][39]. It was also suggested that residual beta-cell function can be efficiently predicted by miR-197. The study further reported a significant partial correlation between miR-197 and stimulated C-peptide levels, indicating the critical role of miR-197 in insulin production. Moreover, using human activated CD4+ T cells, Scherm et al. [37][40] reported that miR-142-3p played a crucial role in the inhibition of T-cell activation, causing impaired stability of Treg cells. Elevated levels of miR-142-3p were reported to be linked to epigenetic remodeling in Treg cells, leading to islet autoimmunity, which is an indication of the onset of T1D.2.1.2. Upregulated lncRNAs in T1D
lncRNA SRA was reported [38][41] to be overexpressed in the plasma samples of 25 patients with T1D as well as in CD4+ regulatory T cells (Tregs) induced with high glucose in the CD4+ MOLT4 human T lymphoblast cell line. lncRNA SRA modulates the expression of miR-146b, which is downstream of interleukin-1 receptor-associated kinase 1 (IRAK1)/protein kinase B (AKT)/S6 Kinase 1 (S6K1) signaling. However, lncRNA SRA and miR-146b reciprocally regulate each other, which indicates that lncRNA participates in crosstalk with IRAK1/AKT/mTOR signaling by competing with miR-146b. A positive association between lactate levels and hemoglobin A1c (HbA1c) was observed in the plasma of T1D patients. lncRNA SRA played a major role in the pathogenesis of T1D by inhibiting miR-146b via promotion of the IRAK1/lactate dehydrogenase A (LDHA)/phosphorylated LDHA (pLDHA) signaling pathway.2.1.3. Downregulated miRNAs in T1D
Significant downregulation of miR-155, miR-92a and miR-126 was seen in the serum samples of T1D patients [32][35]. miR-92a regulates NF-κB and other inflammatory signaling pathways, aiding in the progression of cardiovascular disease associated with diabetes [39][42]. Further, miR-126 plays a role in maintaining endothelial homeostasis, which is a common characteristic in diabetes [40][43]. In addition, miR-126 controls endothelial inflammation in patients with micro/macrovascular disorders associated with diabetes, which provides a link between diabetes-associated complications and lower levels of miR-126 [41][44].2.2. Dysregulated ncRNAs in T2D
2.2.1. Upregulated miRNAs in T2D
miR-29a was upregulated in the serum samples of type 2 diabetic patients [42][45]. It was concluded that the overexpression of miR-29a represses glucose uptake via insulin stimulation, eventually causing resistance to insulin. In another study investigating the dysregulation of miR-34a, using the plasma samples of patients with T2D [43][46], it was observed that miR-34a was significantly upregulated, which was associated with senescence in pancreatic β-cells with a decrease in SIRT1 activity [44][47]. Interestingly, circulating miR-1 and miR-133a showed a positive association with myocardial steatosis in a study including T2D patients [45][48]. The elevated expression of miR-1 and hsa-miR-133a in the serum samples of T2D patients was an indicator of myocardial steatosis. Amr et al. reported that the plasma level of miR-210 was critically elevated in T2D patients with coronary artery disease. Indeed, miR-210 is linked with the hypoxia pathway and upregulated in response to hypoxia-inducible factor HIF1α [46][49].2.2.2. Upregulated lncRNAs in T2D
LncRNA-p3134 was highly upregulated in a study [47][50] conducted using whole blood samples of T2D patients. Using bioinformatic analysis, it was reported that lncRNA-p3134 targets mRNAs, viz., TNS1, ASZ1, DIAPH1, IFNA14, ZNF436, MTMR3, CDK1, PPARD, TCF7, HUWE1 and CCND2 and regulates their biological functions. Sathishkumar et al. [48][51] studied the differential expression of lncRNAs in the peripheral-blood mononuclear cells (PBMCs) from patients with T2D wherein the lncRNAs ANRIL, ENST00000550337, GAS5, HOTAIR, lincRNA-p21 and PLUTO were significantly overexpressed in diabetic patients. The lncRNAs ANRIL, GAS5 and HOTAIR show a positive correlation with senescence-related biomarkers (p16, p21, p53 and β-galactosidase) and pro-inflammatory biomarkers (IL1- β, MCP1, IL6 and TNF-α) [48][51].2.2.3. Downregulated miRNAs in T2D
In a study comprising of 327 T2D patients with varying levels of urinary albumin-to-creatinine ratios (UACR) [49][52], it was observed that miR-130b was highly suppressed in the serum samples of the patient group with the highest UACR. It was also observed that serum miR-130b was negatively correlated with HbA1c and HIF1-α levels. Additionally, the circulating serum miR-130b was closely related to blood glucose levels and insulin resistance inT2DM. The study further reported that miR-130b can be a biomarker for the early identification of diabetic nephropathy in T2D. Significant downregulation of let-7b was seen in the peripheral whole-blood samples of T2D patients [50][53]. miRNA let-7b targeted T2D-susceptibility genes such as IGF2BP2, TSPAN8, CDKN2A and KCNQ1. Additionally, downregulation of miR-214-3p and miR-27-3p was reported in the whole-blood samples of patients with T2D and also in a population with T2D risk factors [51][54], suggesting that they might be potential biomarkers for T2D.2.2.4. Downregulated lncRNAs in T2D
A study [52][55] was conducted in 200 participants divided into two groups (diabetic and healthy volunteers). The differential expression of lncRNA VIM-AS1 and CTBP1-AS2 was studied in the PBMCs of these participants, and significant downregulation of both these lncRNAs was reported. Further, lncRNA CTBP1-AS2 was positively correlated with low-density-lipoprotein cholesterol (LDL-C) levels and negatively correlated with high-density-lipoprotein cholesterol (HDL-C) levels. No significant correlation between metabolic features and lncRNA VIM-AS1 was observed in the study. The target genes of the lncRNAs CTBP1-AS2 and VIM-AS1 were significantly enriched in pathways relevant to glucose homeostasis such as the mTOR, Hippo, TGF-β, insulin and Wnt signaling pathways.2.3. Dysregulated ncRNAs in Diabetic Retinopathy
2.3.1. Upregulated miRNAs in Diabetic Retinopathy
Li et al. [53][56] explored novel non-proliferative diabetic retinopathy (NPDR)-specific circulating miRNAs in T2D mellitus patients. It was observed that miR-190a was highly expressed in the serum samples of NPDR patients. Further, it was noted [54][57] that miR-2116-5p and miR-3197 were critically upregulated in the serum samples of diabetic patients with retinopathy, which made it an important factor in differentiating between patients with and without DR. Notch homolog 2 (NOTCH2) was reported to be a target gene of miR-2116-5p in human embryonic kidney cells (HEK293T). Enhanced miR-20a-5p and -223-3p expression was seen in the serum samples of T2D patients with retinopathy, suggesting their critical role in the early detection of diabetic retinopathy [55][58].2.3.2. Upregulated lncRNAs in Diabetic Retinopathy
A study [56][59] using the serum samples of 80 diabetic patients with either non-diabetic retinopathy (NDR), NPDR or proliferative diabetic retinopathy (PDR) was conducted to investigate the differential expression of lncRNAs. lncRNA HOTAIR and lncRNA MALAT1 (metastasis-associated lung adenocarcinoma transcript 1) were reported to be significantly upregulated in all groups. MALAT1 is a highly conserved lncRNA playing an important role in diabetes progression by modulating genes at the transcription level. MALAT1 has also been reported to be a regulator of the hyperglycemia-induced inflammatory process [57][60]. HOX transcript antisense intergenic RNA (HOTAIR), located on chr.12q13.13, is expressed abnormally in several disorders involving T1D. It is involved in distinguishing between diabetic and non-diabetic retinopathy as the expression levels of HOTAIR are increased in diabetic retinopathy [56][59]. The lncRNA HOTAIR also plays a role in regulating glucose levels by inducing insulin transcription-related genes, suggesting that glucose metabolism is closely associated with HOTAIR [58][61]. Li et al. [59][62] reported upregulation of lncRNA-MIAT in plasma samples of patients with NPDR and patients without diabetic retinopathy, as well as in human adult retinal pigment epithelial cells (ARPE-19) in a high-glucose environment. It was suggested that overexpressed lncRNA-MIAT was associated with diabetic retinopathy and reduced viability of ARPE-19 cells by upregulating TGFβ1. Upregulation of lncRNA KCNQ1OT1 in the serum samples of patients with PDR and NPDR, as well as in human retinal endothelial cells (hRECs), was observed. lncRNA KCNQ1OT1 promoted the expression of EGFR by inhibiting miR-1470. The lncRNA KCNQ1OT1 also plays a role in the proliferation and epithelial-to-mesenchymal transition (EMT) of lens epithelium, thus aiding in the progression of diabetes retinopathy [60][63].2.3.3. Downregulated miRNAs in Diabetic Retinopathy
Prado et al. [61][64] examined differential miR-320a expression in the plasma samples of diabetes patients with and without diabetic retinopathy. Downregulation of miR-320a was observed in patients with diabetic retinopathy. Further, it was reported that miR-320 targeted about 16 genes: YOD1, YWHAE, PTEN, TSC1, CDK6, MAPK8IP3, IGF2BP3, ARPP19 and FOXM1, which play roles in the regulation of cellular response to stress, the cell cycle and the negative regulation of the cellular protein metabolic process. PDX3 (a homolog of PDX1) and GXYLT1 have been implicated in regulating pancreatic development [62][63][64][65][65,66,67,68]. Li et al. [53][56] determined the expression of miRNAs from the peripheral serum of 21 T2D patients and reported that miR-485-5p, miR-4448, miR-9-5p and miR-338-3p were suppressed in patients with diabetic retinopathy. It was suggested that these miRNAs can be useful in early diabetic retinopathy risk prediction. Molecular pathway studies and analysis revealed that the aforementioned miRNAs target four genes, viz., SIRT1, FOXO1, FOXO3 and NFKB1. Target gene prediction revealed that SIRT1 (an important regulator of the revascularization of ischemic tissues) is the potential target of miR-338 and miR-9-5p, whereas FOXO1 and FOXO3 (regulating vascular morphogenesis) were targets for miR-485-5p, miR-338-3p and miR-9-5p. It has been reported [66][69] that miR-423 is negatively associated with the progression of diabetic retinopathy since it is highly downregulated in the serum samples of patients with proliferative diabetic retinopathy.2.3.4. Downregulated lncRNAs in Diabetic Retinopathy
Downregulation of lncRNA AK077216 was reported in a study [67][70] conducted using the plasma samples of 60 diabetic retinopathy patients. Downregulated lncRNA AK077216 was observed only in diabetic retinopathy patients as compared to diabetic patients with no complications and controls. miR-383 was negatively associated with lncRNA AK077216 in diabetic retinopathy patients. Subsequently, ARPE-19 cells were used to analyze the expression of lncRNA AK077216 under high-glucose conditions. There was no significant effect of high glucose on lncRNA AK077216 in ARPE-19 cells; however, lncRNA AK077216 was reported to modulate ARPE-19 cell apoptosis by targeting miR-383.2.4. Dysregulated ncRNAs in Diabetic Nephropathy
2.4.1. Upregulated miRNAs in Diabetic Nephropathy
Wu et al. [68][71] reported significant upregulation of miR-27a-3p in human HK-2 cells treated with high glucose. Further, it was observed that miR-27-3p inhibits the expression of prohibitin and transmembrane BAX inhibitor motif containing 6 (TMBIM6), which play a role in the progression of diabetic nephropathy. Thus, the upregulation of miR-27a-3p is positively associated with diabetic nephropathy via miR-27a-3p-prohibitin/TMBIM6 signaling axis.2.4.2. Upregulated lncRNAs in Diabetic Nephropathy
LncRNA NR_038323 was overexpressed in high-glucose-induced HK-2 cells, which alleviated HG-induced renal fibrosis by targeting miR-324-3p [69][72]. It was suggested that miR-324-3p can mediate the high-glucose-induced upregulation of fibronectin, collagen I and collagen IV by targeting dual-specificity protein phosphatase-1 (DUSP1). Thus, lncRNA NR_038323 attenuated renal fibrosis by modulating the levels of fibronectin, collagen I and collagen IV via the miR-324-3p/DUSP1 axis. The study further verified these molecular changes in the human kidney samples of patients with diabetic nephropathy.2.4.3. Downregulated miRNAs in Diabetic Nephropathy
In a study [70][73] including 31 diabetic patients (18 with no diabetic complications and 13 with diabetic nephropathy), miR-31 was observed to be significantly downregulated in patients with diabetic nephropathy as compared to patients with no diabetic complications. The presence of diabetic nephropathy involved increased leukocyte adhesion and rolling flux and a lower rolling velocity. Leukocyte rolling velocity was positively associated with miR-31 levels, whereas leukocyte adhesion, as well as TNFα, ICAM-1 and IL-6 levels, were negatively associated with miR-31.2.4.4. Downregulated lncRNAs in Diabetic Nephropathy
Yang et al. [71][74] reported the downregulation of long intergenic noncoding RNA for kinase activation (LINK-A) from the renal biopsies of patients with diabetic nephropathy. lncRNA LINK-A was found to be correlated with hypoxia-inducible factor 1α (HIF1α). The activation of HIF1α has been demonstrated to improve diabetic nephropathy [72][75]. Thus, HIF1α signaling activated by lncRNA LINK-A may improve the treatment of diabetic nephropathy.2.5. Dysregulated ncRNAs in Diabetic Neuropathy
2.5.1. Upregulated miRNAs in Diabetic Neuropathy
Li et al. [73][76] investigated the dysregulation of miR-199a-3p and reported an overexpression of miR-199a-3p in the serum samples of patients with diabetic neuropathy. It was further noted that upregulated miR-199a-3p caused the inhibition of serine protease inhibitor (SerpinE2). miR-199a-3p induces diabetes neuropathy by promoting coagulation by targeting SerpinE2, which is known to prevent cartilage catabolism.2.5.2. Upregulated lncRNAs in Diabetic Neuropathy
LncRNA MALAT1 was significantly upregulated in the peripheral-blood mononuclear cells of patients with diabetic neuropathy [74][77]. Further, a significant positive association between MALAT1 and C-X-C motif chemokine receptor 4 (CXCR4) was observed. It was earlier reported that CXCR4 chemokine receptor signaling mediates pain in diabetic neuropathy [75][78]. Therefore, the study suggests a possible involvement of the MALAT1/CXCR4 axis in the pathogenesis of diabetic neuropathy.2.5.3. Downregulated miRNAs in Diabetic Neuropathy
MiR-146a was reported [76][79] to be downregulated in the PBMCs of T2D patients with diabetic neuropathy. A negative correlation was observed between miR-146a and TNF-α and IL-6 levels. The downregulation of miR-146a was associated with diabetic neuropathy via activation of the NF-κB gene and an increase in the expression of TNF-α and IL-6.2.6. Dysregulated ncRNAs in Gestational Diabetes
2.6.1. Upregulated miRNAs in Gestational Diabetes
Stirm et al. [77][80] studied the microRNA expression profiles of maternal and fetal WBCs from 30 women with gestational diabetes. It was observed that miR-340 was upregulated and PAIP1, a miR-340 target gene, was downregulated in women with gestational diabetes at the protein and mRNA levels. These results provide evidence for the miRNA-dependent programming of maternal WBCs in gestational diabetes.2.6.2. Upregulated lncRNAs in Gestational Diabetes
Zhang et al. [78][81] studied the expression level of lncRNA MALAT1 in placental tissues from 78 gestational diabetes patients and 30 normal pregnant women. It was reported that lncRNA MALAT1 was upregulated in gestational diabetes patients. Further, they investigated the role of lncRNA in gestational diabetes using the placental trophoblastic-derived cell line HTR8, which was cultured in a high-glucose environment. It was observed that lncRNA MALAT1 downregulation in HTR8 cells in high-glucose conditions inhibited the cell proliferation, migration and invasion potency of HTR8. It was also reported that the downregulation of lncRNA MALAT1 led to the suppression of inflammatory factors and led to inhibition of the TGF/NF-κB pathway, suggesting that lncRNA MALAT1 affects the biological behavior of HTR8 through regulation of the TGF/NF-κB pathway.2.6.3. Downregulated miRNAs in Gestational Diabetes
Sun et al. [79][82] studied the expression of miR-29b in placental tissues from 204 gestational diabetes patients and reported that miR-29b was downregulated in these patients. It was also observed that the upregulation of miR-29b led to inhibition of the cell proliferation, viability, migration and invasion potency of trophoblastt cells. It was also reported that miR-29b overexpression led to the downregulation of HIF3A, which is the functional target of miR-29b. MiR-29b suppressed the expression of HIF3A by binding to its 3′ UTR region. Thus, miR-29b downregulation may be related to gestational diabetes development by increasing the expression of HIF3A.2.6.4. Downregulated lncRNAs in Gestational Diabetes
A microarray analysis [80][83] of lncRNA expression in exosomes found in the umbilical cord blood of 23 patients with gestational diabetes was conducted wherein several lncRNAs, including ENST00000596839.1, lnc-EIF4ENIF1-1:1, lnc-TBC1D30-4:1 and lnc-ZNF800-1:1, were downregulated. miR-362-5p was reported to be a target of lnc-ZNF800-1:1. However, the functional relevance of this regulation is yet to be elucidated.2.7. Network Architecture of Dysregulated ncRNAs in Diabetes
Investigation of the network topology of dysregulated ncRNAs in diabetes is imperative for biomarker discovery. In particular, the delineation of major target hubs based on the degree of the nodes, the directionality of the network (if known) and the presence of network motifs, including feed-forward loops, bifan motifs, etc., can shed tremendous light on novel biomarkers that can be exploited for theranostic and/or preventative intervention in diabetes. ResearchWers classify dysregulated ncRNA biological networks in diabetes as follows:- (a)
-
Upregulated human microRNAs: Upregulated human microRNAs implicated in diabetes are summarized in Table 1. miRNA–miRNA and miRNA–target networks of upregulated human miRNAs in diabetes were constructed using an in silico method, as shown in Figure 1A and 1B, respectively.
- (b)
-
Downregulated human microRNAs: Downregulated human microRNAs implicated in diabetes are summarized in Table 2. miRNA–miRNA and miRNA–target networks of downregulated human miRNAs in diabetes were constructed using an in silico method, as shown in Figure 2A and 2B, respectively.
- (c)
-
Upregulated human lncRNAs: Upregulated human lncRNAs implicated in diabetes are summarized in Table 3. lncRNA–lncRNA and lncRNA–target networks of upregulated human lncRNAs in diabetes were constructed using an in silico method, as shown in Figure 3A and 3B, respectively.
- (d)
-
Downregulated human lncRNAs: Downregulated human lncRNAs implicated in diabetes are summarized in Table 4. lncRNA–lncRNA and lncRNA–target networks of downregulated human lncRNAs in diabetes were constructed using an in silico method, as shown in Figure 4A and 4B, respectively.Table 1. Upregulated human microRNAs in diabetes.
Sr. No. miRNA Biological Matrix (Cell Line/Patient) Targets References 1 hsa-miR-29a Serum samples of 18 subjects with newly diagnosed with T2D. - [42] [45] - [ 49 ] [52] 2 hsa-miR-34a Plasma samples of prediabetic subjects ( n = 12), and T2D ( n = 31) and T1D patients ( n = 16). - [43] [46] 2 let-7b Whole peripheral blood from 40 T2D patients IGF2BP2 [50] [53] 3 hsa-miR-1 Serum samples of 78 males with uncomplicated T2D - [ 3 45 ] hsa-miR-320a [48] 4 hsa-miR-148b-3p Plasma samples of 33 T1D mellitus patients TP53, PTPN1, FADD, IRS2, CXCL8, IL8, PIK3R1, MAPK8/JNK, AKT3, IKBKB/IKKB [30] [33] 5 HIF3A [ 79 ] [ 82 ] 

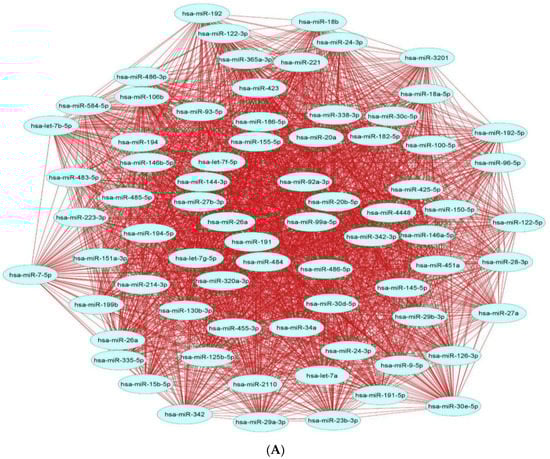
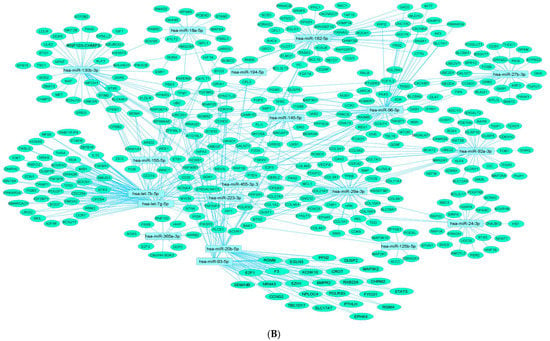 Figure 2. Downregulated human microRNA networks in diabetes: (A) Human microRNA–microRNA network: Human miRNA–miRNA interaction network with 74 nodes and 2701 edges. The networks were constructed using Cytoscape 3.9.1 [81][84]. (B) Human microRNA–gene target network: Architecture of networks of downregulated miRNAs implicated in diabetes in humans showing interaction network of functionally enriched miRNAs with their targets, with 417 nodes and 583 edges. The networks were constructed using Cytoscape 3.9.1 [81][84]. Using Mienturnet [82][85], the miRNA–target interactions were identified by TargetScan [83][86] and the functionally enriched miRNAs were generated using the KEGG database [84][87].Table 3. Upregulated human lncRNAs in diabetes.
Sr. No. lncRNA Biological Matrix
(Cell Line/Patient)Targets References 1 lncRNA-p3134 Whole-blood samples of 30 T2D patients TNS1, ASZ1, DIAPH1, IFNA14, ZNF436, MTMR3, CDK1, PPARD, TCF7, HUWE1, CCND2 [47] [50] 2 ANRIL Peripheral-blood mononuclear cells (PBMCs) from 32 patients with T2D - [48] [51] Plasma samples of 48 diabetes patients without diabetic retinopathy and 62 diabetes patients with diabetic retinopathy 3 FOXM1, YWHAZ, GTPBP2, YOD1, YWHAE, TSC1, CPD, PBX3, MAPK8IP3, GXYLT1, ARPP19, SYNGR2, CDK6, IGF2BP3, PTRN, KITLG ENST00000550337 [ 61] [64] hsa-miR-1275 4 hsa-miR-214-3p Whole-blood samples from 40 T2D patients MAP2K5, CDK6, RASA1, MAPK14, FLOT1, MPL, IL13, ACVR1B, TGFB1, NOS3, PTPRF, ATF4, TRIB3, FGFR3 4 [ 51 ] [54] GAS5 5 hsa-miR-27b-3p 6 hsa-miR-103a-3p 7 hsa-miR-200a-3p 6 8 hsa-miR-342 miR-23b-3p 7 miR-24-3p 8 5 miR-29b-3p 9 miR-451a 10 let-7f-5p HOTAIR 6 lincRNA-p21 7 PLUTO 8 HOTAIR Serum samples of 30 diabetic patients, 30 with non-proliferative diabetic retinopathy (NPDR) and 20 with retinopathy (PDR) - [56] [59] 9 hsa-miR-148a-3p 9 MALAT1 10 hsa-miR-21-5p 11 10 lncRNA-MIAT Plasma samples of 52 patients with NPDR and ARPE-19 cells TGFβ1 [59] [62] 11 hsa-miR-210-3p miR-34a Serum samples of 18 subjects newly diagnosed with T2D and 19 pre-diabetic individuals - [ 42] [45] 12 hsa-miR-338-3p 11 KCNQ1OT1 Serum samples of 20 patients with proliferative diabetic retinopathy and 20 with non-proliferative diabetic retinopathy, human retinal endothelial cells (hRECs) miR-1470, EGFR [60] [63] 12 miR-4448 Serum samples of 21 T2D patients - [53] [56] 12 BANCR Plasma samples of 64 patients with diabetic retinopathy, human retinal pigment epithelial cell line ARPE-19 13 miR-9-5p - [ 85 ] [8813 hsa-miR-200c-3p ] 13 HEIH Serum samples of 36 patients with diabetic retinopathy, human adult retinal pigment epithelial cells (ARPE-19) miR-939 [86] [89 14 hsa-miR-155-5p 14 miR-338-3p ] 14 CASC15 Plasma samples of 50 diabetic patients with chronic renal failure miR-34c [87] [90] 15 15hsa-miR-320 15 hsa-miR-485-5p lnc-COX17-2:3 Differentially expressed lncRNAs in umbilical cord-blood exosomes of 23 gestational diabetes patients - [ 80] [83] 16 hsa-miR-21-3p 16 miR-423 16 Serum samples of 10 T2D patients without retinopathy, 22 with non-proliferative diabetic retinopathy and 15 with proliferative diabetic retinopathy - [ 66] lnc-ZBTB46-3:6[69] 17 17hsa-miR-340-5p hsa-miR-155 Serum samples of 455 type 1 diabetic patients 17 - lnc-RXYLT13:2 [ 32] [35] 18 hsa-miR-133a-5p 18 hsa-miR-92a 18 lnc-TFDP2-7:2 19 hsa-miR-2116-5p Serum samples of 45 patients with diabetic retinopathy NOTCH2 [54] [57] 19 hsa-miR-483-5p 19 AK023948 Plasma samples from 25 patients with T1D - [38 20 hsa-miR-142-3p Isolated human CD4+ T cells from serum samples of children with and without islet autoimmunity TET2 [37] [40] ] 21 hsa-miR-23a Serum samples of 22 children at onset of T1D - [35] [38] [ 41 ] 22 hsa-miR-98 23 hsa-miR-197-3p Plasma samples of 40 children diagnosed with new-onset T1D TUSC2, NSUN5, CD82, BMF, PMAIP1, MTHFD1 [36] [39] 24 hsa-miR-199a-3p Plasma samples of 60 patients with T2D; lower limb skin samples from 30 patients with diabetic neuropathy SERPINE2 [73] [76] 25 hsa-miR-20a-5p Serum samples of T2D patients with diabetic retinopathy - [55] [58] 26 hsa-miR-223-3p 27 hsa-let-7a-5p 20 hsa-miR-29a BC043430 21 hsa-miR-320 21 DGCR5 22 22 hsa-miR-145 MEG3 23 hsa-miR-146a 23 PCAT-32 24 hsa-miR-191 24 SRA 25 hsa-miR-342 25 ST7OT3 26 hsa-miR-223 26 TU0017629 27 hsa-miR-24 27 28 hsa-miR-885-5p Serum samples of 455 type 1 diabetic patients - [32] 28 [35] hsa-miR-150 LincRNA-VLDLR 28 H19 Plasma samples obtained from 30 patients with diabetes mellitus, human umbilical vein endothelial cells (HUVECs) miR-29b [88] [91 29 29 miR-484 ] hsa-miR-486-3p 29 DNM3OS CD14+ monocytes obtained from T2D patients ILF-2 [89] [92] 30 hsa-miR-574-3p 30 miR-486-5p 31 hsa-miR-140-3p 30 SRA Plasma samples of 25 patients with T1D miR-146b [38] [41] 31 hsa-miR-126 Plasma samples of 54 T2D patients without coronary artery disease and 46 type 2 diabetic patients with coronary artery disease - [46 31 NR_038323 Human HK-2 cells 32 hsa-miR-17 miR-324-3p ] 33 hsa-miR-222 34 hsa-miR-16 35 hsa-miR-106a 36 hsa-miR-139-5p [ 49 ] [ 69 ] [ 72] 32 miR-31 Serum samples of 31 diabetic patients (18 with no diabetic complications and 13 with diabetic nephropathy) 37 hsa-miR-210 Plasma samples of 54 type 2 diabetic patients without coronary artery disease and 46 type 2 diabetic patients with coronary artery disease - [46] [49] 38 hsa-miR-190a-5p Serum samples of 21 T2D patients - [53] [56] 39 miR-27a-3p Human HK-2 cells Prohibitin, TMBIM6 [68] [71] 40 miR-340 Maternal and fetal WBCs from 30 women with gestational diabetes PAIP1 [77] [80] 

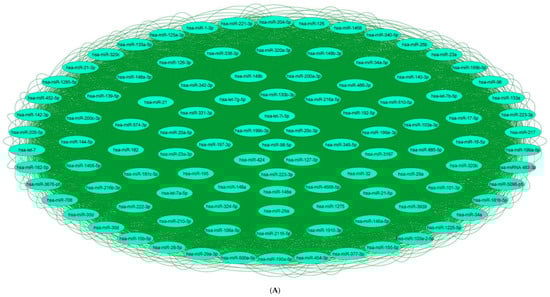
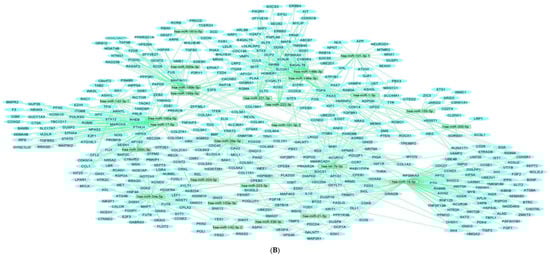 Figure 1. Upregulated human microRNA networks in diabetes: (A) Human microRNA–microRNA network: Human miRNA–miRNA interaction network with 106 nodes and 11,130 edges. The networks were constructed using Cytoscape 3.9.1 [81][84]. (B) Human microRNA–gene target network: Architecture of networks of upregulated miRNAs implicated in diabetes in humans showing interaction network of functionally enriched miRNAs with their targets, with 484 nodes and 691 edges. The networks were constructed using Cytoscape 3.9.1 [81][84]. Using Mienturnet [82][85], the miRNA–target interactions were identified by TargetScan [83][86], and the functionally enriched miRNAs were generated using the KEGG database [84][87].Table 2. Downregulated human microRNAs in diabetes.
Sr. No. miRNA Biological Matrix
(Cell Line/Patient)Targets References 1 hsa-miR-130b Serum samples obtained from 327 T2D patients 20 TNFα, ICAM-1, IL-6 [ 70 ] [ 73 ] 32 MALAT1 PBMCs of patients with diabetic neuropathy CXCR4 [ 74 ] [ 77 ] 33 33 miR-146 MALAT1 Placental tissues from 78 gestational diabetes patients and 30 normal pregnant women TGF, NF-κB [78] [81] 

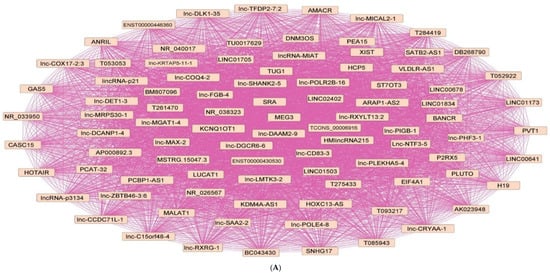
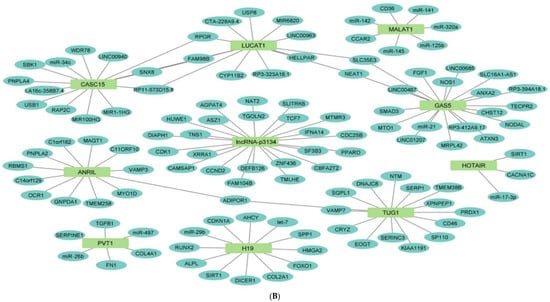 Figure 3. Upregulated human lncRNA networks in diabetes: (A) Human lncRNA–lncRNA network: Human lncRNA–lncRNA interaction network with 92 nodes and 4186 edges. The networks were constructed using Cytoscape 3.9.1 [81][84]. (B) Human lncRNA–gene target network: Architecture of networks of upregulated lncRNAs implicated in diabetes in humans showing interaction network of lncRNAs with their targets, with 127 nodes and 124 edges. The networks were constructed using Cytoscape 3.9.1 [81][84]. The lncRNA–target interactions were identified by lncRNA2target v3.0 [90][93] and LncRRIsearch [91][94].Table 4. Downregulated human lncRNAs in diabetes.
Sr. No. lncRNA Biological Matrix (Cell Line/Patient) Targets References 1 CTBP1-AS2 Peripheral-blood mononuclear cell (PBMC) of 100 type 2 diabetic patients TGF-β [52] [55] 2 AK077216 Plasma samples from 60 diabetic retinopathy patients; human adult retinal pigment epithelial cells (ARPE-19) miR-383 [67] [70] 3 ENST00000596839.1 Differentially expressed lncRNAs in umbilical cord-blood exosomes of 23 gestational diabetes patients miR-362-5p [80] [83] 4 lnc-EIF4ENIF1-1:1 5 lnc-TBC1D30-4:1 PBMCs of T2D patients with diabetic neuropathy 6 lnc-ZNF800-1:1 7 LINK-A Renal biopsies of patients with diabetic nephropathy HIF1α [71] [74] TNF-α, IL-6, NF-κB [ 76 ] [ 79 ] 34 miR-29b Placental tissues from 204 gestational diabetes patients 

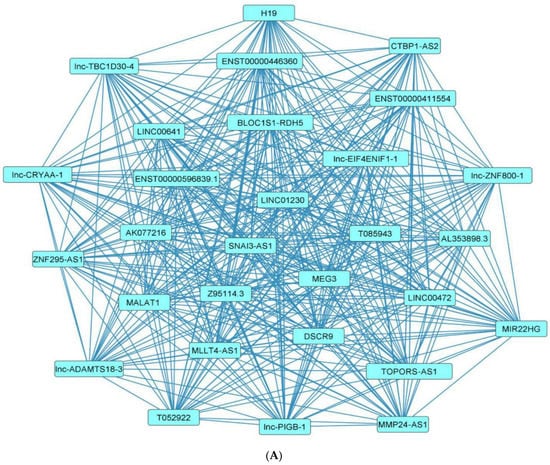
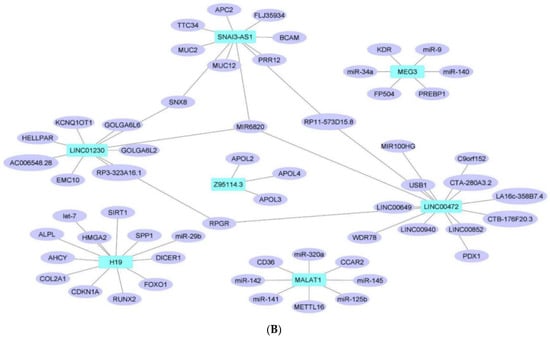 Figure 4. Downregulated human lncRNA networks in diabetes: (A) Human lncRNA–lncRNA network: Human lncRNA–lncRNA interaction network with 29 nodes and 406 edges. The networks were constructed using Cytoscape 3.9.1 [81][84]. (B) Human lncRNA–gene target network: Architecture of networks of downregulated lncRNAs implicated in diabetes in humans showing interaction network of lncRNAs with their targets with 65 nodes and 63 edges. The networks were constructed using Cytoscape 3.9.1 [81][84]. The lncRNA–target interactions were identified by lncRNA2target v3.0 [90][93] and LncRRIsearch [91][94].