The paperntry analyzes suspended particles number concentrations of 61 size fractions (184 nm to 17,165 nm) in the air at a traffic location. The average course of the individual fractions was analyzed at various intervals – daily, weekly, monthly and annually, in the period between 2017 and 2019. The data was then used to calculate the arithmetic mean for all the fractions (MS Excel, R) and then using a proprietary web application, heatmaps were constructed. The obtained results showed significant differences in both the annual and daily variation of number concentrations between the individual fractions differing in particle size. In the case of the annual variation, one can see a greater variability of smaller particles, which is most likely due to the source of the actual suspended particles. Meteorological and dispersion conditions are found as important factors for suspended particle concentrations. These can lead to significant differences from year to year. However, a comparison between 2018 and 2019 showed that even though the average absolute number concentrations can differ between years, the actual relative number concentrations, i.e. the ratios between the individual fractions remain very similar. In conclusion it can be said that the difference between the number concentration variation of the size fractions depends on both the actual pollution sources (especially in the long-term, i.e. the annual variation) and the actual size of the particles, which plays a role especially in the short-term (daily, weekly variation).
- nanoparticles
- air quality
- suspended particles
- air pollution
1. Results
The period of analysis represented the period from 15 June 2017 to 31 December 2019. Particle number concentrations per cm3 were monitored in 61 fractions (from 184 nm up to larger than 17,165 µm, see Table 1) in 10-min intervals. The analysis was focused on the average course of the individual fractions for various time intervals – daily, weekly, and annual variations.
Table 1. Monitored size fractions.
| Fraction (nm) | Fraction (nm) | Fraction (nm) | Fraction (nm) |
|---|---|---|---|
| 184–198 | 583–627 | 2130–2289 | 7239–7779 |
| 198–213 | 627–674 | 2289–2460 | 7779–8359 |
| 213–229 | 674–724 | 2460–2643 | 8359–8983 |
| 229–246 | 724–778 | 2643–2841 | 8983–9653 |
| 246–264 | 778–836 | 2841–3053 | 9653–10,373 |
| 164–284 | 836–898 | 3053–3280 | 10,373–11,147 |
| 284–305 | 898–965 | 3280–3525 | 11,147–11,979 |
| 305–328 | 965–1037 | 3525–3788 | 11,979–12,872 |
| 328–352 | 1037–1198 | 3788–4071 | 12,872–13,833 |
| 352–379 | 1198–1383 | 4071–4374 | 13,833–14,865 |
| 379–407 | 1383–1486 | 4374–4701 | 14,865–15,974 |
| 407–437 | 1486–1597 | 4701–5051 | 15,974–17,165 |
| 437–470 | 1597–1717 | 5051–5833 | >17,165 |
| 470–505 | 1717–1845 | 5833–6268 | |
| 505–543 | 1845–1982 | 6268–6736 | |
| 543–583 | 1982–2130 | 6736–7239 |
To compare the differences between the individual fractions, the absolute number concentrations of the individual fractions have been converted to relative values, where the overall arithmetic mean for each fraction has been calculated and the value from each interval (hour, day of the week, month) has been related to this mean value.
The following heatmap (Figure 1) shows the differences in variation of the individual fractions. The X-axis represents the individual size fractions, the Y-axis represents the hours of the day. Data are shown as a relative value of each hour to the overall arithmetic mean of that particular size fraction. The visualization clearly show that fractions of smaller particles have two obvious peaks correlating with traffic peaks in the morning and in the afternoon. However, larger particles (approximately >1.5 µm) show an increase during the day, where the number concentration increases during the morning peak hours and do not go down significantly until the end of the afternoon peak hour. One can also see that the number concentration drops much more significantly during the night in the case of the larger particles. One can, therefore, say that the variability is greater in case of the larger particles. While the 213–229 nm fraction only has a difference between the minimum and the maximum ratio of the individual hours of 0.17, the larger fractions have a difference of even more than 1 (9653–10,373 nm – 1.06; 15,976–17,165 nm – 1.09; >17,165 nm – 1.18).
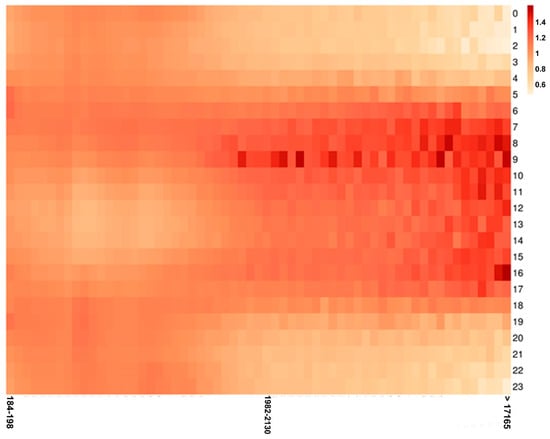
Figure 1. Heatmap showing daily variation (hourly average, Y-axis) of all the size fractions (X-axis, in nm) analyzed.
Similarly to the hourly averages, ratios between average number concentrations for weekdays (Monday-Friday) and weekends (Saturday-Sunday) have been calculated for the individual fractions (Figure 2), where the ratio corresponds to the average number concentration of that fraction on the weekend (Saturday-Sunday) divided by the average number concentration of that fraction on weekday (Monday-Friday). The graph clearly shows that the difference between weekdays and weekends is least profound in the case of the smaller fractions around 300 nm, where the ratio between average of weekday and weekend number concentration is close to 1, i.e., same values. In contrast, most significant differences were observed in case of the larger fractions, where the ratio was approximately 0.65 (smallest for 14,865–15,974 nm fraction, 0.642), i.e., the number concentration during the weekend was approximately 65% of those observed during weekdays.
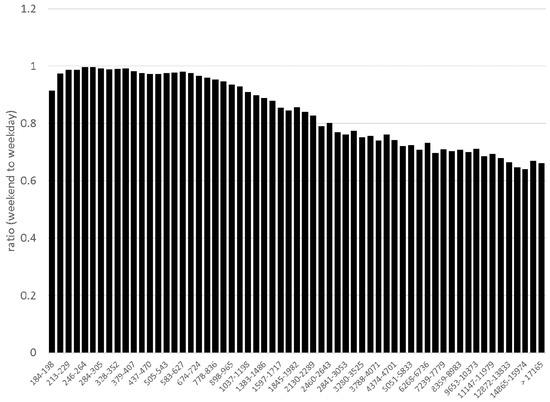
Figure 2. Ratio between average number concentration on the weekdays (Monday-Friday) and the weekends (Saturday-Sunday) weekend/weekday.
Analysis of annual variability was also summarized in a heatmap (Figure 3), where the Y-axis represents the individual months and X-axis the various size fractions. The actual value represents the ratio of the particular monthly mean in relation to the overall mean value of that fraction.
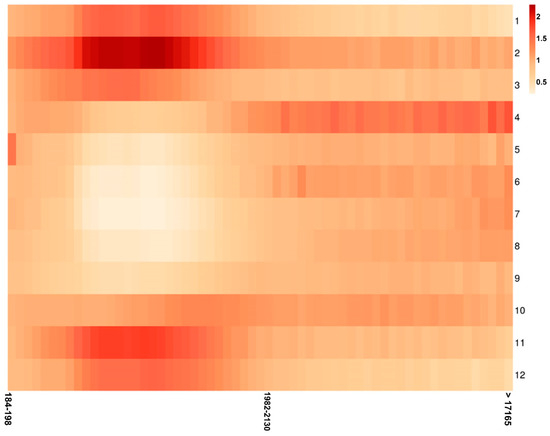
Figure 3. Heatmap showing annual variation (monthly average, Y-axis) of all the size fractions (X-axis, in nm) analyzed.
It can be clearly seen that the number concentrations in the case of the smaller particles were high especially in the winter months. In particular, in the case of particles in the range from 320 to 800 nm. In contrast, larger particles had the average number concentrations distributed throughout the year much more evenly.
If we divide the year into two half-years – cold (October–March) and warm (April–September), we can compare the ratio between the average number concentrations for both these half-years (Figure 4), where the ratio corresponds to the average number concentration of a particular fraction during the cold half-year divided by the average number concentration of a particular fraction during the warm half-year. The graph shows the individual size fractions (X-axis) and the ratio between the cold and warm half-years (Y-axis).
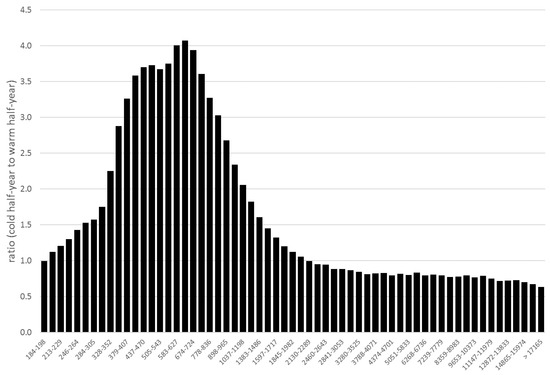
Figure 4. Ratio (Y-axis) between average number concentration of all the size fractions (X-axis) between the cold half-year (October–March) and warm half-year (April–September) (cold half-year/warm half-year).
The trends in the ratio show that the fractions can be divided into three groups – the smallest particles (approximately 180–320 nm), which have similar number concentrations during both half-years, medium-sized particles (approximately 320 to 700 nm) where there is a gradual increase in the relative number concentrations in the winter period, with maximum ratio observed in case of the fraction 627–674 nm (4.07). Then as the particles get larger the ratio decreases. The last group of particles, with an aerodynamic larger than approximately 2 µm, has lower number concentrations in the cold half-year than in the warm half-year. In the case of the fraction >17,165 nm, the ratio is 0.63.
To see how the various years compare a comparison was made between the two complete years 2018 and 2019 Figure 5), in particular, the average number concentrations of the individual size fractions from the entire year were compared.
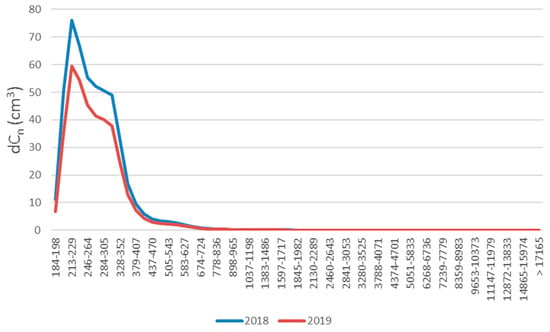
Figure 5. Comparison between average number concentration for all size fractions for 2018 and 2019.
It is obvious that the two years differ in terms of the absolute values of the average number concentrations, with higher values in 2018 (most likely due to overall better meteorological and dispersion conditions in 2019, which was a very warm year). If, however, we convert the absolute values to relative ones, i.e., calculate the relative ratios between the number concentrations of each fraction and the overall mean number concentration for each year we get the relative contribution of each fraction from the overall particle count. This comparison (Figure 6) then shows that the years 2018 and 2019 were almost identical in terms of the ratios between the average number concentrations of the individual fractions.
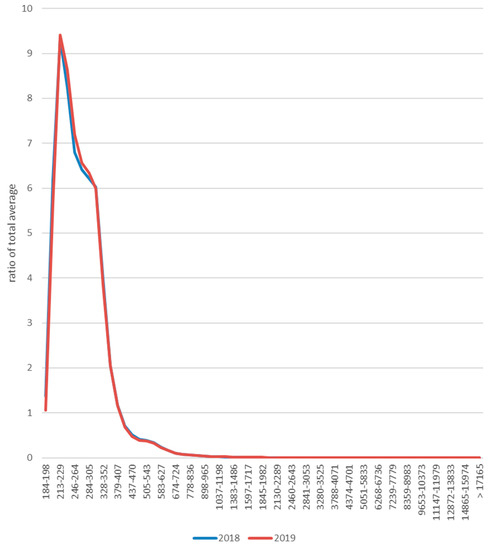
Figure 6. Comparison between the contribution of each average number concentration to the overall total for 2018 and 2019.
2. Discussion
The results of the analysis proved that the annual and daily variation in number concentrations can differ a lot in relation to the particle size. It has been shown that in the case of smaller particles in the range from approximately 200 to 800 nm, there is a significant variability throughout the year, with much higher values, particularly in the winter months. This is most likely due to the variability in particle sources during the year. In cold conditions, the intensity of heating increases significantly (being almost negligible in summer months) and local domestic heating becomes a very significant source of air pollution. Even though traffic is a very important suspended particles source at this location, it is a stable source in that it is relevant both in the summer and in the winter (although meteorological and dispersion conditions [1][2][3], which are in general worse in the winter – lower wind speed, less precipitation, temperature inversions – can lead to a higher number of particles in the air in winter months).
Higher number concentrations in the winter months compared to the warm months were observed especially in the case of the PM1 particles. Larger particles did not show such a trend. This is in accordance with other studies. For example Vecchi [4] observed an increase of PM1 in the winter period by a factor of 2.5 compared to the summer, while in the case of PM2.5 the increase was only by a factor of approximately 2. A similar conclusion was also made in a study by Triantafyllou et al. [5], which showed a more significant increase of smaller particles in the winter period.
The most significant difference between the winter and summer period has been observed for particles in the range between 300 and 800 nm. Particles of this size can be a product of heating. Zhang et al. [6] analyzed emissions from coal combustion. They concluded that while primary particles generated by coal combustion have a size of approximately 10 to 30 nm, their subsequent coagulation leads to the formation of particles approximately 500 nm large, which is in accordance with the findings of this study.
Apart from heating, low temperature also affects traffic exhaust emissions. This was proved for example by a study by Weilenmanna et al. [7], which showed that a vehicle cold start has a significant negative effect especially on the emissions of CO and HC, but to a lesser extent also suspended particles.
Larger particles show higher number concentrations in the warm period of the year. This could be due to the fact that combustion generally produces smaller particles and some sources of larger particles are significant especially in the warm part of the year. This includes for example resuspension, which is more significant in the summer than in the winter when the surface is cold and soil frozen [8]. Traffic is a significant contributor to resuspension.
When looking at the differences in daily variation of the individual fractions it is obvious that there is a much more significant difference between day and night in the case of the larger particles, which show higher number concentrations during the day. The number of larger particles increases in the morning, in correlation with the morning traffic peak. Vehicles can produce these larger particles by resuspension or abrasion of brake pads, clutch, tires, and the road surface. Number concentration falls significantly in the evening. This is most likely due to the higher mass of these particles, which are therefore more likely to deposit on the ground.
In contrast, the number concentrations of the smaller particles do not differ between day and night to such an extent as the larger particles. As Figure 1 shows, two peaks can also be seen, corresponding to the morning and afternoon traffic peak, but the average number concentration of day and night do not differ as much.
The minimum number concentration is observed around noon and early afternoon hours, not during the night. This is in accordance with other studies focusing on this topic. A study by Zhu [9] showed that even though the traffic intensity at night is 75% lower than during the day, the number of submicron particles only dropped by 20%. Explanation of this could be that the wind speed at night is lower and another possible answer is that there is a weaker atmospheric dilution at night. One other factor is air temperature. Air temperature is on average lower at night and colder ambient temperatures contribute to significantly increased nuclei mode particle formation in vehicle exhaust [10][11]. Peréz et al. [12] think that the reason for higher concentrations of smaller particles at night compared to the larger once could also be the decrease of the boundary layer height. Lower air temperature and higher air relative humidity are a favorable factor for condensation and coagulation processes between particles and precursor gases [13].
3. Conclusions
In this study, an analysis of number concentrations in 61 size fractions of suspended particles was made focusing on the difference in daily and annual variation. Data comes from ambient air quality monitoring station Ústí nad Labem-Všebořická. an urban traffic station, with data available from mid-June 2017 to the end of 2019.
The results of the study showed that there are significant differences in both the annual and daily number concentration variations depending on the particle size. In the case of the annual variation, a higher variability can be seen for the smaller particles (Figure 3). This is most likely related to the sources of these particles. The most significant source of PM2.5 particles in the Czech Republic is local domestic heating. This source, however, is almost negligible in the summer months. In contrast, in the case of the daily variation there is a higher variability of the larger particles (Figure 1). This can be explained by the fact that these larger particles deposit quicker to the ground and also by meteorological conditions as explained in the paper. Given that the most significant source of suspended particles at this station is traffic, there are obvious peaks in suspended particle concentrations correlating with morning peak hour and afternoon peak hour. In the evening and at night, there is a rapid decrease in the number of large particles in the air. Smaller particles do not deposit to such an extent so their number concentration remains higher at night. Additionally, a comparison was made between number concentrations on weekdays (Monday-Friday) and weekends (Saturday-Sunday), when the traffic intensity is much lower. The comparison showed that in this case, the variation is very similar to the daily variation in that there is a much more obvious decrease of larger particles number concentrations (Figure 2).
Meteorological and dispersion conditions have a very important effect on air quality. Their variability can cause very significant differences from year to year in terms of absolute values of number concentrations. A comparison between 2018 and 2019, however, showed that the relative ratio between the number concentrations of the various size fractions remain very similar (Figure 6).
It can be concluded that the differences in variation between the various size fractions are determined by both the actual pollution sources (especially in the long-term, i.e., annual variation) and by the actual physical properties of the particles and their behavior in the atmosphere, also determined by the meteorological and dispersion conditions.
In the future, it would be ideal to research annual and daily variation of different size fractions at more station types, i.e., not just traffic stations, but also suburban and rural background stations and also repeat the analysis when a longer time-series is available.
References
- Nicole R. Ramsey; Petra M. Klein; Berrien Moore; The impact of meteorological parameters on urban air quality. Atmospheric Environment 2014, 86, 58-67, 10.1016/j.atmosenv.2013.12.006.
- Bernard Fisher; Meteorological factors influencing the occurrence of air pollution episodes involving chimney plumes. Meteorological Applications 2002, 9, 199-210, 10.1017/s1350482702002050.
- Jamal A Radaideh; Effect of Meteorological Variables on Air Pollutants Variation in Arid Climates. Journal of Environmental & Analytical Toxicology 2017, 7, -, 10.4172/2161-0525.1000478.
- R. Vecchi; G. Marcazzan; Gianluigi Valli; M. Ceriani; C. Antoniazzi; The role of atmospheric dispersion in the seasonal variation of PM1 and PM2.5 concentration and composition in the urban area of Milan (Italy). Atmospheric Environment 2004, 38, 4437-4446, 10.1016/j.atmosenv.2004.05.029.
- E. Triantafyllou; E. Diapouli; Μ.β. Korras-Carraca; M. Manousakas; C. Psanis; A.A. Floutsi; C. Spyrou; K. Eleftheriadis; George Biskos; Contribution of locally-produced and transported air pollution to particulate matter in a small insular coastal city. Atmospheric Pollution Research 2020, 11, 667-678, 10.1016/j.apr.2019.12.015.
- Lian Zhang; Yoshihiko Ninomiya; Toru Yamashita; Formation of submicron particulate matter (PM1) during coal combustion and influence of reaction temperature. Fuel 2006, 85, 1446-1457, 10.1016/j.fuel.2006.01.009.
- Martin F. Weilenmann; Jean-Yves Favez; Robert Alvarez; Cold-start emissions of modern passenger cars at different low ambient temperatures and their evolution over vehicle legislation categories. Atmospheric Environment 2009, 43, 2419-2429, 10.1016/j.atmosenv.2009.02.005.
- Keramat, A.; Marivani, B.; Samsami, M; Climatic Change, Drought and Dust Crisis in Iran. World Academy of Science. Environ. Eng. 2011, 6, 10–13.
- Yifang Zhu; Thomas Kuhn; Paul Mayo; William C. Hinds; Comparison of Daytime and Nighttime Concentration Profiles and Size Distributions of Ultrafine Particles near a Major Highway. Environmental Science & Technology 2006, 40, 2531-2536, 10.1021/es0516514.
- Wei, Q.; Kittelson, D.B.; Watts, W.F. Single-Stage Dilution Tunnel Performance. SAE Transaction: Warrendale, PA, USA, 2001.
- Kittelson, D.; Johnson, J.; Watts, W.; Wei, Q.; Drayton, M.; Paulsen, D.; Bukowiecki, N. Diesel Aerosol Sampling in the Atmosphere. In SAE Transactions Journal of Fuels and Lub ricants; SAE Paper No. 2000-01-2212; SAE: Warrendale, PA, USA, 2000.
- Noemí Pérez; Jorge Pey; Michael Cusack; Cristina Reche; Xavier Querol; Andrés Alastuey; Mar Viana; Variability of Particle Number, Black Carbon, and PM10, PM2.5, and PM1Levels and Speciation: Influence of Road Traffic Emissions on Urban Air Quality. Aerosol Science and Technology 2010, 44, 487-499, 10.1080/02786821003758286.
- Milan Jamriska; Lidia Morawska; Kerrie Mengersen; The effect of temperature and humidity on size segregated traffic exhaust particle emissions. Atmospheric Environment 2008, 42, 2369-2382, 10.1016/j.atmosenv.2007.12.038.