Your browser does not fully support modern features. Please upgrade for a smoother experience.
Please note this is a comparison between Version 1 by Yunjia Zhang and Version 2 by Dean Liu.
Several processes involved in cancer development, such as cell growth, migration, and angiogenesis, are regulated by the arachidonic acid derivative thromboxane A2 (TXA2). Higher levels of circulating TXA2 are observed in patients with multiple cancers, and this is accompanied by overexpression of TXA2 synthase (TBXAS1, TXA2S) and/or TXA2 receptors (TBXA2R, TP). Overexpression of TXA2S or TP in tumor cells is generally associated with poor prognosis, reduced survival, and metastatic disease. However, the role of TXA2 signaling in the stroma during oncogenesis has been underappreciated. TXA2 signaling regulates the tumor microenvironment by modulating angiogenic potential, tumor ECM stiffness, and host immune response.
- thromboxane A2 synthase
- thromboxane A2 receptor
- isoforms
1. Thromboxane A2 Receptor Isoforms and Signaling
The activation of cells by TXA2 is mediated by T-prostanoid receptors (TP; Figure 1(7)), which are G-protein coupled receptors on the cytoplasmic membranes of all responsive cells. In humans there are two TP isoforms, TPα [1][22] and TPβ [2][3][23,24], coded by alternative splicing of a single gene on chromosome 19.13.3 [4][25] (Figure 1(6)), Table 1). The two isoforms are identical in their N-terminal 328 amino acids. At this point, the two isoforms diverge to produce proteins with cytoplasmic tails of 15 and 79 amino acids for TPα and TPβ, respectively [2][3][23,24] (Figure 1(7)). The TP gene (TBXA2R) contains 4 exons and 3 introns with alternative splicing in exon 3 producing TPα and TPβ [5][6][26,27] (Figure 1(6)). A significant determinant of splicing is the promoter region used to generate the mRNA transcript. Three promoters regulate TP gene transcription, with transcripts derived from promoter 1 and 2 remaining unspliced to produce TPα [5][6][26,27]. Conversely, promoter 3 derived transcripts are spliced to produce TPβ [5][6][26,27]. The transcripts are otherwise identical suggesting that the 5’untranslated region from promoter 3 may contain nucleolar targeting sequences or sequences that attract components of the splicosome apparatus that remove the retained intron and promote TPβ expression (Figure 1(6)). TP in most reported species thus far is an orthologue of TPα. While TP expression has been identified in a wide range of cell types and organs, the distribution of the two TP isoforms has not been as well documented, most likely due to complacency over the similar function of the two receptor isoforms.
TPα is the dominant TP isoform [7][16] in all tissues examined thus far, including vascular and uterine smooth muscle, endothelial cells, trophoblasts, platelets, brain, thymus, intestine and liver [7][16] and cancer cells from many organs (see below). Conversely, TPβ expression is documented in a few of these tissues to a significant degree. The Our studies have shown robust TPβ expression in endothelial cells, which profoundly affects angiogenic potential (see below). Variations in TPβ expression between fetal and adult tissues may exist with TPβ expression lost after birth [7][16]. In addition, the reported expression of TPβ in platelets by mRNA was not replicated with IHC/immunoblotting [8][28], suggesting that low levels of mRNA transcripts may not be adequate for robust protein expression in all tissues.
The divergent cytoplasmic tails of the TP isoforms are not significant discriminators of ligand binding, as TXA2 has similar affinity for both isoforms. However, maximal biological activity of F2-series isoprostanes requires TPβ expression, suggesting some selectivity [9][21] (Figure 1(7)). The relative ligand preference of TP is not determined; however, TP can be re-challenged by U46619 after isoprostane stimulation, but the reverse is not true. [10][29] In addition, TPα (PTB3 [11][30],16f [12][31]) and TPβ (BM573 [10][29], 9h, 9af, and 9ag [12][13][31,32])-specific antagonists have been rationally designed, indicating that the intramolecular interactions of the TPβ cytoplasmic tail produce structural rearrangements of the ligand binding site that allow for ligand discrimination. The C-terminal cytoplasmic domains also do little to discriminate G-protein coupling of the two isoforms (Figure 1(7)), with both isoforms coupled to Gαq, Gα11, Gα12, Gα13, Gα15, and Gα16 [14][15][15,33]. Vezza and colleagues [16][34] found that only TPα signals through Gαh, which is associated with cellular survival mechanisms and the activation of phospholipase C (PLC)-dependent inositol phosphate (IP) formation. Similarly, TPα activates adenylate cyclase to synthesize cyclic adenosine monophosphate (cAMP), while TPβ inhibits adenylate cyclase activity [17][35]. This suggests that TPα couples with Gαs and TPβ with Gαi [3][17][24,35]. Both isoforms depend on Src-kinase to phosphorylate ERK, while the transactivation of EGFR through TP activates the PI3K-Akt phospholipase Cγ1 (PLC-γ1) pathways, which increase survival and migratory potential, respectively [18][36].
Conversely, the divergent residues of the two TP isoforms produce very different post-translational modifications, protein binding and inactivation mechanisms after ligand binding. TPβ, but not TPα, undergoes agonist- and tonic-induced cellular internalization that recycles the receptor to the cell surface and re-sensitizes the response to the ligand [19][20][39,47]. Agonist-induced desensitization of TPα is achieved through phosphorylation of residues Ser329 [21][22][23][40,41,45] and Ser331 [24][25][42,43] whilst re-sensitization involves de-phosphorylation of these same residues by PP2A [26][46]. Conversely, agonist-induced desensitization of TPβ involves phosphorylation by GRK 2, 5 and 6 and subsequent internalization through interaction with dynamin and arrestin [19][39], Rab11 [27][48] and Nm23-H2 [28][49]. In addition, palmitoylation of TPβ at Cys347 is required for Gq coupling and activation of PLCβ whilst palmitoylation of TPβ at Cys373/Cys377 is needed for TPβ internalisation [20][47]
2. TXA2 Signaling in Cancer
The prominence of TXA2 signaling in processes such as atherosclerosis, infarction, hypertension, stroke and renal dysfunction has resulted in effective antagonists central to the therapy of these diseases. Recently, multiple studies have indicated functional roles for both TBXAS1 and TP in the essential processes of neoplastic transformation including enhanced tumor cell motility and invasion, proliferation, and therapeutic resistance that are critical steps in cancer progression [29][50]. These effects are observed in multiple cancers indicating the profound effects on tumorigenesis and the widespread clinical applicability of targeting TXA2 signaling as adjunct therapy for cancer.
2.1. TP Isoforms in Cancer
Thromboxane receptors are upregulated in multiple tumors, including multiple myeloma, skin, prostate, breast, lung, colon, bladder, and brain cancer [29][50]. Consistent with this, The Cancer Cell Line Encyclopedia shows significant upregulation in these cancers (Figure 12A). Moreover, the data suggest TBXA2R expression is elevated to a greater extent in some cancers (such as CML, meningioma, AML, mesothelioma and renal cancer) where the significance is yet to be determined. Transcription control is the primary mechanism of regulation over TBXA2R expression in most cancers. Sp1 activates the transcription of TPα at promoter 1, whilst Egr1 impedes its transcription by competing with Sp1 at overlapping Sp1/Egr1 sites in HEL cells [30][51]. NF-E2, GATA-1 and Ets-1 were also implicated in the transcriptional regulation of TPα in megakaryocyte differentiation and human platelets [30][51]. A recent study found that a BRCA1-c-Myc complex transcriptionally represses TP gene expression and that a BRCA1 knockdown in an ER+PR+ cell line, T-47D, upregulates TBXA2R expression [31][52]. Other tumor suppressor genes, Wilms’ tumor (WT1) and hypermethylated in cancer (HIC1) also repress TPα expression by binding to promoter 1 in breast and prostate cancer cell lines [32][53] to regulate basal expression of TPα.
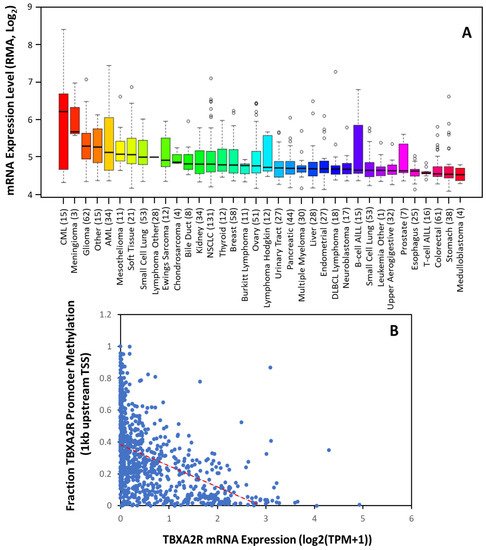
Figure 12. TBXA2R Expression is Increased in The Majority of Tumors. (A) Expression of TBXA2R mRNA in 36 different cancer cell types. Data are mean ± SD showing 95% CI. Numbers above descriptors on the X-axis denote the number of individual cell lines from which the data were derived. (B) TCGA data from 59,132 patients’ samples showing the correlation between TBXA2R mRNA expression and methylation of the promoter (within 1 kb of transcriptional start site (TSS)). Red dotted line denotes linear correlation (R2 = 0.442).
Using the non-redundant pan-cancer studies database (TCGA, 32 cancer types, 59, 132 patients), rwesearchers determined that TP mRNA expression is inversely correlated with TBXA2R promoter methylation across 23 different cancers. Unfortunately, showing decreases in a global analysis (Figure 1B) is difficult, as the ubiquitous expression of TPα results in low promoter methylation in most tissues. However, these data agree with previous findings that promoter 1 is hypomethylated in benign and precursor lesions, but undergoes increasing methylation with prostate cancer staging [33][54]. Thus, TP isoforms may be transcriptionally regulated; however, epigenetic modifications during carcinogenesis (such as promoter methylation) play an equally important role in determining expression [33][34][54,55].
The main cellular activities induced by TP over-expression to promote cancer are increased proliferation, migration, and invasion. Moreover, antagonizing TP re-sensitizes cancer cells to more conventional chemotherapy [35][56] and promotes responsiveness to drugs where resistance has developed. TPα and TPβ both activate extracellular signal regulated protein kinase (ERK) and phosphatidylinositol 3’kinase (PI3’K) signaling. TP activation in human astrocytoma [36][57], bladder [35][56] and prostate cancer [37][38][58,59] cells induces morphological change, enhanced motility, invasion and metastasis via the Gα12/RhoA pathway. TP activation induces DNA synthesis by activating ERK via Gαq/11 signaling [36][57]. In bladder and prostate cancers, TP-mediated ERK activation phosphorylates the tumor suppressor protein forkhead box O3 (FOXO3), which is deacetylated by SIRT1, resulting in Skp2-mediated degradation. The loss of FOXO3 was linked to the enhanced migration and invasion in both cancer cells [39][40][41][60,61,62]. Coupling to Gαh/15/16 is associated with cellular survival mechanisms, and activation of phospholipase C (PLC)-dependent inositol phosphate (IP) formation and PI3K activity, both of which influence tumor cell proliferation/mitogenesis [14][15]. Coupling of TPα to Gαs in 4-methylnitrosamino-1–3-pyridyl-1-butanone induced lung cancer stimulates PKA/CREB activation [42][63], resulting in expression/activation of the orphan nuclear receptor Nurr1, which stimulated proliferation of human lung cancer cells but could also be implicated in differentiation and apoptosis [42][43][63,64]. Moreover, the interaction of the receptors with non-traditional downstream regulators has significant consequences for cancer progression. The interaction of both isoforms with the protein kinase C-related kinase (PRK)-1 and PRK-2 [44][45][65,66] was essential for TP-induced prostate cancer cell migration, but also enabled TP activation to manipulate histone H3 phosphorylation at Thr11 (H3Thr11), an epigenetic marker both necessary for and previously exclusively associated with androgen-induced chromatin remodeling and transcriptional activation. The significance of TP-PRK interactions have not been described outside of prostate cancer; however, TP-PRK1/2 signaling in other cancers could explain the aggressive phenotypes associated with high TP expression [29][50].
TP expression is correlated significantly with poorer outcomes in lung [46][67], breast [47][48][68,69], bladder [35][56], colorectal [49][70] and prostate [50][71] cancers. TP expression is often higher in advanced tumor stages (such as higher Gleason score in prostate cancer) and metastatic disease and is associated with important clinical endpoints, such as reduced disease-free survival [47][48][68,69]. Using the non-redundant pan-cancer studies database, rwesearchers es established that patients with high TBXA2R expressing tumors have substantially poorer outcomes concerning progress free (29.49 vs. 58.72 months; p = 2.218 × 10⁻³) and disease free (55.04 vs. 140.90 months; p = 0.0442) survival (Figure 23B,C) but not overall survival (Figure 23A) compared to patients with low expression. Significantly, 5-year progression free survival for the TBXA2R high group was lower (38%) compared to the TBXA2R low group (49%) and total lifespan was no more than 140 months (360 months for the TBXA2R low group) (Figure 23B). Similarly, 5-year disease free survival for the TBXA2R high group was 48% (compared to 67% for the TBXA2R low group) with overall longevity reduced from 280 to 120 months (Figure 23C). Even overall survival (although not significantly different between the two groups) was reduced (420 months down to 230 months) in the TBXA2R high group (Figure 23A). These data indicates the profound impact of TP expression on cancer progression and highlights the value TP antagonists might bring to cancer therapy.
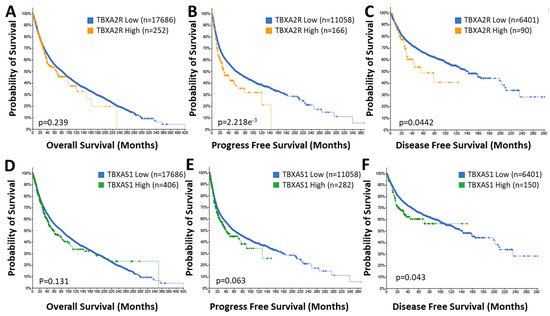
Figure 23. Elevated TBXA2R and TBXAS1 Expression Is Associated with Poor Prognosis. Data from the TCGA pan-cancer database for TBXA2R (A–C) and TBXAS1 (D–F) was correlated with overall (A,D), progression free (B,E) and disease free (C,F) survival in patient populations with low (♦) and high (♦, TBXA2R; ♦, TBXAS1) expression. n = number of patients in the cohort.
The significance of individual TP isoforms in cancer has been poorly investigated. TPα is expressed by most non-transformed epithelial cells and is almost exclusively the only TP isoform expressed in most solid tumors (including lung, NSCLC and small cell, prostate cancer) [29][50], while TPβ drives the progression of bladder cancer [35][56]. In bladder cancer, increased expression of TPβ, but not TPα, was observed in epithelial and stromal cancer tissue [35][56]. TPβ overexpression was correlated to increased proliferation and increased metastatic potential through Gα12/13 signaling and induced malignant transformation in xenografts of normal bladder epithelial cells in vivo [35][56]. Moreover, elevated TPβ expression was associated with shorter disease-free survival time in patients [35][56].
Bladder cancer is rare, as roles for both TP isoforms have been identified and provides evidence for the distinct roles for TPα and TPβ in cancer pathogenesis. TPβ is derived from the activation of promoter 3, which, unlike promoter 1, is hypermethylated in benign and precursor lesions and becomes increasingly hypomethylated with the increase in tumor grade, leading to increased TPβ expression [33][54]. TPβ expression is negatively regulated through promoter 3 by peroxisome proliferator-activated receptor (PPAR)γ activation with 15-deoxy-D12,14-prostaglandin J2 [51][52][72,73]. Furthermore, promoter 3 is activated through activator protein-1 (AP-1) and OCT-1/-2 binding elements [5][26]. In addition, oxidative stress promotes the translocation of TPβ from the endoplasmic reticulum to the Golgi complex and ultimately into the plasma membrane [53][54][74,75]. Oxidative stress induces maturation and stabilization of the TPβ protein, prolonging protein half-life. Given the elevated oxidative stress observed in some tumors [55][76], protein stabilization likely plays a role in tumors where TPβ expression is enhanced. Finally, a recent phenome-wide association study examined the association of the rs200445019 polymorphism in TBXA2R (T399A substitution in TPβ that impairs ligand induced desensitization) with phenomic outcomes [56][77]. Surprisingly theis study significantly associated The TPβ (T339A) mutation with metastatic disease at multiple tissue sites (including lymph nodes, respiratory organs, digestive systems, brain/spine) derived from various solid tumor types, including breast, colon, lung, head and neck, renal, gastric and ovarian cancers [56][77]. Based on this analysis Kaplan–Meier analysis associated high TBXA2R with poor prognosis and reductions in median disease-free survival in patients with breast, head and neck, lung, ovarian, esophageal, renal, pancreatic and gastric cancers (all of which would have been predicted by Figure 2A) [56][77]. What is exciting about these data is that the complement of TP isoforms expressed in many of these cancers have not been documented; however, based on the phenomic analysis, it is likely that TPβ expression might be upregulated in at least breast, colon, lung, head and neck, renal, gastric and ovarian cancers [56][77]. This result indicates isoform switching could be a widely used molecular event in cancer pathogenesis and may represent a key targetable pathway during tumorigenesis. The data seem to highlight that TPα and TPβ may each play a role in tumor growth/development, depending on the cell and tissue involved.
2.2. TBXAS1 in Cancer
Increased circulating TXB2 is found in the serum of patients with lung cancer and peritumoral tissue surrounding laryngeal cancers, compared to healthy mucosa. Tissue samples of non-small cell lung carcinoma had higher levels of TXB2, compared to non-cancerous tissue, which positively correlated with the disease stage (i.e., more advanced cancer samples had higher levels of TXB2). High levels of TXB2 in lung cancer tissue was associated with a high level of lipid peroxidation and Bcl-2 expression [57][78]. However, a direct link between these signaling molecules is yet to be established. Karmali et al. found high TXB2 levels associated with large tumors and lymph-node metastases in breast cancer [58][79] In addition, elevated urinary protein levels of TXB2 may prove a valuable prognostic and diagnostic tool in bladder cancer [59][80].
Overexpression of TXA2S and increased levels of TXA2 have been demonstrated in thyroid [60][81], colorectal [61][82], bladder [62][83], lung [42][46][63][63,67,84], prostate cancer [50][71], and NSCLC [64][85] and renal cancer (Figure 34A). Cells overexpressing TXA2S grow at an accelerated rate and exhibit greater resistance to apoptosis [46][64][65][66][67][68][69][67,85,86,87,88,89,90], and TXA2S was needed for the development of metastasis [70][71][72][73][91,92,93,94], suggesting that enhanced TXA2 levels due to TXA2S overexpression activate the TP-dependent pathways of carcinogenesis. High levels of TXA2S expression were reported in glioma cell lines and in biopsies from glial tumors when compared to normal brain tissue, with expression levels positively correlated to cellular migration rates [74][95]. Schauf and colleagues determined that TXA2S, activity was essential to radiation insensitivity in glioma cells, which was subsequently proven in an orthotopic glioblastoma mouse model where TXA2S antagonism with furegrelate significantly reduce tumor size, slowed tumor cell proliferation, decreasing angiogenesis and increased apoptotic cell death [75][96]. In prostate cancer, TBXAS1 expression is correlated with the severity of prostate carcinoma lesions, with advanced stages and poorly differentiated forms having the highest expression levels [50][71]. The enzyme was involved in motility, but not proliferation or survival, of prostate cancer cells [50][71]. In breast cancer, there is dissent over the correlation of TBXAS1 expression and tumor grade, with one study [47][68] suggesting loss of expression with increasing grade but the reverse has also been reported [48][69]. However, TBXAS1 polymorphisms have shown a modest association with breast cancer risk and poor outcomes [76][97].
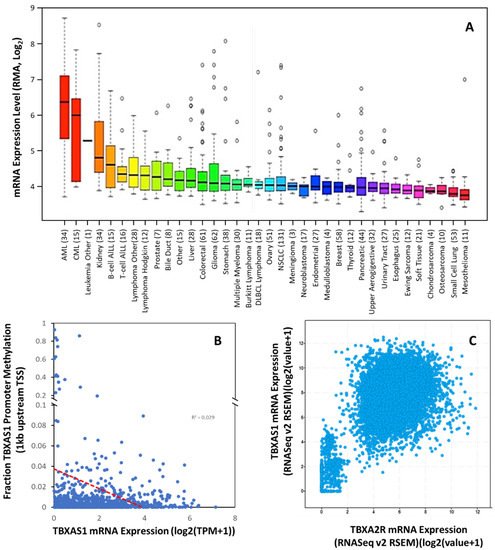
Figure 34. TBXAS1 Expression is Dysregulated in Multiple Tumors. (A) Expression of TBXAS1 mRNA in 36 different cancer cell types. Data are mean ±SD showing 95% CI. Numbers above descriptors on the X-axis denote the number of individual cell lines from which the data were derived. (B) TCGA data from 59,132 patient samples showing the correlation between TBXAS1 mRNA expression and methylation of the promoter (within 1 kb of transcriptional start site (TSS)). Red dotted line denotes linear correlation (R2 = 0.029). (C) Correlation of TBXA2R and TBXAS1 expression for cancers in the TCGA pan cancer dataset.
Like TP expression, The Cancer Cell Line Encyclopedia suggests the addition of cancers with significant TBXAS1 expression that are currently uncharacterized, including ALL, AML, CML, and renal cancer. Of these cancers, at least AML and CML also had significant TBXA2R expression (Figure 12A). Indeed, this phenomenon has been previously reported in a few cancers (bladder, breast, prostate) but has not been universal. What was not previously apparent is the high degree of correlation between TBXA2R and TBXAS1 expression across all tumors in the TCGA pan-cancer dataset (Pearson co-efficient 0.58; p < 0.0001)(Figure 34C). These data suggest co-regulation of TBXA2R and TBXAS1 is common in multiple types of cancer.
Like TP expression, increased TXA2S expression in cancer is transcriptionally driven. The TBXAS1 promoter has two motifs in common with other cytochrome p450 enzymes: TATA independent transcription and multiple transcriptional start sites [74][95]. Maximal promoter activity resides within the first 285 bp. Two clusters of positive regulatory elements (PRE1 (−90 to −50 bp) and PRE2 (−50 to −25 bp)), accounting for ~75% of promoter activity, are counter-balanced by repressive elements between −365 and −665 bp [77][98]. While similar nuclear factor(s) from different cell types interact with PRE2, those interacting with PRE1 exhibit cell specificity. The three original cell lines containing PRE1 binding proteins were all leukemic, whilst cells not utilizing PRE1 were “normal” (CHO and murine macrophages) [77][98]. Utilization of PRE1 by cancer cells might explain the induction of TXA2S in multiple tumor types. The other essential regulatory site was between (−60 to −50 bp), the deletion of which compromised TBXAS1 promoter activity [77][98]. Originally thought to be an AP-1 site, this site turned out to be trans-activated by NF-E2. Interestingly, many of the cancers with most significant TXA2S expression also highly express NF-E2, including bladder, invasive breast, lung, colon and prostate cancers (TCGA data). However, in NSCLC and small-cell lung cancer cells, TXA2S expression is regulated by NF-κB [46][67], suggesting unrecognized transcription factors may play a role in regulating TBXAS1 transcription in cancer.
There is reported epigenetic regulation of TBXAS1 expression. TheOur analysis of human methylation in the TBXA2R promoter (first 1 kb) revealed little evidence of epigenetic regulation in cancer, as the correlation of mRNA and promoter methylation is relatively poor (R2= 0.029) (Figure 34B). Other evidence from the 5.5 kb promoter suggests that distant repressive elements of the promoter (−3400, −3000, and −1430 bp) are methylated (including the long inter interspersed element). No promoter methylation was observed in cells without TXA2S expression; however, complete methylation at −1430 (and partial methylation at sites −3400 and −3000) was associated with TXA2S expression [77][98]. Whether these cell-type specific epigenetic mechanisms play a role in the induction of TXA2S in cancer have yet to be determined but given the perturbations in epigenetic regulation that exist in cancer, and the previous use of such mechanisms in leukemic cells, it is a high probability that they do.
While the trend for increased TXA2S expression in multiple cancers is well-established, the prognostic value of the findings are less clear. In bladder and prostate cancer patients, overexpression of TXA2S was associated with reduced overall survival [50][62][71,83]. However, data in breast cancer patients are less clear, with TXA2S expressed at significantly lower levels in patients with high grade tumors with poor prognostic outcome [47][68] in one study but high TBXAS1 expression correlated with invasive disease and higher tumor grades in another [48][69]. Furthermore, Cathcart and colleagues observed no prognostic role for TBXAS1 in NSCLC, despite significant elevations in TBXAS1 (and TXB2) levels in tumor tissues than the matched “normal” tissues [64][85]. This confusion becomes more apparent when assessing the TCGA pan-cancer dataset for correlations between TBXAS1 expression and clinical outcomes (Figure 23D–F). Like the data for TBXA2R, the overall survival of patients with high expression of TBXAS1 in their tumors is not significantly affected, nor is the progression free survival (although at p = 0.063 it is close to a significant correlation). However, there is a substantial reduction in disease free survival in the TBXAS1 high group, although the effect size is not as large as that for TBXA2R. Five-year disease-free survival is reduced from 67% in the low group to 60% in the TBXAS1 high group. However, overall longevity of the disease-free cohort is still decreased (from 280 to 150 months) by high TBXAS1 expression. While the jury might still be deliberating the utility of TXA2S expression as a prognostic marker, there is no questioning it is elevated in cancer and antagonists of TXA2S potently manipulate cancer progression.