Smart meters are of the basic elements in the so-called Smart Grid. These devices, connected to the Internet, keep bidirectional communication with other devices in the Smart Grid structure to allow remote readings and maintenance. As any other device connected to a network, smart meters become vulnerable to attacks with different purposes, like stealing data or altering readings. Nowadays, it is becoming more and more popular to buy and plug-and-play smart meters, additionally to those installed by the energy providers, to directly monitor the energy consumption at home. This option inherently entails security risks that are under the responsibility of householders. In this paper, we focus on an open solution based on Smartpi 2.0 devices with two purposes. On the one hand, we propose a network configuration and different data flows to exchange data (energy readings) in the home. These flows are designed to support collaborative among the devices in order to prevent external attacks and attempts of corrupting the data. On the other hand, we check the vulnerability by performing two kind of attacks (denial of service and stealing and changing data by using a malware). We conclude that, as expected, these devices are vulnerable to these attacks, but we provide mechanisms to detect both of them and to solve, by applying cooperation techniques.
- Smart Grid
- smart meters
- security
- denial of service, malware, Node-RED
- Basic Information for Authors:
1. Introduction
Rebeca P. Díaz Redondo (https://iclab.det.uvigo.es/rebeca) (https://orcid.org/0000-0002-2367-2219) is an Associate Professor at the Telematics Engineering Department at the University of Vigo and researcher in the Information & Computing Laboratory (AtlantTIC Research Center). She is currently working on defining appropriate architectures for distributed and collaborative data analysis, especially thought for IoT solutions, where computation must be on the edge of the network (Fog Computing). Rebeca has participated in more than 40 projects and 25 works of technological transfer through contracts with companies and/or public institutions. She is currently involved in the scientific and technical activities of several national and European research & educative projects.
Ana Fernández Viinterconnection of devices in elas (https://iclab.det.uvigo.es/avilas) (https://orcid.org/0000-0003-1047-2143) is an Associate Professor at the Department of Telematics Engineering of the University of Vigo and researcher in the Information & Computing Laboratory (AtlantTIC Research Center). She received her PhD in Computer Science from the University of Vigo in 2002. Her research activity at I&C lab focuses on Semantic- Social Intelligence & data mining. She looks for applying both to Ubiquitous Computing and Sensor Web; urban planning & learning analytics. Also, she is involved in several mobility & cooperation projects with North African countries & Western Balkans.
Gabrieltricity networks Fernández dos Reis is a MsC student at the University of Vigo, who have developed his research within the Information & Computing Laboratory (https://iclab.det.uvigo.es/) at the AtlantTIC Research Center.
- Definition
The interconnection of devices in electricity networks to suo support the exchange of data has become an essential aspect that electricity companies need to face. On the one hand, because it will enhance the self-knowledge of the infrastructure by a constant monitoring of data. On the other hand, because national and European regulations have strongly encouraged companies to update their systems to improve the efficiency of the energy consumption. This new infrastructure, usually known as Smart Grid, combines advances in both electric engineering and information and communication technology. Smart Grid leads to a more unified and simplified system for control, maintenance and management of the electricity grid, including generation, transmission, distribution, storage and trade.
- Introduction or History
Smart meters are of the basic elements in the so-called Smart Grid. These devices, connected to the Internet, keep bidirectional communication with other devices in the Smart Grid structure to allow remote readings and maintenance. As any other device connected to a network, smart meters become vulnerable to attacks with different purposes, like stealing data or altering readings. Nowadays, it is becoming more and more popular to buy and plug-and-play smart meters, additionally to those installed by the energy providers, to directly monitor the energy consumption at home. This option inherently entails security risks that are under the responsibility of householders.
This new philosophy takes into account an important aspect in energy production. The growing popularity of photovoltaic facilities and other energy systems has increased the number and variety of energy producers: customers cannot be considered as just consumers anymore, but also producers. This would entail a more efficient delivering of energy, by reducing costs and harmful emissions. Besides, the advantages of energy real-time readings are twofold: for consumers and for energy companies. On the one hand, consumers would be aware of their energy consumption, allowing them to adopt new consumption strategies. On the other hand, energy companies would infer consumption patterns and predict needs and potential peaks of activity to stablish appropriate energy plans and the best fees.
- Data, Model, Applications and Influences
2. Data, Model, Applications and Influences
Energy Readings Domestic Architecture: Hardware and Software
2.1. Energy Readings Domestic Architecture: Hardware and Software
We have emulated a simple architecture that any user may have at home to monitor the energy consumption.
shows the structure, composed of four elements that emulate four smart meters at home. One of them (the central one in the figure) is a Smartpi 2.0: a device specifically developed to act as a smart meter. Briefly, it consists of a Raspberry Pi 3 Model B+ with an extra module that supports reading out voltages, amperages and power. The others are three Raspberry Pi 3 Model B+, where the development framework provided in the Smartpi 2.0 was installed. Consequently, the four devices have the same software and will work the same way. On top of the four original devices, a laptop with good performance is added to the network: it includes an 8th generation Intel Core i7-8550U with 4 cores on 14 nm at 1.80 GHz, with the possibility of Turbo Boost at 4.00 GHz, and 2 × 8 GB RAM DDR4 at 2400 MHz.
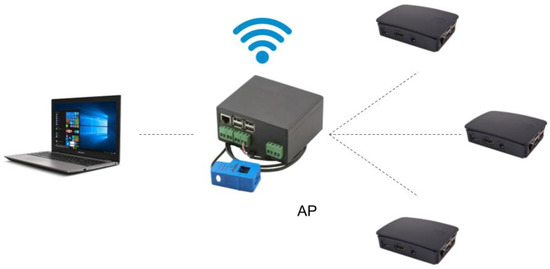
Outline of the network, including the laptop used to access the systems remotely.
The Smartpi 2.0 is a device that was designed by the German company nD-enerserve GmbH, which is specialized in products for energy management and optimization of self-consumption for smart homes and industrial environments. Besides the Smartpi 2.0, the company has developed other products like a unit to control power generation and power consumption or a screen for displaying data about energy efficiency or CO
production. These products (all based on the Linux operating system) are created to form a network with standardized interfaces that is easy to configure, which supports the energy connection between providers and consumers, and that includes different sensors. Their modular design and their combination of hardware and software offer a flexible and suitable solution.
More specifically, the Smartpi 2.0 consists of a Raspberry Pi 3 Model B+ and an expansion module that allows the device to read amperage and, as a consequence, to read the power consumed. The device has four inputs: L1, L2, L3 and N (one for each phase and one for the neutral conductor); this way, power can be measured in three-phase systems. For single-phase systems, only L1 and N need to be connected. One interesting advantage is that the Raspberry Pi can be powered via the three voltage inputs, so an external power supply is not required. The voltage measurement also allows determining the direction of the energy flow, which offers a versatile measurement of both power generation and power consumption. The device has the following range of operation: Voltage (0–390 V), Amperage (0–100 A), Precision (2%) and Consumption (10 W).
For measurement management and communication between the devices, we have used the software that is included by default in the Smartpi 2.0 by the manufacturer (Smartpi version 0.18.5 and Raspberries version 0.20.5): Node-RED [
]. This is an open-source flow-based development tool for the integration of IoT hardware devices [
], APIs and online services developed by IBM Emerging Technology. In fact, it is an adaptation of the Node.js framework and it uses a flow-based programming editor for web browsers. Therefore, a great part of the development is done graphically, rather than textually (i.e., by writing code, as usual). In general, a node receives information, processes it and sends the result to the next node. The basic unit of information, called a message, is a packet that is transmitted from one node to the next one and contains the information that needs to be processed, as well as any information added by the user and some metadata. Since Node-RED is based on Node.js, we are essentially dealing with JavaScript objects that can be converted to JSON. Messages have the following basic fields: (i)
, a random identifier for each message created; (ii)
, a property used for fragmenting and reassembling messages; and (iii)
, the content of the message.
According to their role in the information flow, nodes are classified into three types: (i) Input nodes, which introduce information in the flow that is usually gathered from a sensor or from an incoming IP packet; (ii) Output nodes, which do not forward the information to another node but to a database (to be stored) or to a console (to be debugged), for this the message is sent as an IP packet that exits the flow; and (iii) Intermediate nodes, which are all the other nodes that receive the message (input), modify the information and send the message (ouput).
shows an example of a simple flow with an input node, an intermediate one and an output one. When node Go is activated, a message is introduced in the flow, processed by node Hello! and displayed in the console thanks to node display.
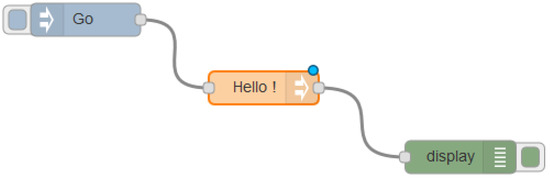
Example of a simple flow.
Node-RED messages (Javascript objects) are stored within the Raspberries in MongoDB instances, a NoSQL database that stores information in JSON format. Converting these Javascript objects into JSON format (and vice versa) is extremely simple. MongoDB works with collections that group the data together. These collections work like tables in SQL databases, grouping objects with the same structure. Since JSON keys are always strings, there is no need for the keys of two different objects to be the same, as long as their structure is the same in terms of arrays.
In order to perform our experiments, we configured a network connecting the devices, as
shows, using an IP range normally used in home networks (192.168.4.0/24) (Please, note that 192.168.4.0 is an IP address in the range 192.168.4.1–192.168.4.255, the address range normally used in home networks. In fact, a router may automatically assign the address 192.168.4.0 to any device (tablet, smartphone, etc.) of the local network. Indeed, the IP range 192.168.4.1/255 is a private IP range that follows the standards set by RFC 1918 and addresses like 192.168.4.0 are not allowed in the public Internet. Thus, if the private network needs to connect to the Internet, is must use a proxy server or gateway). Consequently, each device has a static IP address assigned to the wireless interface and a unique identifier in such a way that the devices with ID number
, is assigned with the IP address 192.168.4.X. Node
with IP address 192.168.4.1 is the Smartpi 2.0, which will be the access point. Additionally, and in order to feed the devices with information, we have used synthetic data, since using real readings are not relevant for these experiments. In fact, in a real context (using Smartpi devices), the only modification needed would be replacing the input of data by the real measurements of the sensors if they are connected to a real power grid.
2.2. Communication Protocol: collaborative exchange of data
We have defined two basic flows for the devices interconnected in Fig. 1 to exchange data: a reading flow and a reception flow. We have done some modifications to the basic exchange data in order to add essential information for data gathering, such as the time of the energy reading and the node identifier. Thus, each packet include these three values: the energy reading, time of the reading and the node identifier that has obtained the data.
We have defined two basic flows for the devices interconnected in Fig. 1 to exchange data: a reading flow and a reception flow. We have done some modifications to the basic exchange data in order to add essential information for data gathering, such as the time of the energy reading and the node identifier. Thus, each packet include these three values: the energy reading, time of the reading and the node identifier that has obtained the data.
These two new flows allow all the devices in the domestic network to share their energy readings. This is key for the next flow, defined to try to protect the network against external attempts of corrupting the readings by injecting false readings in the system. Therefore, the third flow, defence flow, was designed to work as a defence against unauthorised alterations in the database. The main objective of this flow is to support a collaborative work among the domestic devices. The underlying idea is that each device compares its own the energy readings with the previous ones locally obtained. When an anomalies is detected, the device asks the readings to its neighbours to compare the data. Therefore, the designed defence flow is composed of two parts or steps. The first one focuses on the local analysis of the data, whereas the second one focuses on a procedure to collaborative decide if a unusual energy reading is, indeed, a right energy reading or a potentially altered one.
3. Testing the solution and results
Testing in IoT networks usually covers the following aspects. First, probing attacks for information gathering, which try to collect information illegitimately from remote systems through scanning or fingerprinting. Second, Denial of Service (DoS) and Distributed Denial of Service (DDoS), which try to overwhelm the resources with illegitimate requests. These attacks are based on TCP, UDP and HTTP protocols. Finally, information theft to get confidential or sensitive data. In order to test the infrastructure and the collaborative communication scheme, we have selected two of the most frequent attacks: DoS, which tries to infringe the third pillar of the CIA (Availability); and the False Data Injection using a malware to infringe the other two pillars of CIA (Confidentiality and Integrity).
Testing in IoT networks usually covers the following aspects. First, probing attacks for information gathering, which try to collect information illegitimately from remote systems through scanning or fingerprinting. Second, Denial of Service (DoS) and Distributed Denial of Service (DDoS), which try to overwhelm the resources with illegitimate requests. These attacks are based on TCP, UDP and HTTP protocols. Finally, information theft to get confidential or sensitive data. In order to test the infrastructure and the collaborative communication scheme, we have selected two of the most frequent attacks: DoS, which tries to infringe the third pillar of the CIA (Availability); and the False Data Injection using a malware to infringe the other two pillars of CIA (Confidentiality and Integrity).
The DoS attack was carried out by including different number of attackers, and checking the response time and the fraction of discarded packets due to congestion and the state of the CPU of the target device. This attack cannot be detected automatically and it leaves no direct trace. However, a DoS attack can be suspected as a possible cause because the systems work properly on their own but errors appear when they communicate with each other. An attempt to access the system during the attack would lead to the same conclusion because in extreme cases the system cannot be accessed. One way to detect a DoS attack could be to keep a register of the incoming connections of the device. Using a malware to modify the energy readings was carried out by using fake HTTP requests to access a resource that would normally be non-accessible. With this strategy, we have change the database content. Choosing the right software is of the utmost importance for the implementation of the product. In this specific case, a vulnerability of the Node-RED software used for these devices has allowed unauthorized access. However, it is to be expected that this development environment becomes more stable and secure over time. In our analysis, we have provided a defence flow, as a measure to detect and correct this kind of attacks. However, and in case of a massive attack where not only a device, but the majority of its neighbours are being attacked as well, it might be almost undetectable. Only a detailed analysis of the databases can give us the evidence: outlier values in the energy consumption without any other explanation.