Your browser does not fully support modern features. Please upgrade for a smoother experience.
Please note this is a comparison between Version 1 by Mohamad Emad M Alabdulkarim and Version 4 by Jessie Wu.
Laser-heated diamond anvil cell (LH-DAC) experimentation has emerged as a leading technique for materials processing at extreme pressures and temperatures. Laser characterisation plays a vital role in any LH-DAC experimentation, so a brief resesarchview of the most common Laser Characterisation Diamond Anvil Cell (LC-DAC) methods is provided here. This includes an introduction to spectroscopic pressure and temperature measurements, followed by the most wide-spread laser spectroscopy techniques.
- high pressure
- L-DAC
- multi-band pyrometry
1. Introduction
Over the past century, the development of high-pressure methods for materials modification and synthesis has been the focus of considerable research activity [1]. Diamond anvil cells (DACs), developed by Charlie Weir in the mid-20th century [2][3][2,3], are presently the most utilised systems for generating pressures greater than 3 GPa within small volumes [2]. Since the first laser-heating of samples in DACs by Takahashi and Bassett [4], the number of high-pressure materials studies, where materials are processed using UV-IR coherent sources (e.g., lasers or synchrotron radiation) has grown steadily over time—and now totals over 70 per anum—see Figure 1A [5][6][7][8][9][10][11][5,6,7,8,9,10,11]. Although there have been historical reviews of diamond anvil cells and high-pressure research [2][4][11][12][13][14][15][2,4,11,12,13,14,15], the growing importance of Laser-induced materials processing within Diamond Anvil Cells (L-DACs) is the motivation for this researchview.
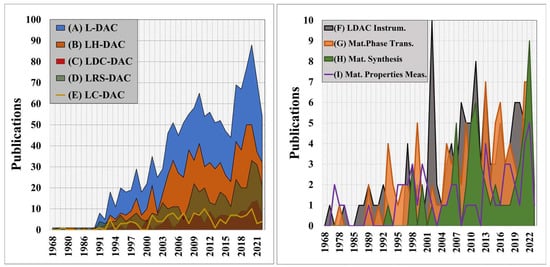
Figure 1. At left, (A) total annual scientific production for all L-DAC studies driven by UV-IR lasers [blue], (B) laser-heated diamond anvil cell (LH-DAC) articles where laser heating was employed for materials modification [orange], (C) laser-driven dynamic compression diamond anvil cell (LDC-DAC) experiments [red], (D) laser-induced reactive synthesis diamond anvil cell (LRS-DAC) articles where laser-induced reactive synthesis occurred [green], and (E) laser-based characterisation (LC-DAC) experiments, e.g., laser spectroscopy [yellow line]. At right, a breakdown of L-DAC articles focused on: (F) L-DAC instrumentation and hardware improvements [grey], (G) equation of state, phase transitions and phase mapping of materials [orange], (H) materials synthesis [green], and (I) material property measurements at high pressures and temperatures [purple line].
L-DAC systems have yielded many scientific firsts, from establishing material equations of state and phase transitions at extreme conditions [16][17][18][19][16,17,18,19] to synthesising novel materials [20][21][22][23][24][25][20,21,22,23,24,25]. Recent examples include the synthesis of solid metallic phases of hydrogen [26][27][26,27], metallic xenon phases [28], iron-nitrogen composites [23], and binary Fe-Bi intermetallic compounds [24] (to name just a few). Laser heating allows for precise control of sample temperatures during processing at high pressures--and therefore strongly influences the resulting phases and compositions that form in situ [25][29][30][31][32][25,29,30,31,32]. When combined with real-time material characterisation techniques, such as X-ray diffraction (XRD), sample compositions and structures can be actively controlled.
L-DAC system implementations range from “basic” laser heating and modification of samples [5][33][34][35][36][37][38][39][40][41][42][43][5,33,34,35,36,37,38,39,40,41,42,43] to laser-driven dynamic compression of materials [44][45][46][47][44,45,46,47] to laser-induced chemical reactions (e.g., via pyrolysis or photolysis) [25][48][49][50][51][25,48,49,50,51]. This article (Part I) focuses on the first of these implementations, i.e., laser-heated diamond anvil cells (LH-DACs), where a laser is focused onto a sample within a DAC to control its temperature.
2. Spectroscopic Pressure Measurements
Static pressure measurements are essential for all materials processing experiments within an L-DAC. Since the early days of LH-DAC experimentation, laser-induced fluorescence of ruby (Cr-doped Al2O3) has been the foremost method of pressure measurement. Static pressure inside the DAC is inferred by placing micro-scale particles/flakes of ruby within the pressure medium and then monitoring the fluorescence wavelength(s) with a high-resolution spectrometer [2][52][53][54][55][56][2,75,122,147,288,289]. At room temperature, ruby fluoresces at two prominent lines, known as the R1 and R2 lines, centred at ~694.3 nm and 692.9 nm, respectively [57][290]. These peak wavelengths increase linearly with pressure, and so can be used to infer pressure. For example, the R1-line peak shifts to about 701.2 nm at 20 GPa [56][289]. This method can be extended to measurements of over 150 GPa [57][290]. Doubled Nd:YAG lasers at 532 nm are frequently used as excitation sources, although 405 nm lasers also yield strong fluorescence signals [58][59][94,291].
Provided the ruby crystals are fully encapsulated by the pressure-transmitting medium, the L-DAC pressure can be estimated from the empirical relation [60][74]:
P1=(C1C2)[(λ1λo)C2−1]
Here, C1 ≈ 1904 and C2≈ 5. Of course, this expression is only accurate near room temperature; at elevated temperatures, corrections must be made for peak shifting and broadening [61][62][63][292,293,294]. Bassett recommended that ruby fluorescence be used only as a secondary pressure measurement for LH-DAC experiments [2], due to the inverse relationship between fluorescence and temperature. Additionally, Anzellini and Boccato cautioned against extrapolating pressure data beyond the calibrated range, instead recommending the use of Raman spectroscopy for pressures up to 400 GPa [64][241]. Other fluorescent materials, such as strontium tetraborate (SrB4O7), alexandrite (Al2BeO4), and samarium-doped yttrium aluminium garnet (Sm:Y3Al5O12) have also been proposed as transducing materials, due to broadening of the ruby lines at high temperatures [65][59].
3. Optical Temperature Measurements by Micro-Scale Multi-Band Pyrometry
Knowing the true temperature of an L-DAC sample is essential for practically every high-pressure scientific endeavour. Obtaining direct, accurate measurements via implanted thermocouples/thermistors, however, is quite challenging—especially when micron-scale samples are selectively laser-heated within an LH-DAC, or when strong thermal gradients are present.
It is well-known that Planck’s blackbody equation describes the radiation emitted from the surface of a heated material [66][284]; defining I(λ,T) as the spectral intensity, T as the temperature [K], λ as the wavelength [nm], kb as Boltzmann’s constant, h as Planck’s constant, and ε as the material’s emissivity, Planck’s equation can be represented as:
I(λ,T)=εc1λ5[exp(c2λT)−1]
Here, c is the speed of light, while c1 and c2 are the constants: c1=2hc2 and c2=hckb/ .
Multi-band Pyrometry uses Equation (3) to measure the black-body radiation emanating from a material to estimate its temperature. By measuring two or more intensities at different wavelengths and applying them to Equation (3), it is possible to solve for the local temperature in terms of intensity and wavelength. Generally, the greater the number of discrete bands observed in the spectrum, the more accurate the temperature measurement that is made [67][295]. Multi-band pyrometry can be implemented in L-DAC systems by observing samples within the diamond anvil cell using a near infrared (NIR) or infrared (IR) microscope—and then detecting the emitted radiation through narrowband filters with sensitive photodetectors, e.g., avalanche photodiodes or photomultiplier tubes [68][296].
Significant effort has been required over the years to obtain accurate pyrometry measurements during L-DAC experiments [69][70][71][182,263,268]. A primary challenge is that the L-DAC samples are typically very small, and the pyrometer must collect radiation from micron-scale areas (<<1 mm2). This means that the collected radiant flux is quite small and difficult to detect (can be <<pW); this is especially true at low to moderate temperatures, remembering that the radiation intensity is proportional to T4 (Stephan’s Law).
In addition, inaccuracies/variations in temperature measurements may result from many factors, including wavelength-dependent sample emissivities, sample surface roughness(es), optical absorption along the transmission path, and less-than-perfect alignment of the pyrometer’s optics. Large temperature gradients across the detector’s field of view also result in highly inaccurate measurements, as the detector “averages” the spectral intensities of the observed area.
The L-DAC literature contains many examples of multi-band pyrometry. For example, during the early development of the LH-DAC, Ming and Bassett employed optical pyrometry with YAG laser heating and measured sample temperatures in the range of 1273–1875 K. They also heated a graphite sample using a ruby laser, and estimated the sample’s temperature to be 3273 K [30].
Systems that evaluate the intensity of radiation over a broad spectrum, rather than discrete wavelengths, are known as spectroradiometers—and these generally offer more accurate temperature measurements [72][73][96,297]. Shen et al. developed a unique double micro-spectroradiometric system, integrated with an X-ray microbeam, for ultra high-temperature measurements [74][71]. Nuclear resonant inelastic X-ray scattering (NRIXS) was also used to independently verify their spectroradiometric methods [75][156]. Multiband pyrometry or spectroradiometric systems are now routinely used with almost all LH-DAC experiments.
4. Laser-based Spectroscopy and Characterisation
Laser-based spectroscopy has been used since the early days of materials processing in diamond anvil cells. The first infrared (IR) spectroscopy through a DAC was conducted in 1959 by Weir et al. when they observed infrared absorption spectra between 1–15 microns and noted the shift in calcite spectral lines to higher frequencies with increasing pressure [76][298]. In 1968, Brasch et al. performed the first Raman spectroscopy of samples within a DAC, using a He-Ne laser to study mercuric iodide (HgI2) [77][53]. Additionally, in 1971, Block et al. of the US National Bureau of Standards (NBS) conducted the first fluorescence spectroscopy through a diamond anvil cell, allowing in situ pressures to be measured [11][55][11,288]. These seminal events are shown on the right side of the timeline in Figure 2.
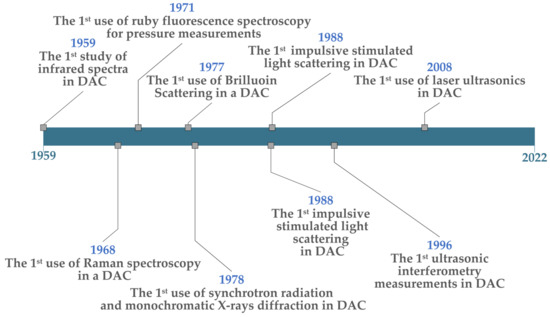
Figure 2.
Chronology of Important LC-DAC developments.
Additional important events include: (1) The first Brillouin scattering measurements within a DAC were carried out by Bassett and Brody in 1977, measuring material elastic moduli [78][253]. (2) The first use of synchrotron radiation was conducted by Bassett et al. in 1978 to perform broad-spectrum and monochromatic X-ray diffraction [2]; this made it possible to measure a sample’s structure in real-time as P-T conditions changed in the DAC. (3) The first laser-induced phonon spectroscopy (also known as impulsive stimulated light scattering) was attempted by Brown et al. in 1988—from which acoustic velocities and the densities of compressed materials could be determined (which helps to establish equations of state) [16]. In this case, they studied the density of methanol at pressures up to 6.8 GPa. (4) In 1996, Spetzler et al. made the first “microwave-induced” ultrasonic interferometry measurements in an DAC. Utilising a microwave source at 1.0 GHz (300 mm wavelength), they generated acoustic pulses separated by a specific time delay [79][299]; acoustic reflections from the front of the sample vs. the far side were then allowed to interfere—and the sound velocity through the sample (at high pressures) could be inferred from the amplitude of the superimposed signal. This method is analogous to a Michelson Interferometer, only using light-stimulated ultrasound. (5) Finally, the first use of laser ultrasonics was carried out by Decremps et al. in 2008, where a Ti:Sapphire laser with short, 100 fs pulses was used to generate acoustic waves at tens of GHz though compressed samples [80][256]. By measuring the attenuation of the resulting pico-second ultrasonic waves vs. the hydrostatic pressure in a DAC, elastic properties of sample materials could be determined. Most of these methods are still in common use for LH-DAC and other L-DAC experimental studies.