The quality-control process in manufacturing must ensure the product is free of defects and performs according to the customer’s expectations. Maintaining the quality of a firm’s products at the highest level is very important for keeping an edge over the competition. To maintain and enhance the quality of their products, manufacturers invest a lot of resources in quality control and quality assurance. During the assembly line, parts will arrive at a constant interval for assembly. The quality criteria must first be met before the parts are sent to the assembly line where the parts and subparts are assembled to get the final product. Once the product has been assembled, it is again inspected and tested before it is delivered to the customer. Because manufacturers are mostly focused on visual quality inspection, there can be bottlenecks before and after assembly. The manufacturer may suffer a loss if the assembly line is slowed down by this bottleneck. To improve quality, state-of-the-art sensors are being used to replace visual inspections and machine learning is used to help determine which part will fail.
1. Introduction
The state of industrial engineering that researchwers see today is the result of consecutive advancements in the field of manufacturing in terms of innovation and economic development. Generally, the industrial revolution has been considered as the ongoing process that was initiated in the late 18th century, but four major changes in the field of manufacturing are the reason for what the industry looks like right now. These four major changes are often regarded as the pioneer that brought landscape changes in the manufacturing industry, so they are generally classified as the industrial revolution that shaped the manufacturing industry. A revolution builds on the knowledge gained from previous revolutions and creates progressively complex networks for commercial exchange. The foremost industrial revolution came in the late 18th century, mainly aimed at the benefits of mechanisms. The main focus of the 1st industrial revolution was to find a substitute for humans or animals by the means of mechanical labour. The machines of this time required a large amount of energy and were generally situated near the source of the energy, such as coal. The means of energy generation was also limited to coal as modern sources of energy, such as solar energy, hydro energy, and wind energy, were not discovered yet. This combination of machines situated near the energy source gave rise to a new form of living, called industrial cities.
These towns tend to be situated near an energy source and had a well-connected transportation network. New forms of manufacturing activities emerged in these cities as they grew in terms of population. These manufacturing activities include steel, textiles, tools, etc. Thus, by the use of mechanisms, machines were created using conventional energy sources, and these attracted the population, which brought more manufacturing activities. As the relationship between man and machine grew more and more, this created complex commercial relations and an advanced form of manufacturing.
The principle of the 2nd revolution was based on mass production along assembly lines, which helped in scaling up the output of the manufacturing industries. The 2nd revolution assisted in the advancement of the workforce, task, procedure, and machine coordination. This coordination also helped in growing the output of the manufacturing industries. The introduction of specialty and connection in manufacturing engineering, which gave rise to several manufacturing parks, was one of the primary outputs of the 2nd revolution (industrial belts). The access to electricity at a cheaper cost also fuelled the development of these industrial parks in the 2nd revolution. The 2nd industrial revolution had a heavy dependence on modern telecommunication systems, such as radios, telegraphs, and telephones, for better communication among these interdependent manufacturing ecosystems. In this era, rwesearchers experienced a major shift in the aspect of manufacturing units and the place of energy sources. Due to the development of long-distance transportation, such as railway and ferry services, researcherswe were able to create manufacturing parks at locations that were far from coal mining cities, as the coals were transported to the respective locations by the means of railway and ferry services. The 3rd industrial revolution took place in the late 20th century, where the driving factor of the advancement in manufacturing was automation. As the burden of employing humans for doing repetitive work in the manufacturing industry increased, the industrialist focused on finding an alternate solution to the problem. This gave rise to the deployment of computer-aided manufacturing processes. Computers took a central role, as many processes in manufacturing were assisted by the computers. This gave rise to the Computer-Aided Design (CAD) package besides Computer-Aided Manufacturing (CAM) in the industrial engineering industry.
Computer-Aided Design (CAD) is the process of designing the parts to be manufactured with the assistance of a computer. By using a computer to design the parts, the accuracy of the part to be produced increases and computers are easily able to simulate the conditions in which the manufactured part will be used. In turn, Computer-Aided Manufacturing (CAM) is a process in which the software and computer-controlled machinery are combined to manufacture the part. CAM increases the accuracy of the product by neglecting the error possibility caused by a human operator. During the 3rd industrial revolution, globalization played a vital role as the trade policies between the countries were relaxed and low-cost labour from developing countries was available as a suitable alternative to mechanization. So, globalization greatly benefited the manufacturing industry as it enabled minimum input costs, especially related to labour and technology sharing among various manufacturing countries.
The term “Industry 4.0” was first used in the Federal Republic of Germany in 2011 during the “Hannover Fair”. The event’s objective was to unveil a new German financial strategy related to high initiatives, heralding the start of the 4th industrial revolution
[1][2][1,2]. In the 4th industrial revolution, it was accepted that industrialization was the main cause of environmental degradation. So, in the 4th industrial revolution, the main aim of the manufacturing industry is to create a viable and sustainable ecosystem that minimizes the degradation of the environment. The manufacturing industry in the industrial revolution focuses on improving the product life cycle, collaborative manufacturing along with cyber-physical systems, and applying industrial principles, such as decentralizing, virtualization, and interoperability. Manufacturing’s emphasis has switched from mass production to smaller batch manufacturing, which can result in a more exact reaction to variations in the request curve while also reducing production waste
[3].
Figure 1 shows the four industrial revolutions.
Figure 1. The four industrial revolutions.
Industry 4.0 also works on complete network communication between companies, factories, suppliers, logistics, resources, customers, etc. This will assist the company in staying current with real-time demand curve fluctuations. Industry 4.0 primarily focuses on creating “smart factories”
[4], where items may be distinguished and located at all periods by stakeholders. The stakeholders will also be able to know the history of the product, the current status of the product, and all the possible routes the product has to reach its target state. Thus, the stakeholders can efficiently guide the product to its target state and reduce the transportation time to a minimum. As a result, Industry 4.0 encompasses a wide variety of critical factors for the evolution of a sustainable industrial sector. Minimizing waste, the wise utilization of natural resources, efficient usage of raw materials, high power capacity, and streamlining production time are all vital values for the sector’s long-term management.
2. Background
Industry 4.0 is enabled by the following technologies (
Figure 2).
Figure 2. Enabling technologies of Industry 4.0.
- (a)
-
Big Data-
In Industry 4.0, information from production is evaluated and processed to propose data-driven solutions to current problems. This necessitates a well-defined, complicated structure of the manufacturing facility, as well as many Industrial Internet of Things (IIoT) sensors capable of monitoring operations in real time and sending data for processing. A large amount of data is created when several sensors are used to examine any given stage of a manufacturing process. These data must then be saved to comprehend the performance evaluation of the manufacturing process and to modify the process as needed. As a result, big data management is required for effective data management and storage.
Leite M et al.
[5] described the need for big data in Industry 4.0. As more sensors are used, and where these sensors can communicate with one another, a complex network of data is created. These data must be mined, evaluated, and preserved since it is the property of the supplied organization. The authors also mentioned the properties of these data that must be dealt with, which are volume, variety, velocity, value, and veracity. The authors then used a case study to examine the differences between the data collected using processing procedures and data received from social media.
- (b)
-
Real-
Time Optimization-
Leite et al.
[5] described the real-time optimization of the supply chain in the era of Industry 4.0. The authors attempted to achieve supply-chain process solutions that are internationally optimal and adaptable in the manufacturing business. The authors attempted to concentrate on the supply-chain market’s planning and scheduling phases. Planners can deal with market uncertainty by improving the planning and scheduling processes.
The authors also emphasized the sustainable process as a new need that may be met by real-time process optimization. This will allow for eco-friendly operation while also lowering costs. To discover the best answer to the challenges presented during the planning and scheduling phases, the authors adopted a meta-heuristic method.
- (c)
-
Cloud Computing-
Yen et al.
[6] focused on improving the speed of production performance. The authors underlined the need of increasing productivity to offer the product to the organization. The fourth industrial revolution places a strong emphasis on cyber-physical systems. Yen et al.
[6] classified cyber-physical systems into three broad categories: cloud services, sensor infrastructure, and embedded systems. The authors also emphasized the significance of cloud services, which enable data storage and security while also allowing employees to access services or data regardless of their physical presence in a specific geographic region. The cloud storage service offloads server maintenance to a third party while ensuring the data’s security and availability for the consumer. This allows a manufacturing organization to simply expand and descale their infrastructure based on their needs without incurring infrastructure costs. The second advantage of cloud services is to provide services to the customer without the physical installation of any specific software. Finally, cloud services allow for a more seamless transformation and transfer of data both within and outside the cloud architecture. These contribute to increased manufacturing process productivity.
- (d)
-
Cyber-
Physical System-
Jazdi et al.
[7] described the importance of cyber-physical systems to lead in the new industrial revolution, namely, the data-centric Industry 4.0. The authors also compared the cyber-physical system to a typical embedded system, with the main distinction being the intercommunication capability provided by the cyber-physical system. Jazdi et al.
[7] also showed that a cyber-physical system with the help of the Internet of Things presents the capability of smart networking, mobility, and flexibility.
- (e)
-
Additive Manufacturing-
Ugur M Dilberoglu et al.
[8] emphasized the need for additive manufacturing and its importance in Industry 4.0. According to the authors, as mass customization becomes possible in smart factories, the need of meeting customers’ demands for minute detail has been stressed. This is possible by using additive manufacturing methods. As a result, additive manufacturing has gained widespread acceptance in the fields of aerospace manufacturing, automobile manufacturing, pharmaceutical manufacturing, and so on.
- (f)
-
Cobots-
Rinat Galin et al.
[9] suggested how robots can collaborate with humans to complete a given task efficiently. One of the most visible aspects of Industry 4.0 is the usage of robots in manufacturing. Robots are more efficient and precise than humans in performing repetitive tasks in the industry. The authors divided industrial robots into three categories: industrial robotics, collaborative robots, and mobile/semi-autonomous robots. An industrial robot is reprogrammable and inflexible to a position. Collaborative robots aid people in completing tasks while being near the operator. The third type of robot is a semi-autonomous mobile robot that follows the operator’s instructions.
- (g)
-
Machine Learning-
Machine Learning is the process of evaluating previous data and solving current issues. Machine learning has been a prominent topic in the implementation of Industry 4.0, with a focus on data-centric solutions. Machine learning is divided into three categories: machine learning, deep learning, and artificial intelligence. Machine Learning takes a shallow learning approach to the data to provide a given output, while deep learning itself tries to find the correlation before providing any given output. To make repetitious tasks autonomous, artificial intelligence uses machine learning or a deep learning technique.
- (h)
-
Augmented Reality-
Volker Paelke et al.
[10] suggested the use of augmented reality in a smart factory environment. Augmented reality may simulate the real environment, allowing workers to receive more hands-on training. Workers will be able to work more efficiently as a result of this. A shift from a command line interface to a graphical user interface, to augment reality, is also suggested by the authors. The graphical user interface was able to offer a visual depiction of the task, whereas augmented reality can assist in fully visualizing the environment in which the work is to be completed. The authors also discussed how to employ video see-through, optical see-through, and projection for a more effective training experience for workers.
- (i)
-
Internet of Things-
In Industry 4.0, data collection and data sharing play a vital role in providing data solutions to smart factories. As a result, cyber-physical systems are used to create smart sensors that gather and interact with one another. The Industrial Internet of Things (IIOT) infrastructure is utilized for communication among these sensors and data collection. Wan et al.
[11] defined IIoT as the ability to collect data from various sensors in the network securely and forward the given data to the cloud services for analysis of the data. As a result, the IIoT bridges the gap in collecting and transferring sensitive data from sensors to cloud infrastructure.
3. Anomaly Detection
In data science, the process of identifying events and observations that deviate from the usual pattern in the dataset is called anomaly detection. Outliers are different from anomalies. In a given dataset, the data are closed together based on any given standard deviation of the mean or median. There can be some extreme data points that can be distributed evenly or unevenly in a fixed range. These extremes can be very large or very small, depending on the orientation of the entire dataset. These extremes present in the data are called outliers. An anomaly is a term that can be used instead of outliers interchangeably.
There can be multiple reasons why an outlier is present in a dataset. The most common reason is human error, which is produced while collecting the data. For example: take the value “999” instead of “666”. Such type inconsistencies greatly affect the dataset negatively. However, the magnitude to which the outlier affects the data is still unknown, but it can completely change the perception of the data. So, the elimination of such a dataset becomes necessary. For example, for 10 observations (1, 2, 3, 4, 5, 6, 7, 8, 9, 100). Here, N = 10, and the sum of the number = 145. The mean of the 10 observations is 14.5, but on closer inspection,
researchwe
rs observe that of all the data in the observation area in the 1-unit incremental order, only the last one is supposed to be “10”, but instead it is “100”. This “100” can be considered an outlier. Now, if
researcherswe consider “10” at the 10th position of the observation, then the mean would be 5.5. This clearly shows that an outlier in the dataset had pulled the mean towards itself. Thus, giving the wrong perception of the dataset. In the case of the median, there would be no change as it solely focuses on the central tendency.
To need to detect an outlier in
theour dataset is very important. This can be achieved by identifying the data points whose difference between the mean and median is very high. For this, the help of data visualization can be considered, such as scatterplots and boxplots or violin plots. Through these data visualization techniques,
researcherswe can easily detect the presence of any outliers in the dataset. Taken from Osama Abdelrahman et al.
[12], outlier data are shown in
Figure 3 and
Figure 4. Anomaly data can be grouped into three main categories:
Figure 3. Outliers in a boxplot.
Figure 4. Outliers in a scatterplot.
- (a)
-
Point Anomaly-
In a point anomaly, there are single independent data instances that show deviation in their behaviour compared to other data instances in the dataset. In
Figure 5, samples of point anomalies are shown in 2D (two-dimensional space).
Figure 5. An example of an anomaly in 2D (two-dimensional space) where “O1” and “O2” are point anomalies, “N1” and “N2” are collective anomalies, and “O3” is a collective anomaly.
- (b)
-
Context Anomaly-
A context anomaly, also called contextual anomaly and condition anomaly, is where data instances can be considered as an anomaly in a given situation only; i.e., the data points are normal in another context. Contextual anomaly is commonly seen in time-series data streams.
- (c)
-
Collective Anomaly-
A collective anomaly can be considered as a collection of various data instances that appear to be normal when considered individually, but show irregularity when considered in a group or a bigger picture. The whole group of data will show deviation from the normal data instances. To prevent or eliminate the outlier,
rwe
searchers must first detect an outlier in the dataset. It might happen that the data are not scaled and are exponentially increasing and decreasing; this pattern is viewed as an outlier in the dataset. So, before eliminating the outlier,
researcherswe need to first scale the data in the dataset. Depending on the number of outliers present in the data,
researcherswe can take the measures. If the anomaly is minute, then eliminating the anomaly points will not affect the dataset. If the outliers are more than the sampling, the data is more meaningful; also, using the median instead of the mean will work, as the median calculates the central tendency to reduce the effect of an outlier in the dataset. Finally, it is advised to take suggestions from a domain expert for a proper understanding of the data.
Features of Assembly Line
For assembly lines, precise configuration and essential management strategies are employed to increase efficiency and effectiveness. For effective management, factors such as scheduling, industrial environment, and assembly line balancing are taken into consideration. Since the inception of the assembly line at the Highland Park Ford Plant in Michigan, which may be recognized as the “Industrial Revolution” of the modern era, significant progress has indeed been made in manufacturing. Today, an assembly line is integrated with intelligent sensors, the Industrial Internet of Things (IIOT), sophisticated machinery, scientific management planning, etc. Bortolini et al.
[13] describe the various dimensions that are considered in assembly system design, as shown in
Figure 6, which are discussed as follows:
Figure 6. Dimensions of assembly system design.
- (a)
-
Balancing-
Balancing is the most researched topic in the field of assembly-line design. In this context, academic scholars and experts have established models and means for optimizing production-line tasks at the workstation. For this, the objective function is taken into consideration and a set of constraints is made to satisfy the objective function. This results in the optimization of various attributes that are associated with the assembly system, such as time and cost.
- (b)
-
Sequencing-
The sequencing metric is the brief-stretch counterpart of the balancing dimension. In diverse-model assembly lines, numerous product models from the shared product family fulfil the requirements of mass customization. So, to minimize the workstation load and to fulfilling the customer’s demand, sequencing is done on the assembly line product model.
- (c)
-
Material feeding-
In an assembly line, several products are employed. These models work independently but in sync with other product models. So, each product models require an independent material requirement, which is required to be fed into the assembly line at different time intervals. So, the need to feed the right materials at the right locations can be solved using the material feeding process.
- (d)
-
Equipment selection-
To reduce the operational cost of the assembly line up to date, machines and sensors are required to be installed at the assembly station. As a result, a necessity for equipment system configuration is to pick which apparatus to purchase and install at the workplace to minimize operational costs.
- (e)
-
Learning effect-
The learning effect predicts an inverse link between an employee’s number of job duplications and work length. In today’s manufacturing environment, an assembly line is massively customized, and the product’s life expectancy cycle is quite short. So, the introduction of new products in the assembly system causes reduced productivity due to the training of the workers. To decrease this time consumption, an analysis of the learning effect on the assembly system is done.
- (f)
-
Ergonomic risk-
Ergonomic risk is the physical stress that the worker induces while working for a prolonged period. Often, the workers in the assembly system suffer from musculoskeletal disorders, due to repeated operations and the high frequency thereof. So, the workstations must be ergonomically friendly to the workforce working in the workstation. With the advent of the 4th industrial revolution, data-driven approaches are encouraged, and the decisions taken regarding the assembly line systems are done using data-driven decision-making. These gave rise to various skills, such as cyber-physical systems (CPS), the Internet of Things (IoT), cloud computing, machine learning, collaborative robots (co-bots), augmented reality, and additive manufacturing.
4. Machine Learning Algorithms in Manufacturing
With the advancement in data-collection approaches, concepts such as a Smart Plant and Internet-of-Things (IoT) have become widespread, as described by Ziqui Kang
[14]. The use of IoT has exponentially increased in the manufacturing sector in the last decade. The sensors used in Industry 4.0 and IoT can collect data in real time and on-site from the production lines. Machine learning has been used in Industry 4.0 to effectively accomplish complex tasks, such as forecasting, analysis, strategy, and predictive modelling, using past information. Therefore, the industry nowadays is focusing mostly on data-dependent approaches. It has also been discovered that superior-quality data and massive data collections may vastly enhance the accuracy of the model deployed in machine learning algorithms. When working with such a machine learning algorithm, it is critical to use a suitable algorithm to address a specific problem. Machine learning can be broadly classified as follows (
Figure 7).
Figure 7. Classification of artificial intelligence and machine learning.
- (a)
-
Supervised Learning-
A machine learning algorithm in supervised machine learning constructs a function from the relevant input or multiple inputs and provides output as a set of labelled trained data. This function is based on the pattern that can be observed between the given input and output of the machine learning algorithms. Supervised machine learning expects data to be cleaned in terms of feature variety and assumes parameter optimization by using a given machine learning algorithm.
- (b)
-
Unsupervised Learning-
The unsupervised machine learning method does not need labelled training data for its usage and implementation. Since there is no understanding of the connections between the input and output of the information, unsupervised machine learning techniques are often deployed. Unsupervised machine learning algorithms are often employed when the correlations between the data input and output are unknown to the user.
- (c)
-
Semi-
supervised Learning-
The supervised and unsupervised methods deal with labelled data and unlabelled data completely, but some datasets are such that only a minor portion is labelled, but which cannot be neglected. Such data cannot be analysed by supervised and unsupervised machine learning algorithms. To deal with such algorithms, semi-supervised machine algorithms are used.
- (d)
-
Reinforcement Learning-
Reinforcement learning majorly deals with real-time analysis of the data. Here, the agent observes the environment in which it is placed. All the actions that the agent performs will result in some reward to the agent. The reward can be positive or negative, depending on whether the action by the agent is fruitful in achieving the stated goal.
Different techniques that are used in machine learning to solve the given problems are as follows:
- i.
-
Regression: In regression, input features are mapped to a continuous numerical value. The output value can be a number or a floating value.
-
- ii.
-
Classification: Similar to regression, in classification, the inputs are mapped to one of the output values, but here in the case of classification, the output values are discrete. In the case of binary classification, the values can be zero or one, while in the case of continuous values, the output consists of several classes.
-
- iii.
-
Clustering: In the case of clustering, the data are classified into several groups. These groups are created based on similarities in the behaviour or characteristics of the data present in the same group.
-
- iv.
-
Data Reduction: Data reduction is done on the dataset to reduce the number of features or records present in the dataset.
RWe
searchers can enhance the precision of the machine learning algorithms by lowering the number of rows that have some missing data or irrelevant data. By eliminating features that are irrelevant to the problem at hand,
researcherswe could enhance the accuracy of the machine learning algorithm, which is also called the feature-extraction process.
-
- v.
-
Anomaly Detection: In a given dataset, there can be some data that are misrepresented in the dataset taken into the consideration. Adding those data to the algorithm will reduce the accuracy of the algorithm, so the removal of those anomalous data becomes necessary from the data.
-
Some of the widely used machine learning algorithms in Industry 4.0 are discussed below:
- i.
-
Isolation Forest:-
The isolation Forest approach, initially suggested by Fei Tony Liu et al.
[15], is one of the most successful in anomaly identification. The isolation forest is a tree-based anomaly identification system based on decision tree methodology.
The isolation forest divides the data into different branches, depending on a randomly chosen threshold value. This branching procedure is repeated until each data point in the provided dataset is isolated. Once the data have been isolated, the isolation seeks to locate the data points that required the fewest iterations when compared to other elements in the dataset during the isolation process. Thus, as compared to other isolation-detection methods, this approach to finding outliers offers the Isolation Forest approach a distinct edge in detecting outliers explicitly. The unsupervised machine learning approach is used to classify the Isolation Forest.
In industry 4.0, Isolation Forest algorithms have been extensively used in the detection of anomaly behaviours in manufacturing operations. So, the possibility of detecting some unusual characteristics has been widely used in the manufacturing of automobiles and electrical appliances such as plugs and sockets.
- ii.
-
Decision Tree:-
Decision Tree was originally enhanced by Ross J Quinlan et al.
[16], who proposed the ID3 decision tree method, which used Entropy Information Gain. In the present period, Ross J Quinlan’s ID3 and Classification and Regression Tree (CART) contributions are frequently employed in offering data-related solutions.
A Decision Tree is a type of supervised machine learning that predicts based on the Gini Index value and the Entropy Information Gain. Decision Trees are commonly utilized in classification issues. The decision tree’s base is referred to as the root, and a number of nodes branch from these nodes, which are referred to as leaf nodes. The decision nodes branch based on the Gini index value. Finally, a leaf node emerges from the decision nodes and is in charge of the data’s final classification.
Being one of the oldest machine learning algorithms, the Decision Tree still finds its relevance in the data-driven manufacturing era of Industry 4.0. A decision tree has been widely used in predicting the number of defective engines that do not comply with global performance standards.
- iii.
-
K-Nearest Neighbour:-
K-Nearest Neighbour, proposed by Evelyn Fix et al.
[17], is one of the most ancient and successful machine learning algorithms. This algorithm is commonly used to provide current solutions to industrial difficulties. The K-Nearest Neighbour machine learning classification method is non-parametric and supervised. The K-Nearest Neighbour algorithm’s basic criterion is that it assigns the provided data point to the group of data that is closest to the data point. The distance between a data point and a data cluster is calculated using Euclidean distance or Manhattan distance.
One of the crucial machine learning algorithms for supervised learning of the data, K-Nearest Neighbour is used in smart factories for detecting inconsistencies in the manufacturing of hard disks. In the manufacturing of electronic appliances of switches and sockets, K-Nearest Neighbour is used in the detection of anomaly data and finding the root cause and reasons for its occurrence.
- iv.
-
Naive Bayes:-
Naive Bias is a probabilistic learning approach that is being employed in many data-driven solutions. Thomas Bayes was the first to invent the term “Nave Bayes” in 1702.
The word naive refers to the primary premise on which the algorithm is built, which is that each attribute in the provided data is completely independent and has no link between them. This implies that changing any variable in one feature does not influence the variable connected with the other feature. The Bayes rule, commonly known as conditional probability, is followed by Nave Bayes. In today’s era of data-driven solutions, Naive Bayes has been particularly used in detecting anomaly behaviour in the log files of hard-disk manufacturing.
- v.
-
Support Vector Machines:-
Cai et al.
[18] describe the support vector machine (SVM) algorithm. SVM is a supervised machine learning approach in which the classified data are projections in a hyperplane, which is an n-dimensional Euclidean space with an n-1 dimensional subset dividing the space into two disconnected halves. The data will be separated into multiple clusters by the decision boundary along either side. These decision boundaries are based on a variety of mathematical kernels, including the radial bias function, sigmoid, polynomial, nonlinear, linear, and so on.
The application of Support Vector Machine (SVM) has been extensive in finding irregular behaviour in hard-disk manufacturing, detecting defects on steel surfaces, visual industrial defect detections, and also finding the root cause of the given problem. This suggests that the Support Vector Machine is one of the most important machine learning algorithms in Industry 4.0.
- vi.
-
Random Forest:-
The author Leo Breiman et al.
[19] proposed a bagging-based technique for solving classification and non-classification issues without the need for any specific algorithm. This Random Forest algorithm employs supervised machine learning methods.
The input is initially segmented and fed to numerous decision trees concurrently in the Random Forest method. For classification issues, the majority output from all trees is evaluated, whereas the aggregate value is utilized for non-classification problems. This approach addresses the low bias and high variance issue noticed in decision tree algorithms since it is not dependent on any specific algorithm.
Random Forest is one such machine learning algorithm that has seen a wide variety of applications in various fields, ranging from healthcare to finance, housing, tourism, etc. Random Forest has also shown promising results in the field of manufacturing. In Random Forest, as no single tree dominates the output, its results are unbiased. In production plants, Random Forest has been utilized to analyse Internet of Things (IoT)-based sensors to monitor and control various manufacturing processes.
- vii.
-
Logistic Regression:-
David Cox et al.
[20] described Logistic Regression, which resulted in the solution of a classification issue. Logistic Regression (LR) applies supervised machine learning to a classification issue. The most significant advantage of LR is that it converts continuous data into a categorized output. This is accomplished by employing a sigmoid mathematical function, which determines a fixed threshold value between 0 and 1. All incoming variables are then identified depending on whether they are in the above or below cluster based on the threshold value.
Logistic Regression has been used in data-driven factories for observing the data from the sensors and predicting the machine’s operational life. This enables the operator to schedule systematic maintenance of the machines associated with the production process and prevent bottleneck time in production processes.
The following
Table 1 represents various algorithms that are used in the production processes.
Table 1. Various algorithms are used in production processes regarding machine learning.
| Authors |
Key Contributions |
Algorithms |
| Van Stein et al. [21] |
Anomaly detection in car manufacturing was done |
Global Local Outlier in Sub-Space (GLOSS) |
| David Muhr et al. [22] |
Predict the anomaly detection has been used to predict defective engines. |
Isolation Forest (I-Forest),
Partitioning Local Outlier Factor (PLOF),
One-Class SVM (OCSVM),
Local Outlier Factor (LOF) |
| Thanatarn Pattarakavin et al. [23] |
An inconsistency in the log data files from the hard disc manufacturing conditions was determined. |
Decision Tree,
K-Nearest Neighbour (k-NN),
Naïve Bayes,
Support Vector Machine (SVM) |
| Dorian Moldovan et al. [24] |
Machine learning based on sensor control in the manufacturing process was detected |
Gradient Boosted Trees (GBT),
Random Forest (RF),
Logistic Regression (LR) |
| Weizhong Yan et al. [25] |
Reducing operation and maintenance costs of gas turbine engines using anomaly detection was done |
One-class ELM (OCELM),
Isolation Forest (IForest),
One-class SVM (OCSVM),
Non-kernel based One-class ELM |
| Lehr et al. [26] |
Anomaly detection on the core failures of Die-Casting was detected |
Local Outlier Factor (LOF),
One-class SVM (OCSVM) |
| Kun Liu et al. [27] |
Defects on Steel surface were detected |
One-class SVM,
Generative Adversarial Networks (GANs) |
| Benjamin Staar et al. [28] |
Abnormalities on ImageNet data for surface inspection were detected |
Convolutional Neural Network (CNN) |
| Tamas Czimmermann er al [29] |
Visual defect detection for Industrial applications was detected |
Support Vector Machine (SVM),
k-Nearest Neighbour (k-NN) |
| Benjamin Staar et al. [30] |
CNN-based surface inspection in industrial applications was done |
Convolutional Neural Network (CNN) |
| Osama Abdelrahman et al. [12] |
Anomaly detection and root cause analysis on assembly line manufacturing was done |
Histogram-based Outlier Score (HBOS),
One-class SVM (OCSVM),
Isolation Forest (IForest),
k-Nearest Neighbour (k-NN),
Clustering-Based Approaches for Outlier Detection (CBLOF),
Local Outlier Factor (LOF),
Angle-based Outlier detection (ABOD) |
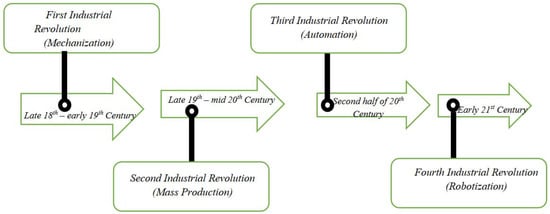
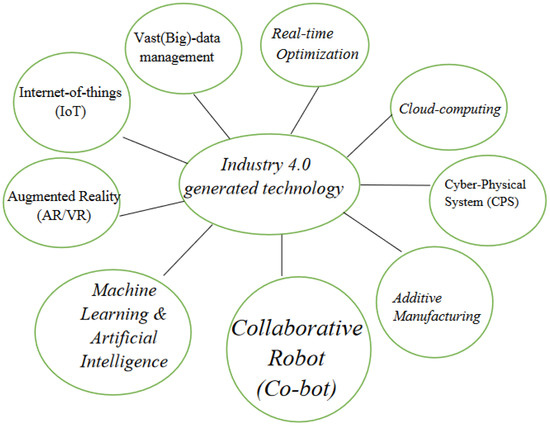
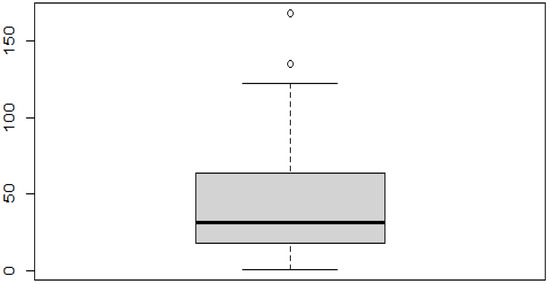 Figure 3. Outliers in a boxplot.
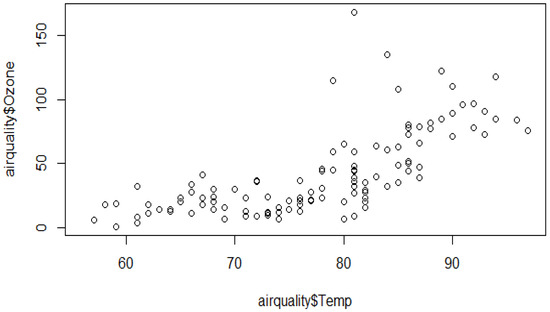 Figure 4. Outliers in a scatterplot.
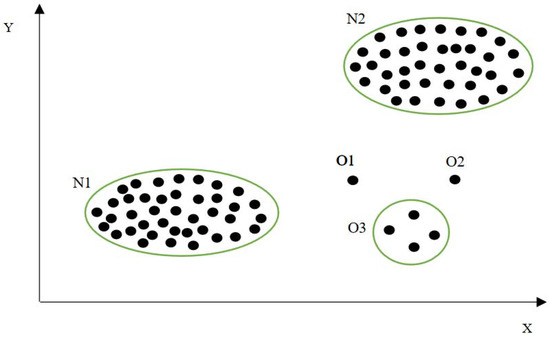 Figure 5. An example of an anomaly in 2D (two-dimensional space) where “O1” and “O2” are point anomalies, “N1” and “N2” are collective anomalies, and “O3” is a collective anomaly.
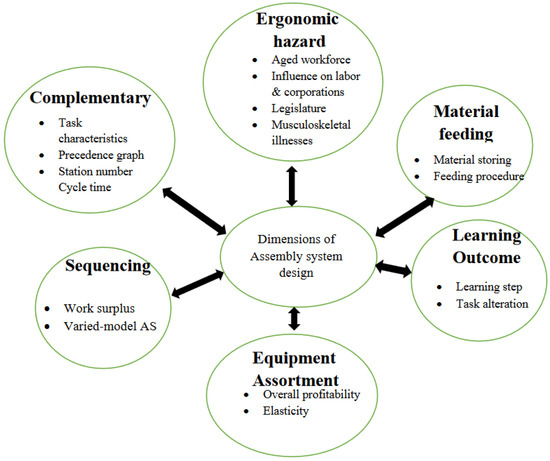 Figure 6. Dimensions of assembly system design.
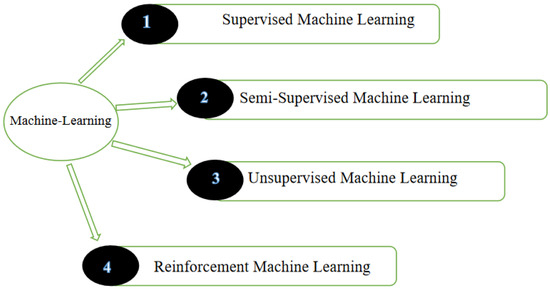 Figure 7. Classification of artificial intelligence and machine learning.