Thyroid cancer (TC) is the most common endocrine tumor. The genetic and epigenetic molecular alterations of TC have become more evident in recent years. However, a deeper understanding of the roles these molecular changes play in TC tumorigenesis and progression is essential in developing a successful treatment strategy and improving patients’ prognoses. Circular RNAs (circRNAs), a family of non-coding RNAs, have been implicated in several aspects of carcinogenesis in multiple cancers, including TC.
- circular RNAs
- circRNA
- diagnosis
- exosomal circRNAs
1. Introduction
2. Exosomal Circular RNAs in Thyroid Cancer
2.1. Diagnostic and Prognostic Utility of circRNAs in TC Patients
In the last decade, circRNAs have received much attention as key players in cancer development and progression, supporting their utility as biomarkers for cancer diagnosis or monitoring [14][42]. Because of their closed-loop structure, circRNAs have a high level of stability and resistance to degradation [15][16][20,35] and are thus likely to be promising biomarkers for PTC. Many circRNAs show increased expression levels in TC tissues and cell lines compared with adjacent non-cancer tissues, normal tissues, and normal cell lines and promote tumor development. The “circRNA pleckstrin and Sec7 domain containing 3 (circ_PSD3)” were aberrantly upregulated in PTC tumor tissues compared with adjacent normal tissues [17][109]. Overexpression of hsa_circ_0011290 in PTC compared with matched para-cancerous thyroid tissues was associated with advanced stage and poor prognosis of PTC [18][32]. Yao et al. demonstrated that overexpression of circ_0058124 in PTC tissues was associated with malignant features and poor outcomes in PTC patients in terms of advanced tumor-node-metastasis (TNM) stage, tumor size, LN metastasis, extrathyroidal extension, and distant metastasis [19][110]. Upregulation of circ_0005273 was reported in PTC tissues and was related to poor survival [20][64]. Overexpression of circ_BACH2 was reported in PTC tissues compared with adjacent tissues and was closely linked to larger tumor size, advanced TNM stage, lymph node metastasis, and shorter survival times [21][3]. Upregulated circ_0008274 was associated with poor PTC prognosis. Overexpression was associated with advanced TNM stage, tumor infiltration, and lymph node metastasis [22][23][111,112]. Similarly, circ_0067934 overexpression in TC tissues was associated with larger tumor size, higher AJCC stage, lymph node metastasis, and shorter survival times [24][113]. Wang et al. reported a lower level of circRNA itchy E3 ubiquitin-protein ligase (circ-ITCH) expressed in PTC tissues than in normal adjacent tissues [25][71]. In addition, circ_0137287 was downregulated in PTC tissues and related to aggressive clinical pathologic features in PTC patients, such as larger tumor size, advanced T stage, lymph node metastasis, and extrathyroidal extension [26][114].2.2. Circular RNAs Mediate Tumor Progression In Vivo and In Vitro
Emerging evidence suggests that some circRNAs play a significant role in tumor progression via multiple mechanisms, such as cell proliferation, differentiation, autophagy [27][28][119,120], EMT [29][30][31][32][56,78,121,122], immune modulation [33][51], apoptosis [26][114], vascularization [34][123], invasion, and metastasis [28][35][120,124]. The circRNAs–miRNA–mRNA axis can deregulate various cancer-related signaling pathways [36][37][29,125] (Figure 14).
23.2.1. Tumor-Suppression-Related circRNAs
23.2.2. Tumorigenesis-Related circRNAs
Other upregulated circRNAs are known to promote tumor growth (Table 3). CircTP53 is upregulated in TC cell lines, and this overexpression is associated with increased cancer cell proliferation and viability of TPC-1 cells. CircTP53 sponge miR-1233-3p thus increased “mouse double minute 2 (MDM2)” expression and downregulates the protein level of p53. Knockdown of circTP53 inhibited the expression of MDM2 and increased the protein level of p53 [43][30]. Jin and colleagues reported that circ_0004458 was overexpressed in PTC tissues and was associated with tumor size, invasion, lymphatic infiltration, and distal metastasis. Furthermore, expression levels were upregulated in different TC cells (BCPAP, TPC-1, K1, and IHH4) compared with NORI cells. In contrast, circ_0004458 silenced suppressed cell growth and enhanced apoptosis and cell cycle arrest in PTC cell lines in vitro, and hampered tumor growth in nude mice by inhibiting miR-885-5p and activating “Rac family small GTPase 1 (RAC1)” [44][116]. Circ-LDLR is overexpressed in PTC tissues/cells. This overexpression regulated Lipase H (LIPH) expression by sponging miR-195-5p. Knockdown of this circRNA suppressed PTC cells’ malignant behaviors and promoted PTC cell colony apoptosis in vivo [45][132]. Circ_ZFR was also implicated in thyroid cancer. It can sponge and silence miR-1261, allowing the activation of the transcriptional and immune response regulator C8orf4 and triggering cancer cell growth [46][31]. The role of circ_102171 in PTC tissues and cell lines (TPC-1, NPA87, KAT-5) has also been examined. Higher expression was shown in PTC samples. Circ_102171 accelerated PTC progression by modulating “CTNNB1P1-dependent beta-catenin” pathway activation. It can target CTNNBIP1 by suppressing the “β-catenin/TCF3/TCF4/LEF1” pathway to initiate the “Wnt/β-catenin” pathway and progression of PTC. CircRNA_102171 downregulation decreased cell proliferation/migration and triggered apoptosis in vivo and in vitro [47][27]. Circ_0067934 was highly expressed in TC cell lines. It acts as an oncogene, leading to the development of TC by promoting the EMT and “phosphatidylinositol 3-kinase (PI3K)/protein kinase B (AKT)” signaling pathways [24][113]. Knockdown of circ_0067934 inhibited cell proliferation/migration and invasion and enhanced apoptosis [31][121]. By analogy to cell lines, circ_0067934 RNA was also highly expressed in TC compared with adjacent non-cancer tissues. Its overexpression was associated with shorter patient survival. Silencing of this circRNA inhibited cell proliferation and triggered apoptosis, as evidenced by cell counting/Transwell migration assays. Western blot results suggested this knockdown also prevented EMT and PI3K/AKT-pathway-related protein synthesis [24][31][113,121]. CircRNA NRIP1 was upregulated in PTC tissues/cells, and its high levels were associated with advanced PTC stage. Silencing of this circRNA suppressed PTC cell proliferation/invasion while accelerating apoptosis. Overexpression of miR-195-5p inhibited proliferation/invasion capabilities, triggering apoptosis of PTC cell lines, and retained the growth of tumor xenografts. These functions were reversed following circRNA NRIP1 upregulation in PTC cells/tumor xenografts. Protein levels of p38/JAK2/STAT1 were markedly downregulated in miR-195-5p overexpressed PTC cells/tumor xenografts, whereas circRNA NRIP1 overexpression negated these impacts [48][65]. Circ_0079558 and MET were reported to be upregulated in PTC tissues/cell lines. This circRNA promoted PTC cell proliferation/migration and decreased apoptosis through the “miR-26b-5p/MET/AKT” axis [49][144]. Circ-TIAM1 induced cell migration of PTC via the “miR-646/heterogeneous ribonucleoprotein A1 (HNRNPA1)” axis [50][149]. Meanwhile, circNEURL4 downregulation in the PTC samples was directly associated with an unfavorable prognosis. Through binding to miR-1278, circNEURL4 might suppress cell proliferation/invasion of PTC in vivo and in vitro by indirectly increasing the expression of LATS1 [51][148]. Thus, this circRNA could have a clinical diagnostic and/or prognostic utility for PTC patients and a potential targeted therapeutic for PTC via the “miR-1278/LATS1” axis.2.3. Tumor-Cell-Derived Exosomal circRNAs
Exosomes are created in multivesicular endosomes and can be excreted from several cellular types. They are implicated in intercellular communication by transferring intracellular cargoes, such as proteins/nucleic acids [52][151]. RNA-seq analyses indicated that circRNAs were enriched in the exosomal compartment compared with the original cells [53][54][44,45], and a further study has identified that circRNA levels in exosomes could mirror their levels in cells/tissues [55][57]. Also, circRNAs sorting to exosomes may be controlled by changes in the levels of associated miRNA in producer cells, and the biological activities could be transferred to recipient cells. The abundance of tumor-derived serum “exosomal circRNAs (exo-circRNA)” in xenografted mice was correlated with tumor mass [53][44]. Exo-circRNAs could discriminate patients with colon cancer from healthy controls, suggesting the putative biological function of exosomal circRNAs [56][92]. Emerging evidence shows the excellent promise of exosomal circRNAs in tumor immunity regulation, patient outcome prediction, and drug efficacy evaluation [57][152].
2.4. Circular RNAs and Treatment Resistance
Since the sensitivity of tumors to chemotherapy can impact the survival/prognosis of patients, deciphering the mechanisms underlying drug resistance is critical. Dysregulation of circRNAs in cancer was found to induce chemoresistance. CircHIPK3 overexpression was found to promote gemcitabine (GEM) resistance in pancreatic cancer cells by targeting “RASSF1” through miR-330-5p and was proposed to be a novel biomarker in GEM-resistant PC [58][154]. Similarly, “circRNA Cdr1as” induced apoptosis and increased the cisplatin chemosensitivity of bladder cancer cells both in vitro and in vivo by upregulating “APAF1” expression through miR-1270 inhibition [59][155].2.5. Functional Enrichment Analysis for the Deregulated Markers
Prior publications have shown the role of deregulated circular RNAs in various hallmarks of cancer (Figure 26). Circ_0001018 activates cell proliferation by regulating the miR-338-3p/SOX4 axis [60][63]. Circ-ITCH and similar circRNAs promote cancer cells, evading antigrowth signals by enhancing other oncogenes, such as CBL [25][71]. CircEIF6/miR-144-3p promotes cancer cells by evading cell death via regulating cellular apoptosis or autophagy [27][119]. Circ-PSD3 limits the replicative potential of cancer cells and impedes apoptosis by regulating HEMGN [17][109]. Circ_0059354/miR-766-3p sustains angiogenesis through regulating ARFGEF1 [34][123]. CiRS-7/miR-7/EGFR [30][78], circ_0067934/PI3K/AKT [31][121], circ_0067934/miR-1301-3p/HMGB1 [61][146], and circ_0062389/miR-1179/HMGB1 [62][117] regulate the EMT process and thus cancer tissue invasion/metastasis.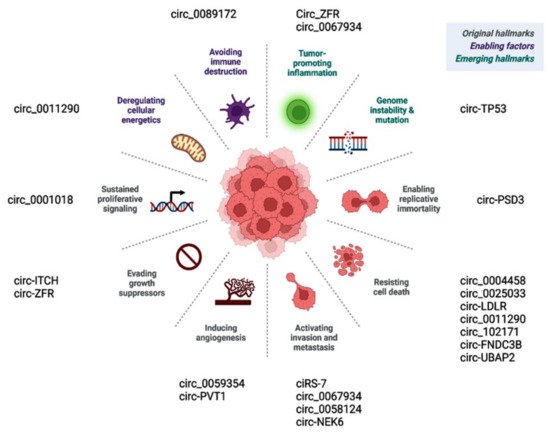
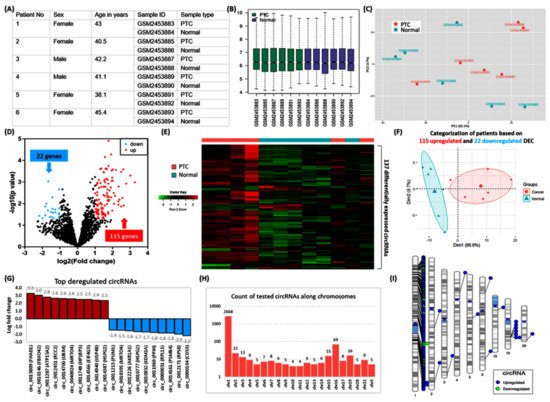
2.6. Genome-Wide Circular RNA Screening
2.6.1. Data Source and Processing
2.6.2. Identification of Differentially Expressed circRNAs (DEC)