EffObesicacy evaluation through a ty associated with a Western diet such as a high-fat diet (HFD) is a known risk factor for inflammatory bowel disease model using the gut (IBD) and colorectal cancer (CRC). In this study, we aimed to develop fecal microbiome of well-controlled obese rats using a risk data-based deep learning algorithms for the risk assessment of colorectal dis-eases. The effects of a HFD and a candidate food (Nypa fruticans, NF) on IBD and CRC risk reduction were also evaluated. Fecal microbiome data were obtained from 109 IBD patients, 111 CRC patients, and 395 healthy control (HC) subjects by 16S rDNA amplicon sequencing. IBD and CRC risk as-sessment prediction model based on clinics were then constructed by deep learning algorithms. Dietary effects were evaluated based on fecal microbiome data for inflammatory bowel disease and colorectal cancer is a useful food efficacy evaluation toolrom rats fed on a regular chow diet (RCD), HFD, and HFD plus ethanol extracts or water extracts of NF. There were significant differences in taxa when IBD and CRC were compared with HC. The diagnostic performance (area under curve, AUC) of the deep learning algorithm was 0.84 for IBD and 0.80 for CRC prediction. Based on the rat fecal microbiome data, IBD and CRC risks were increased in HFD-fed rats versus RCD-fed rats. Inter-estingly, in the HFD-induced obesity model, the IBD and CRC risk scores were significantly lowered by the administration of ethanol extracts of NF, but not by the administration of water extracts of NF. In conclusion, changes in the fecal microbiome of obesity by Western diet could be important risk factors for the development of IBD and CRC. The risk prediction model developed in this study could be used to evaluate dietary efficacy.
- Microbiology
- Metagenomics
- Dietary efficacy
- Risk assessment
- Fecal microbiome
- Nypa fruticans
- Gut disease
- 16S amplicon sequencing
- obesity
1. Introduction
Although oObesity is has been studied to influence chronic inflammatory diseases, the causal relationship between inflammatory diseases and the microbiome has not been clearly established. Based on the clinical microbiome information in colorectal disease, the association of than epidemic issue with no country reporting a decrease in prevalence during that period. A Westernized diet that includes a high-sucrose, high-fat diet is known to accelerate obesity model was confirmed, and furthermore, the potential as a food efficacy evaluation tool was confirmed based on the risk predic-related metabolic syndrome. In previous studies, overweight and obese people have been found to be more susceptible to chronic localized inflammation than those of normal weight.
Inflammation model.
1.1. Obesity and Inflammation
Forry bowel disea long time, obesity has become a problem for everyone as the western diet, which includes a diet high in sugar and high fat, has become common. The proportion of overweight adults in many countries hasse (IBD) is known to be an important risk determinant of developing colorectal cancer (CRC). IBD patients have been observed to have a defective epithelial barrier and increased in both developed and developing countries, and is a global epidemic with no country reporting a decrease in its incidence[1]. Itestinal permeability. Indeed, studies on human subjects have shown that the gut microbiome is different in patients wit has been found that obesity accelerates metabolic syndrome and leaves people more susceptible to chronic local inflammatio IBD from that in healthy control subjects. Metagenomics of gut microbiota in patients with IBD have al-so proven a role of the microbiome in the pathogen[2]. Thesis of meaIBD.
Ins that obesity changes the micro-environment at multiple levels throughout the body.
1.2. Microbiome Research Method
Ris study, the performance of classification for the host phenotypecently, as research on microbial communities has been developed, amplicon sequencing usingwas evaluated by creating a risk assessment model using machine learning techniques based on the stool 16S ribosomal RNA has been widely used iRNA metagenomic results of IBD, CRC patients, and healthy controls. In addition to microbial culture. Due to the advancement of technology, the cost of sequencing data has been reduced, and it has become possible to obtain microbiome information in various, by evaluating the performance of predicting disease risk in a rat model induced by a high-fat diet, an external performance assessment was conducted.
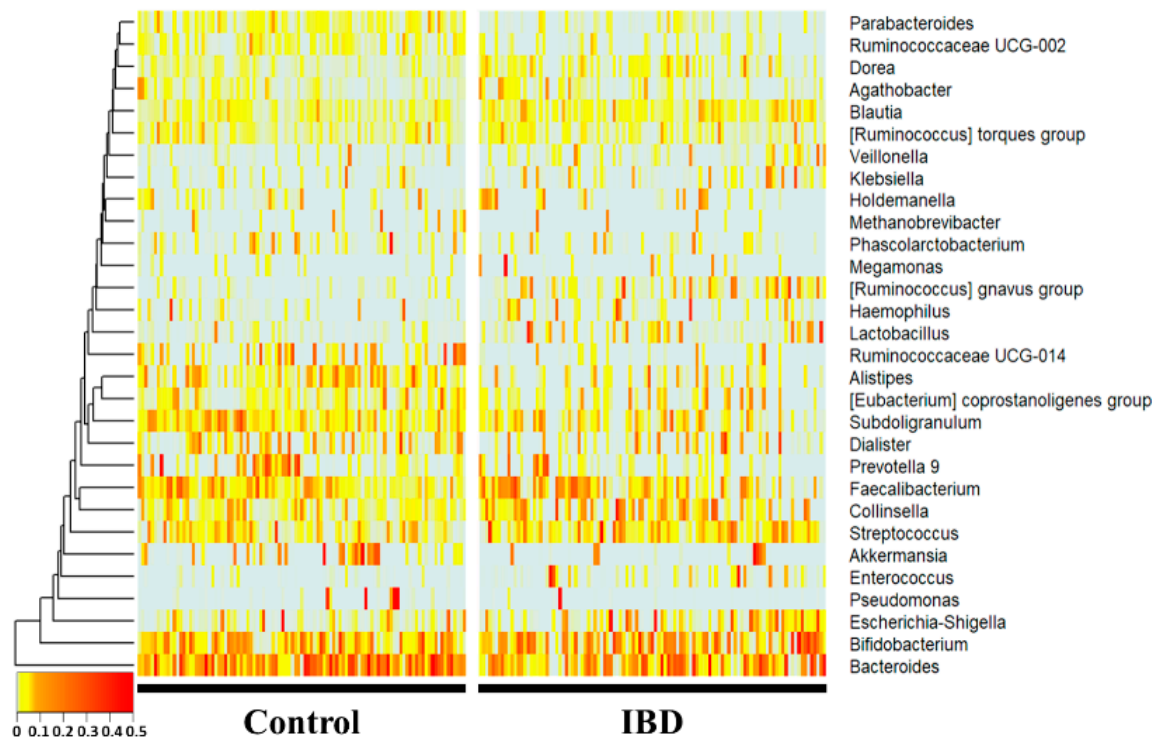
At thenvironments. However, since such microbiome information does not actually link a causal relationship, it does not provide a pathological cause, and there is a limitation that the interaction between microorganisms is difficult to interpret. Therefore, there is a need for a study to derive the genus level, Bacteroides, Subdoligranulum, Alistipes, Ruminococcaceae UCG-014, Parab-acteroides, and Ruminococcaceae UCG-002 were significantly more decreased in the IBD group (p < 0.01), whereas Collinsella, Blautia, [Ruminococcus] gnavus group, Lactobacillus, and Dorea were significance between the disease and the microbiome through a new approach.
1.3. Microbiome and Colorectal Disease
Inflammantly increased (p < 0.01) compared with the healthy control group. Notably, Enterococcus, [Ruminococcus] gnavus group, Lactory bowel disease is a well-known risk factor for the development of colorectal canceracillus, Ruminococcaceae UCG-014, Parabacteroides, Ruminococcaceae UCG-002, and it has been observed that there is a defect inAlistipes showed drastic fold changes (23-, 13-, 7-, 0.17-, 0.27-, 0.32-, and 0.34-fold, respectively).
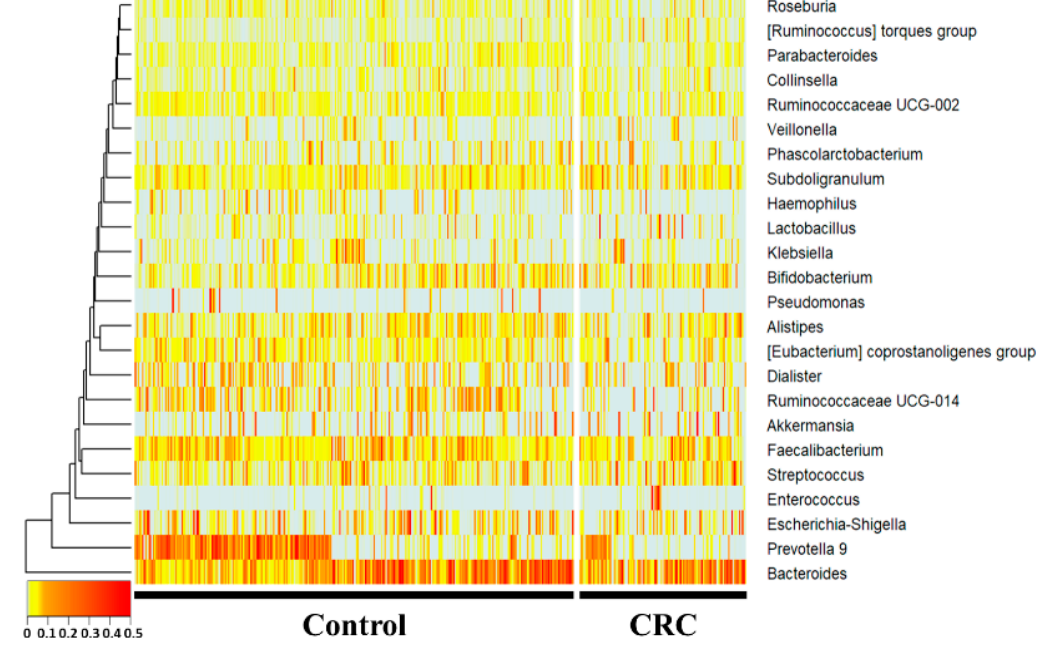
At the gepithelial barrier and increased intestinal permeability[3].nus level, Subdoligranulum and the [Ruminococcus] torques group were Clinical studies have reported that the gut microbiome of patients with inflammatory bowel disease and colorectal cancer differs from that of healthy controls, suggesting that the gut microbiome may be a contributing factor in the initiation and development of this cancer[4]creased, whereas Prevotella 9, Ruminococcaceae UCG-014, Haemophilus, and Parabacteroides were sig-nificantly decreased (p < 0.05) in the CRC group compared with the control group. Hae-mophilus, Ruminococcaceae UCG-014,[5].
1.4. Risk Assessment Model
Hum and microbiome studies have often been conducted to predict and understand composition and function through host sequencing and microbiome sequencing. Past studies have used t-tests, ANOVAsParabacteroides showed fold changes of 0.49-, 0.55-, and 0.59-fold, respectively. The [Ruminococcus] torques group, Subdoligranulum, and Prevotella 9 showed 1.7-, 1.4-, and Mann-Whitney U te0.3-fold changes, respectively.
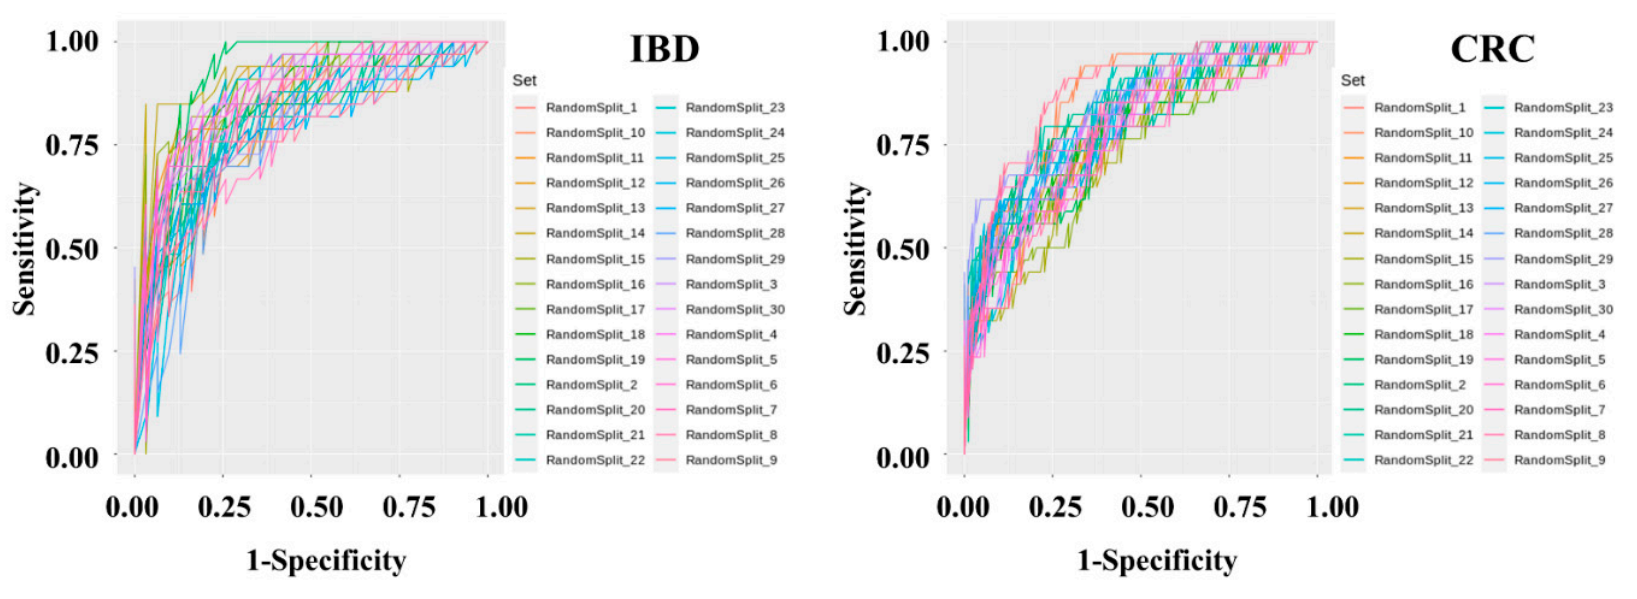
Diagnostsic to assess increases or decreases in abundance in microbiome, and logistic regression analysis was used to classify host phenotypes. Although these statistical methods are still useful, the use of historical statistical methods without determining the distribution of the microbiome data or themodel sets were developed to determine IBD and CRC risk by applying machine learning methods to the stool metagenomic data. The model performance was evaluated based on the resulting receiver operating characteristics of the disease has limit (ROC) curve. The AUC values from 30 iterations in modern data analysis. Additionally, public databases that of the test were plotted as a box plot . The disease classify microorganisms through the V3-V4 regions of 16S rRNA do not clearly distinguish between species and subspecies levels, and assigns loosely assignments at the genus level. Therefore, a recent research trend is interested in performing precise predictive analysis on microbiome data by utilizing machine learning algorithms. The merging of machine learning and controlled disease models is a new evaluation indicator in the interpretation of clinical information.
2. Microbiome Comparison and Classification Model
Tication performance of the IBD risk model was slightly better than that of the CRC risk model. In the IBD model, the mean AUC, standard deviation, minimum, and maximum of the model were 0.836, 0.0437, 0.7429, and 0.9277, respectively. In the CRC model, the mean AUC, standard deviation, minimum, and maximum of the model were 0.7982, 0.0359, 0.7757, and 0.9462, respectively. The specificity and sensitivity of the set showing the highest fecal microbiome pattern of inflammatory bowel disease and colorectal cancer was compared with the fecal microbiome of the normal group. A classificationAUC in the IBD model were 0.7419 and 0.9091, respectively. The specificity and sensitivity of the set showing the highest AUC in the CRC model was develere 0.8409 and 0.7059, respectively.
Top ded to classify normal people andtermine whether the colorectal disease groups through two diseaserisk assessment models (Figures 1, 2 and 3).
2.1. Microbiome of Healthy People and Patients with IBD
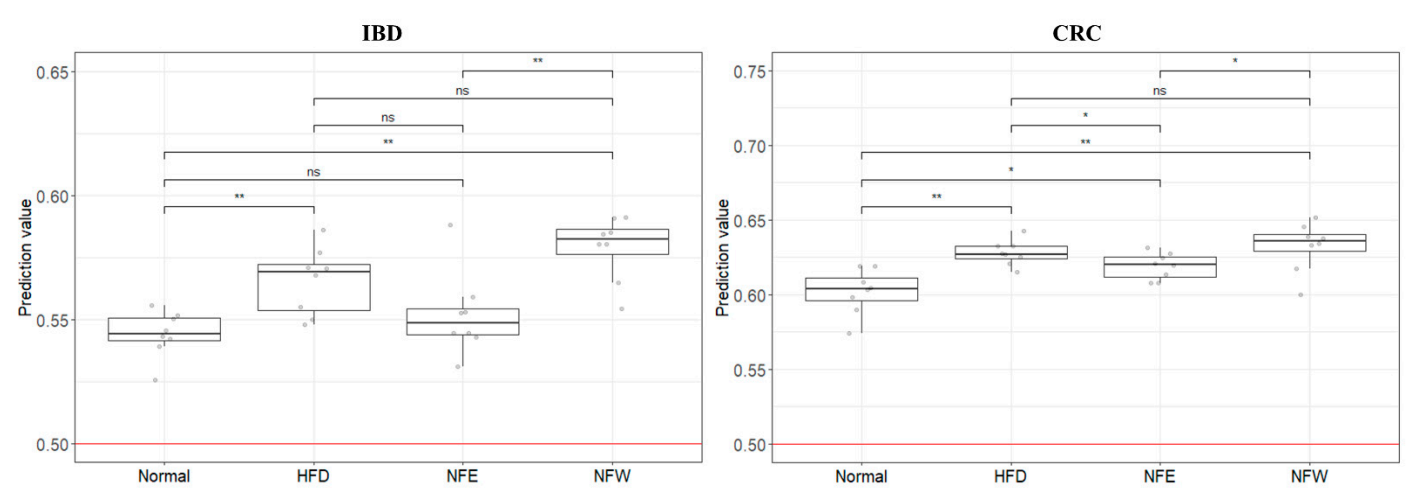
Figure 1. 16S ampli conuld sequencing was performed using feces of normal persons and inflammatory bowel disease patients. The comparison was performed at the genus level, which is easy to classify in the 16Sevaluate well in a rigorous animal model, we calculated predictive values by substituting the rat stool metagenome analysisdata from the normal diet, HFD, NFE, and each person was placed on the horizontal axis and compared with the normal person and the inflammatory bowel disease group using a heat map. Statistically,NFW groups. In both models for evaluating IBD and CRC risk, the predicted values in all groups were higher than 0.5, the standard for distinguishing the healthy Bacteroides, Subdoligranulum, Alistipes, Ruminococcaceae UCG-014, Parab-acteroides, and Ruminococcaceae UCG-002 were significaontly reduced in the IBDrol group from the patient group. Collinsella, Blautia, [Ruminococcus] gnavus group, Lactobacillus, and Dorea Howevere significantly, the predicted risk score was increased in the IBHFD group.
2.2. Microbiome of Healthy People and CRC Patients
Figure 2. 16S acomplicon sequencing was performed using feces of ared with the normal individuals and colorectal cancer patients. In the 16S metagenome analysis, comparisons were made at the genera level, which is easy to classify, and one person placed on the horizontal axis was compareddiet group. Among the groups taking NF with HFD, the NFW group tended to show increased risk scores while the NFE group tended to show a level lower than or similar to the normal person and colorectal cancer group using a heatmap. Statistically, Prevotella 9, Ruminococcaceae UCG-014, Haemophilus, a group. This trend Parabacteroideswas wemore significantly reducedconspicuously observed in the CRC group. Subdoligranulum anIBD model the [Ruminococcus] torques group were significantly increased in the CRC groupmodel.
2.3. Disease Risk Assessment Model Development
Figure 3. MetageInomic data preprocessing and machinethe present study, we constructed a deep learning were performed-based risk prediction model using feces of 395 normal persons, 109 IBD patients, and 111 al microbiome data from IBD and CRC patients. After data preprocessing, a classificationThe AUC value used as predictive performance of the deep learning algorithm of the model was produced using the Gradient Boosting Machine technique. To solve the problem of overfitting the classification model, cross-validation was applied in which the data were randomly split into training and test sets in a 7:3 ratio for 30 iterations.
3. Establishment of Dietary Assessment Using Controlled Animal Models
An 0.84 for IBD and 0.80 for CRC. Although the microbial profiles from normal individuals and patients with IBD are sometimes obtained and compared, this comparison is seldom performed to examine the performanimal modcel to which the classificas of these prediction model obtained based on the clinical microbiome can be applied was selected. Since obesity is fundamentally associated with chronic inflammatory s in controlled animal models. We further evaluated the risk by applying this predictive model for colonic diseases, a high-fat die to a controlled obese rat model was selected. The perennial plant, Nypa fruticans (NF) Wurmb, is native to coastal mangrove areas. Vinegar made by fermenting the sap of this plant is used as a folk remedy for diabetes in Malaysian society. Two types of Nypa fruticans ethanol extract (NFE) and Nypa fruticans water extract (NFW) were selected for the development of dietary evaluation (Figures 4, 5 and 6).
3.1. Animal Model Evaluation
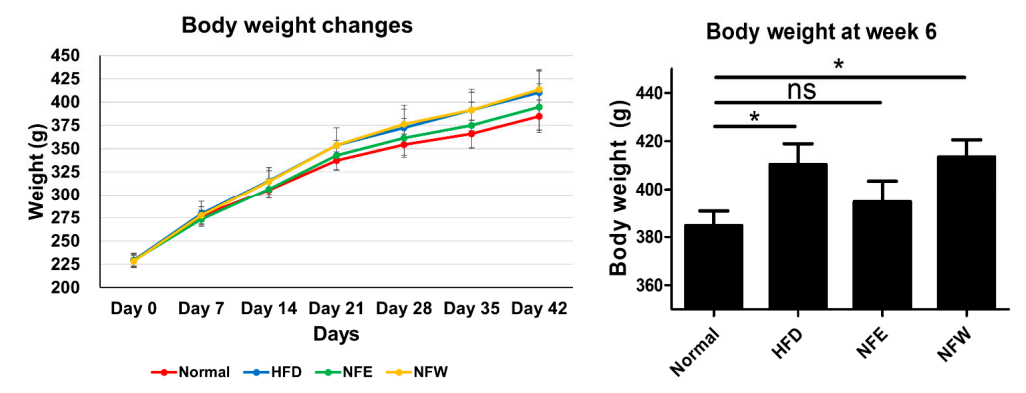
Figure 4. Ratrisk prediction model for IBD and CRC showed that the HFD group increased the risk compared to the regular diet group in the rat experiment. This is an important finding because it suggests that microbiome compositions winducere fedd by a high-fat diet for 6 weeks, and a normal control group was included. Weight change was confirmed by ingesting NFE and NFW at the same time as high-fat diet. The group that ate the hand those of IBD and CRC are shared. Additionally, we assessed whether the consumption of NF extract reduced the risk of CRC or IBD when consumed during a high-fat diet was found to have statistical significance compared to the control group. Our results confirmed the correlation that did not, and there was no statistical difference in body weight between the normal group and the NFE.
3.2. Microbiome Comparison between Groups
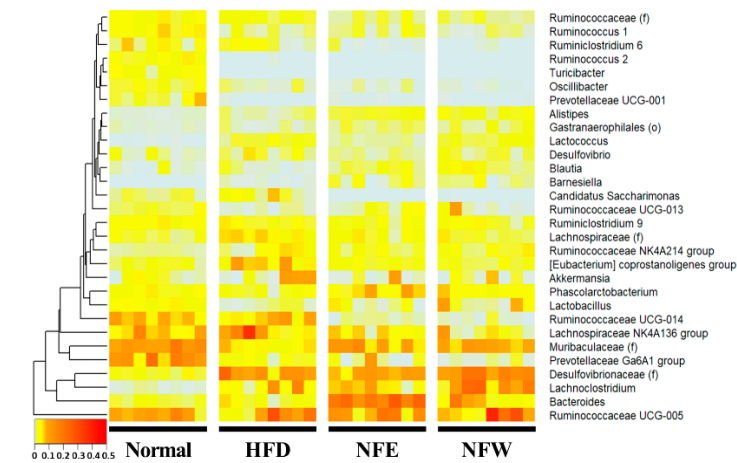
Figure 5. Metagenomthe intake of ethanol-extracted NFs could increase the microbiome composition, which analysis was performed by collecting feces from rats. Comparison at the genera level, which is easy to classify in the 16S metagenome analysis, was performed, and one rat placed on the horizontal axis was listed and the heatmap was used for normal, high-fat diet, NFE with high-fat diet, and NFW with high-fat diet. and compared. Statistically,lowers the IBD risk score. The novel approach suggests that disease risk prediction models can be established using well-controlled animal models and used as tools [Desulfovibrionaceae], Lachnoclostridium, [Eubacterium] coprostanoligenes group,to anssess d [Lachnospiraceae] wietare significantly reduced in the high-fat diet group.y efficacy through [Muribaculaceae], Prevotellaceae Ga6A1 group, Lactobacillus, [Ruminococca-ceae], Ruminococcus 1, chand Ruminococcaceae UCG-013 wgeres significantly increased in the high-fat diet groupin microbiome composition.
3.3. External Validation and Dietary Efficacy Evaluation
Figure 6. In oOurder to evaluate the performance of the two models (inflammatory bowel diseasestudy has some limitations. A risk assessment model, colorectal cancer model) developed using clinical metagenomic data, the was created based on a human-derived fecal microbiome data of rats prepared above was used andprofile. However, its risk assessment was applied to the GBM classificationa rat animal model. As a result, it was confirmed that the risk (0 = normal group, 1 = disease group) of the rat group fed a high-fat diet increased in bothIn addition, controlled clinical samples are extremely rare, making it an inevitable choice. Furthermore, although there are various models compared to the normal group. It can be confirmed that the score of the disease group (inflammatory bowel disease, colorectal cancer) was higher than thatof colitis (UC/CD) in murine, these methods are mainly postulated to chemically alter the microbial profile by disrupting the mucosal barrier and inducing inflammation of the normal group, and that the score decreased or increased through the intake of two types of food (NFE, NFW).
4. Food Efficacy Evaluation Using Clinical Microbiome Data
Altcolon via intestinal permeation by symbiotic microbiota . On the other hand, the HFD rat model, whougich typical studies compare microbiome data between groups through metagenome analysis,can induce chronic inflammation by natural intestinal flora, was selected as a controlled external verificalidation is not easy to contrmodel for our col[6]. To break this hurdle, clinical microbiome data are applied to well-controlled animal models. Although the application to the rat animalctal cancer and colitis risk assessment model. When the four groups were scored with the IBD and CRC risk assessment models based on the human-derivedidentical fecal microbiome profile is a limitation of the study, it is clear that it can be an accessible and more accessible evaluation model.
In composition data from obese rats, the IBD model distinguished each group better than the CRC model. This leaddition,s although it is an unclear attempt to apply tus to infer that the microbiome profile of inflammatory disease and cancer patients to a high-fat diet diseasinduced by the HFD model is relatively correlated with IBD. However, in the case of CRC, the obesity model appears to be an unsuitable model, it is important to try based on the inflammation-microbiome correlation. Nevertheless, the fact that the risk was higher in the disease group than in the normal group also disproves the influence of the microbiome for risk assessment. It is judged that the level of evaluation is not dramatic because cancer develops through a long process. If possible, controlled clinical samples would be more appropriate for risk assessment.
Itn can beconclusion, this study demonstrates that the risk prediction models generated based on the microbial profile of clinical disease can be externally validated by utilizing appropriate animal disease models. Furthermore, it suggestsThis study proves that a well-assessed microbiome profile-based risk assessmentprediction models are convenient tools can be a platform for rapidly estimating various indicators or markers or the efficacy of diets and foods.