Your browser does not fully support modern features. Please upgrade for a smoother experience.
Please note this is a comparison between Version 3 by Dean Liu and Version 2 by Dean Liu.
The 2D pose is estimated from the multi-view RGB videos using the DeepLabCut model. Subsequently, the dog joint position-based dataset is prepared based on a camera calibration and triangulation using the Anipose algorithm by predicting the 3D pose from the 2D pose of the dog in a multi-view RGB video extracted using the DeepLabCut model.
- companion animal
- companion dog
- pet tech
- artificial intelligence
- 3D pose estimation
1. Design Concept
It has been established that dogs generally circle when they are happy or before they lie down or defecate. Bodnariu [1] explained that circling, classified as a stereotypical activity in dogs, is also caused by stress. However, Kimberly [2] posited that owners tend to encourage circling in their dogs, as they find it interesting. Researchers regarded repetitive circling as a problematic behavior caused by stress and measured the number of circles performed, which served as an index for the level of stress.
Cafazzo et al. [3] studied the relationship between environmental factors and the stress levels of 97 dogs living in animal shelters. Despite the difficulty in identifying a significant relationship, Cafazzo et al. [3] eventually found that dog walks serve as a critical environmental factor that affects stress levels. The study results indicate that dogs who took regular walks showed lower levels of anxiety and a lower frequency of problematic behaviors.
The People’s Dispensary for Sick Animals (PDSA) reported that 19% of companion dogs were left alone for five or more hours on a typical day [4]. RSPCA found that more than 20% of companion dogs were left alone for a longer time than recommended and exhibited behaviors related to SAD [5]. TResearchis study ers determined a trend consisting of a change in the number of problematic behaviors in dogs compared to their history of such behaviors, time spent on walks, and time spent alone, which serves as stress-related environmental information that should be provided for analysis. The analytic processes were as follows.
When information regarding the walk and isolation times of the companion dogs was input into the proposed mobile application, it calculated a stress index and identified stress-related environmental information based on problematic behaviors provided via cameras.
2. Creation of the Dataset
TResearchis study ers proposed a mobile app that estimates the three-dimensional poses of companion dogs based on single-view RGB images and uses them to identify the dogs’ behaviors to support their stress care. To this end, the mobile app requires datasets of single-view RGB images and 3D poses. However, the motion capture of an object needs to be performed to measure the 3D poses. Motion capture is the process of recording, in a digital form, the motion of an object through sensors attached to the object’s body. Sung et al. [6] reported that certain motions of animals cannot be tracked via motion capture owing to the difficulty in controlling these animals. Furthermore, the motion capture of animals tends to be expensive because of the need for trainers and well-trained animals. Humans do not show obvious physical differences by race or gender, whereas dogs exhibit significant differences in hair colors, frame, and appearance depending on their breed. For this reason, the acquisition of 3D pose data for dogs of all breeds is extremely costly.
All the videos for the datasets for training the artificial intelligence models were captured firsthand. Four mobile devices were used for the multi-view video shooting: an Apple iPhone 6, an Apple iPhone 8, a Samsung Galaxy Note 8, and a Samsung Galaxy A7. The canine behaviors were recorded as 30-min videos, and the number of frames that could be used as a dataset was 7189 for each view. The dog in the video performed five movements: walk, sit, jump, stand, and track.
2.1. 2D Dog-Pose Estimation
TResearchis study uers used DeepLabCut [7], an AI algorithm that provides efficient solutions for estimating the 2D poses of animals without markers, to estimate the poses of companion dogs based on multi-view RGB images. The proposed algorithm facilitates transfer learning based on deep neural networks and can track the location of joints from a training dataset of only 50 to 200 frames. As the algorithm’s Graphic User Interface (GUI) of this algorithm provides functions for the AI model’s formation, verification, and result analysis, users can conveniently estimate the 2D poses of animals using this algorithm. The GUI partially extracts frames to form a training dataset from RGB videos of dogs, saves the joint locations, and generates a DeepLabCut model to estimate the 2D poses of the dogs based on entire frames of the RGB videos. Figure 1 shows the results of predicting the 2D poses of dogs.
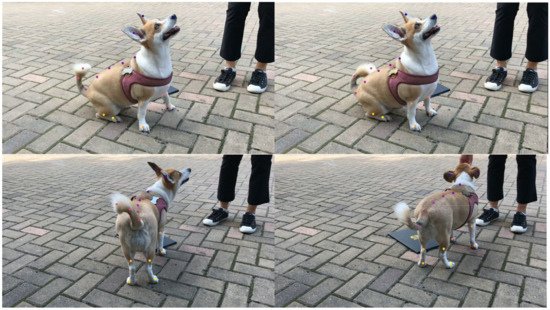
Figure 1. 2D dog-pose estimation by DeepLabCut.
2.2. Multi-View 3D Dog-Pose Estimation
Anipose [8] is a utility derived from DeepLabCut that estimates the 3D poses of an object from the 2D poses estimated by DeepLabCut. The 3D dog pose-estimation method requires multi-view RGB images, 2D poses of the dogs, and multi-view camera calibration. Triangulation can then be applied to the 2D poses, and multi-view camera calibration then estimates the poses in three dimensions.
Kaustubh et al. [9] state that camera calibration is the process of estimating a parameter that defines a conversion relationship between the world coordinate and the image coordinate. In the study, ChArUco Board, which combines ArUco Marker and Chessboard, was used for camera calibration. A ChArUco Board printed at an A4 size was held carefully without wrinkling or repositioning so that it could be observed clearly from all the cameras. The video was captured over approximately 5 min. Feature points were extracted from the chessboard video sequence to obtain the camera parameter.
The 2D poses of the dogs and the multi-view camera calibration results were analyzed based on triangulation to estimate the 3D poses. The triangulation technique uses properties of triangles to identify the coordinates and distance of a certain point. The coordinates between the multi-view RGB images were identified and used, along with the camera parameter, to calculate information pertaining to the target object’s 3D motion. Figure 2 shows the result of a 2D dog-pose estimation from four perspectives. Figure 3 displays the estimation result calculated by triangulation.
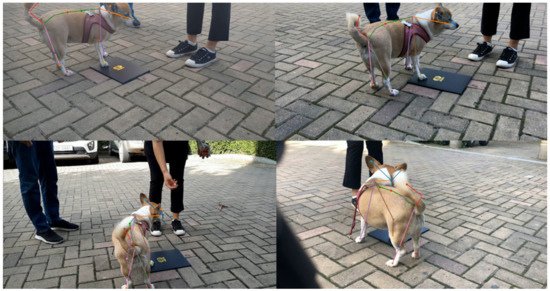
Figure 2. 2D dog-pose estimation based on multi-view RGB images.
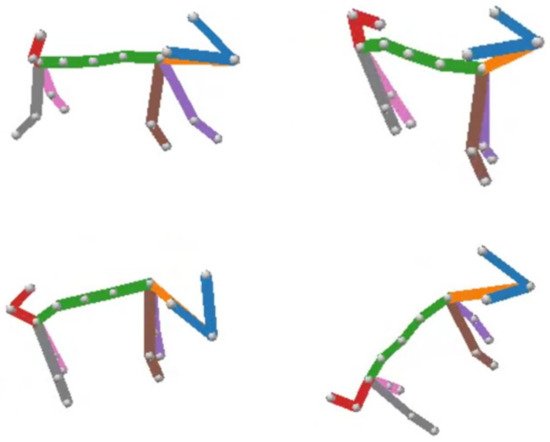
Figure 3. 3D dog-pose estimation by Anipose.
3. Identification of Problematic Behaviors in Dogs
3.1. Single-View 3D Dog-Pose Estimation
VideoPose3D [10] is an AI algorithm developed by Pavllo et al. that facilitates 3D human pose estimation based on single-view RGB images of people. This algorithm trains an AI model that derives 3D poses from 2D poses estimated from single-view RGB images. VideoPose3D can estimate the 3D poses of dogs only when a dataset of human joints is adjusted to match a dataset of dog joints. To satisfy this requirement, tresearchis study ers adjusted the values of joints_left, joints_right, and parent to be appropriate for the dog joints in the category of Class Skeleton, which represents the joints of an object.
5760 3D coordinate triplets out of an overall 7198-coordinate triplet set were used as the training dataset. The remaining 1438 coordinate triplets were used as the evaluation dataset. The first training dataset was analyzed based on the 3D poses of dogs and multi-view camera calibration to form a second dataset that includes 2D coordinate pairs. Specifically, the original training dataset was analyzed based on the results of the multi-view camera calibration to generate 5760 corresponding 2D coordinate pairs. In this process, a rotation vector obtained by multi-view camera calibration was converted to a quaternion rotation vector. The second training dataset was created using metadata, which included 2D coordinates, the number of joints, and keypoint symmetry.
Detectron2 [11] is a platform for object detection and semantic segmentation based on PyTorch, which was developed by Meta’s research team. This platform performs object detection based on a pre-trained model loaded to estimate the 2D poses of the target object. Figure 4 shows the detection process of a dog based on a single-view RGB image by using the pre-trained model and performing 2D pose estimation using the DeepLabCut model. Figure 5a shows a 2D pose of the target dog estimated by the DeepLabCut model from a single-view RGB video, while Figure 4b shows the 3D pose of the dog estimated from the VideoPose3D model.
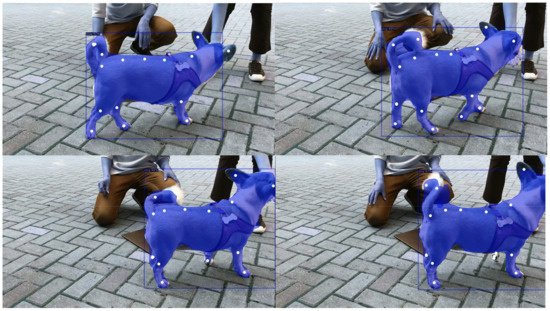
Figure 4. Dog Detection and 2D Pose Estimation.
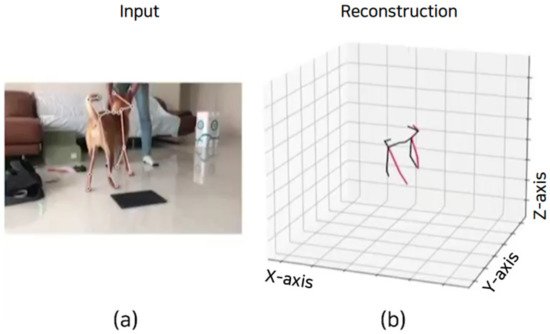
Figure 5. 3D dog-pose estimation based on single-view RGB image of dog.
While training the Videopose3D model, the number of epochs that showed the most optimal performance was 60, the batch-size was 1024, and the learning rate was 0.001.
3.2. Recognition of Problematic Behaviors
DD-NET [12], developed by Yang et al., is an AI algorithm used to recognize the behaviors of dogs through correlations with their 3D poses. AI models that recognize behaviors of an object based on 3D pose estimation are generally time- and resource-intensive. To overcome this challenge, the DD-Net algorithm employs one-dimensional CNNs and a simplified network structure. Researchers found that the lightweight property of DD-Net is appropriate for use within a mobile app. Therefore, tresearchis study ers adopted DD-Net to recognize dogs’ behaviors.
Researchers labeled the behaviors of dogs by dividing single-view RGB videos, which contain 3D motion, into several frames, and generated clips that include the labelled behaviors as a dataset for DD-Net. However, each clip contained a different number of frames. The labels used to classify dog behaviors include five common behaviors (walk, sit, jump, stand, and track) and one problematic behavior (circling). When a single-view RGB video was input, the 3D poses of the dog were estimated by frame. Subsequently, each frame was divided into 30 sub-frames to enable DD-Net to recognize specific behaviors of the dog. Figure 6 shows the image captured from a result derived by DD-Net. When the dog in the video performed circling, the number of circles was recorded.
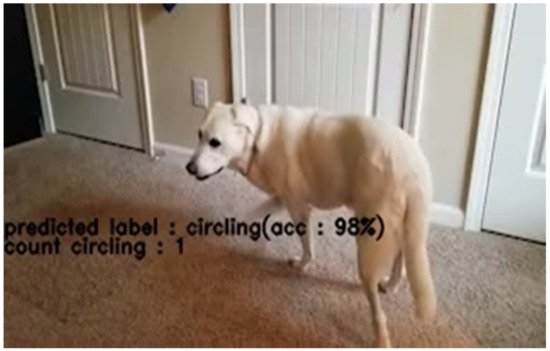
Figure 6. Measurement of circling of a dog based on 3D poses of the dog performed by DD-Net.
4. Prototype of the Mobile App
The mobile app was implemented using Android Studio and can be run on Android-based mobile devices. The actual appearance of the mobile app is shown in Figure 7.
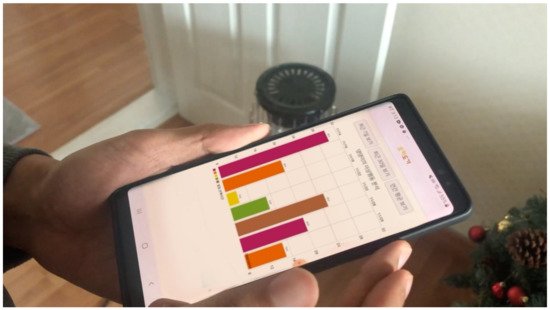
Figure 7. Final prototype of the mobile app.
Figure 8 shows the entire wireframe of the mobile app developed. When the user launches the mobile app, a Login page is displayed, as shown in Figure 8. This page allows the user to sign in with their Google account. Upon successful login, the mobile app displays the User Profile page, where the user can input their member information, including their dog’s name, breed, and birth date.
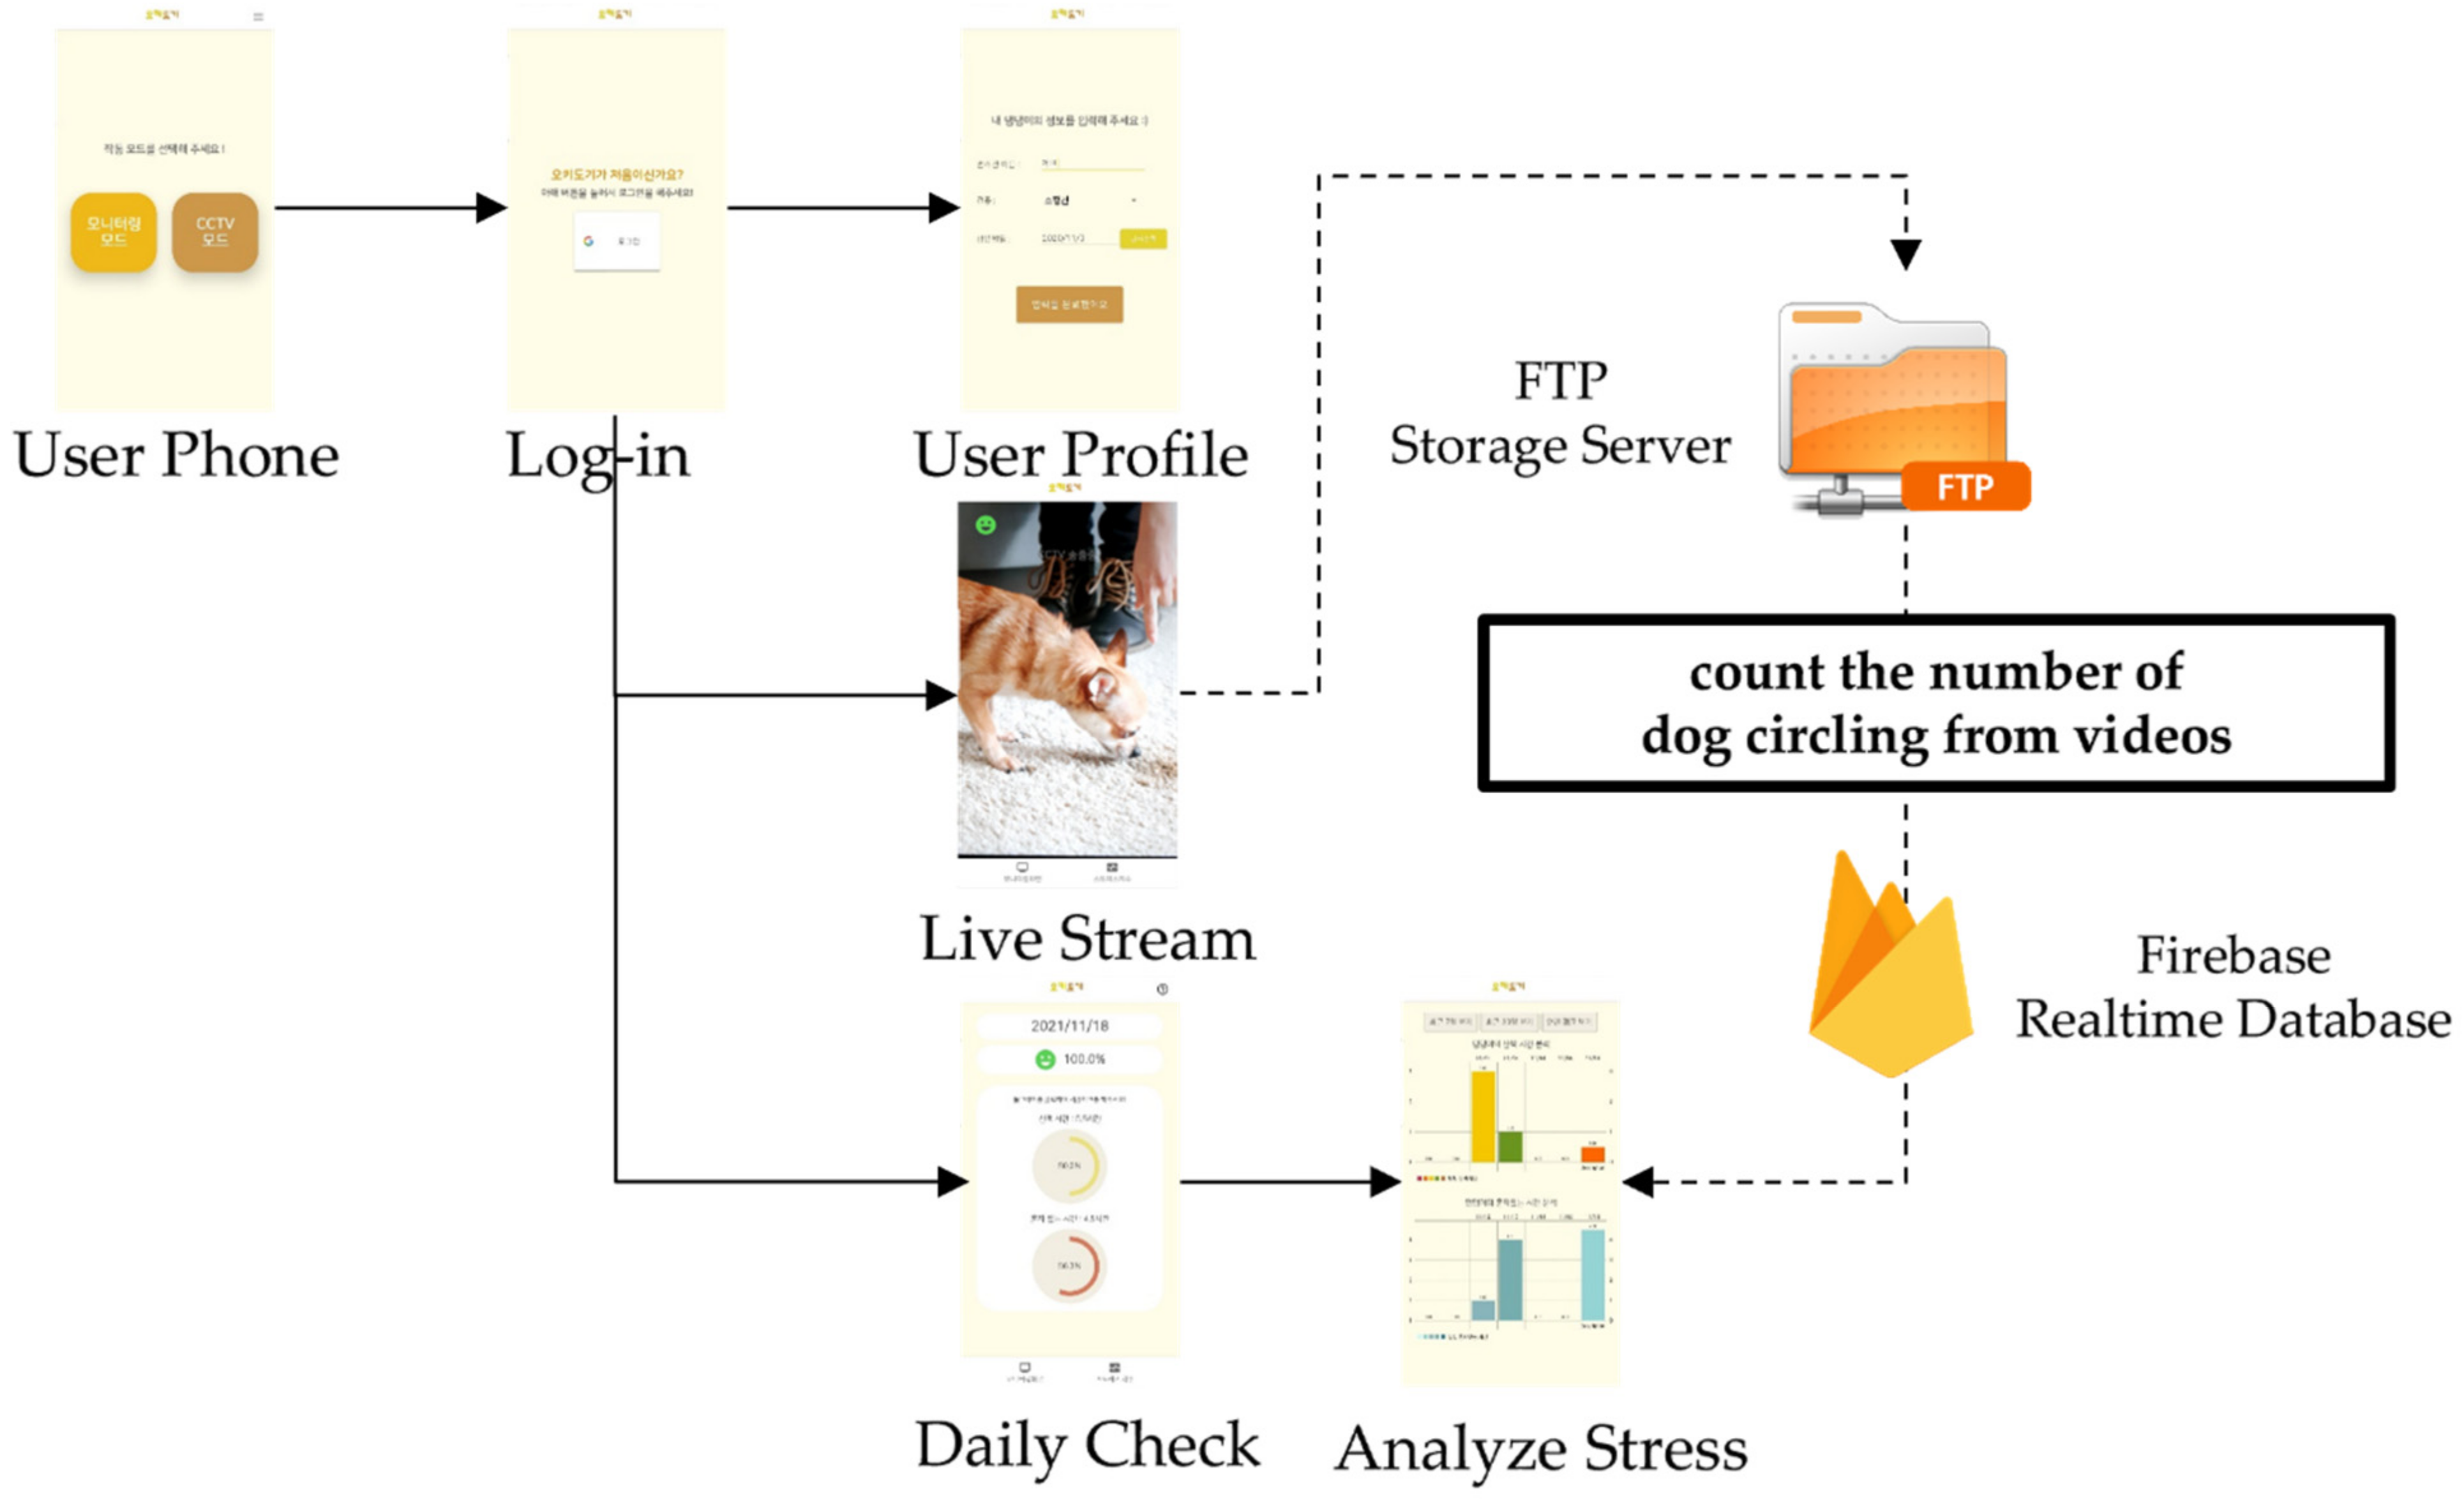
Figure 8. Wireframe of the mobile app.
As shown in Figure 9a, when the user selects the Live Stream menu shown in Figure 8, the mobile app stores a video recorded on a video-recording page in a File-Transfer Protocol storage server based on a 15-min unit. The storage server measures the number of problematic behaviors performed by the dog shown in the video and calculates the dog’s stress index. The stress index is then transmitted to the user’s smartphone.
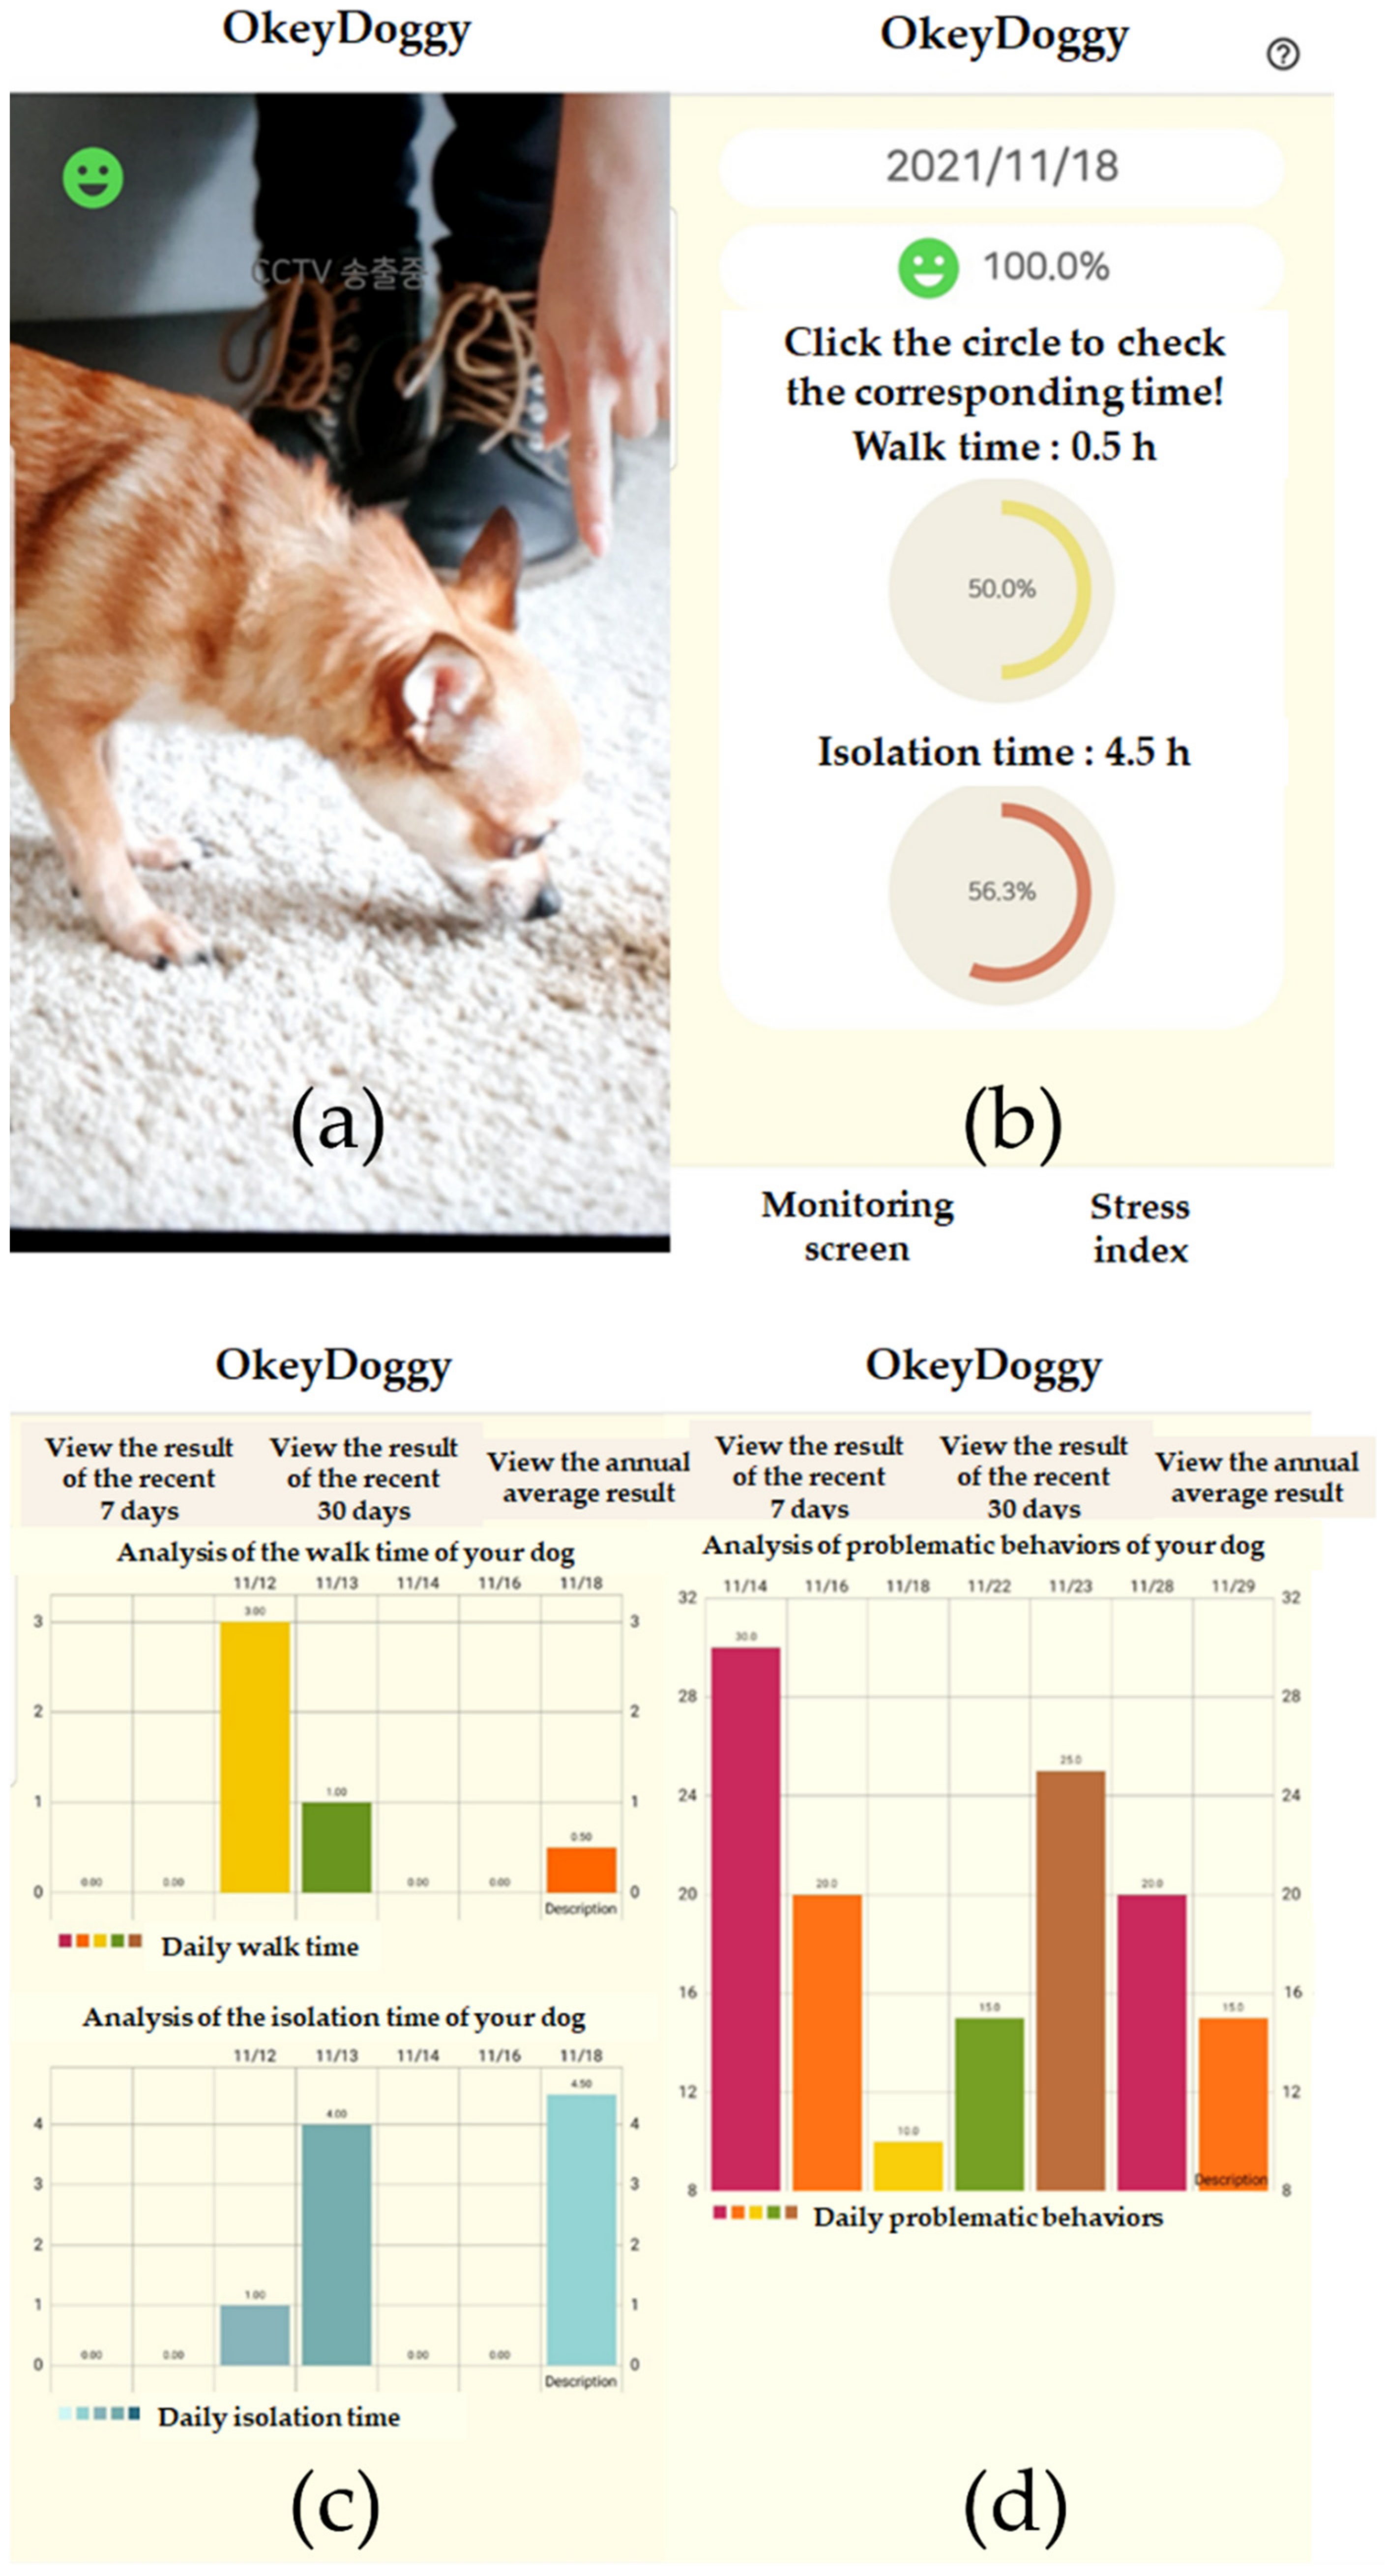
Figure 9. Screens of the final prototype of the mobile app. (a) shows the Live Stream shown in the mobile app. (b) shows the dog’s stress index and stress-related environmental information. (c) shows the accumulated data recorded in the form of a bar graph. (d) shows the number of problematic behaviors recorded in the form of a bar graph.
The stress index can be formulated as:
Dog’s stress index = ((Number of problem behaviors today – Number of problem behaviors on the previous day)/Number of problem behaviors on the previous day) × 100
By touching the stress index button on the navigation bar, the user can enter the Daily Check menu shown in Figure 8. The user can also access their dog’s stress index and stress-related environmental information on the page shown in Figure 9b. They can record the walking and isolation times of their dog on a nightly basis, and the recorded data will accumulate. By accessing the Analyze Stress menu shown in Figure 8, the user can examine the accumulated data over the most recent seven days, the most recent 30 days, and the annual average, as shown in Figure 9c.
For the stress index, the change in the number of problematic behaviors compared to that on the previous day is represented by a percentage. When the user touches the stress index, the mobile app displays the number of problematic behaviors recorded in the form of a bar graph, as shown in Figure 9d.
References
- Bodnariu, A.L.I.N.A. Indicators of stress and stress assessment in dogs. Lucr. Stiint. Med. Vet. 2008, 41, 20–26.
- Kimberly, C. What Does It Mean When a Puppy Keeps Walking in Circles? Available online: https://dogcare.dailypuppy.com/mean-puppy-keeps-walking-circles-3320.html (accessed on 2 May 2022).
- Cafazzo, S.; Maragliano, L.; Bonanni, R.; Scholl, F.; Guarducci, M.; Scarcella, R.; Di Paolo, M.; Pontier, D.; Lai, O.; Carlevaro, F.; et al. Behavioural and physiological indi-cators of shelter dogs’ welfare: Reflections on the no-kill policy on free-ranging dogs in Italy revisited on the basis of 15years of implementation. Physiol. Behav. 2014, 133, 223–229.
- PDSA (People’s Dispensary for Sick Animals). Animal Wellbeing Report 2017; PDSA: Cape Town, South Africa, 2017; p. 4.
- RSPCA (Royal Society for the Prevention of Cruelty to Animals). Being #DogKind: How in Tune Are We with the Needs of Our Canine Companions? Royal Society for the Prevention of Cruelty to Animals: London, UK, 2018; p. 13.
- Sung, M.K.; Jeong, I.K. Motion Synthesis Method. Available online: https://patents.justia.com/patent/20100156912 (accessed on 2 May 2022).
- Mathis, A.; Mamidanna, P.; Cury, K.M.; Abe, T.; Murthy, V.N.; Mathis, M.W.; Bethge, M. DeepLabCut: Markerless pose estimation of user-defined body parts with deep learning. Nat. Neurosci. 2018, 21, 1281–1289.
- Karashchuk, P.; Rupp, K.L.; Dickinson, E.S.; Walling-Bell, S.; Sanders, E.; Azim, E.; Brunton, B.W.; Tuthill, J.C. Anipose: A toolkit for robust markerless 3D pose estimation. Cell Rep. 2021, 36, 109730.
- Kaustubh, S.; Satya, M. Camera Calibration Using OpenCV. Available online: https://learnopencv.com/camera-calibration-using-opencv (accessed on 2 May 2022).
- Pavllo, D.; Feichtenhofer, C.; Grangier, D.; Auli, M. 3D human pose estimation in video with temporal convolutions and semi-supervised training. In Proceedings of the IEEE/CVF Conference on Computer Vision and Pattern Recognition, Salt Lake City, UT, USA, 18–23 June 2018.
- Wu, Y.; Kirillov, A.; Massa, F.; Yen, W.; Lo, R.G. Detectron2. Available online: https://github.com/facebookresearch (accessed on 14 January 2021).
- Yang, F.; Wu, Y.; Sakti, S.; Nakamura, S. Make Skeleton-based Action Recognition Model Smaller, Faster and Better. In Proceedings of the ACM Multimedia Asia, New York, NY, USA, 15–18 December 2019.
More
