2. CO2 Emission Factors by Transport Mode
Emission factors are often grouped by transport mode, despite the relevant differences that exist within each mode in terms of technology, trip distances, energy source and other aspects. Th
is se
results ction presents a literature review of the main factors influencing emissions for each transport mode. The results are based on analysis of multiple literature sources, including research papers, reports from research institutions and industry analyses
[5][6][8][9][10][11][12][13][14][15][16][17][18][19][20][21][22][23][24][25][26][27][28][29][30][31][32][33][34][35][36][37][38][39][40][41][42][43][44][45][46][47][48][49][5,6,12,13,14,15,16,17,18,19,20,21,22,23,24,25,26,27,28,29,30,31,32,33,34,35,36,37,38,39,40,41,42,43,44,45,46,47,48,49,50,51,52,53].
The results of
theour analysis are summarized in
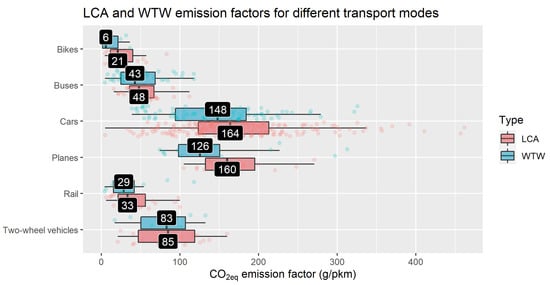
Figure 1, showing boxplots of both LCA and WTW emission factors for different transport modes. The chart is based on almost 500 different data points, and it aims to report median results while also highlighting the variability of the emission factors for each transport mode.
Figure 1. Distribution of LCA emission factors by mode.
Such variability is particularly relevant for emission factors of passenger cars, since the number of available studies is much larger than for other transport modes. Moreover, as
researchwe
rs explain later, the wide range of results is a consequence of the large number of different technologies that are available.
When comparing LCA and WTW emission factors in
Figure 1, it is important to remember that some studies report both values, while in other cases, only WTW or LCA values are available. For this reason, some of the distributions may not be directly comparable, especially those relying on a limited number of studies.
The next sections report additional information on the emission factors of these six groups of transport modes. A very limited number of studies include LCA emission factors for ferries
[6][46][6,50], which were thus excluded from this analysis, also due to their limited importance for passenger transport (while their importance is significant for freight transport).
2.1. Cars
The car is the transport mode that is mostly addressed in the literature when computing emission factors, both for its dominance in current global mobility demand and for the wide range of available technologies. At the same time, as already presented in
Figure 1, the emission factors that are calculated for cars show significant variability due to a number of factors that must be properly understood to choose the right indicator for each specific context.
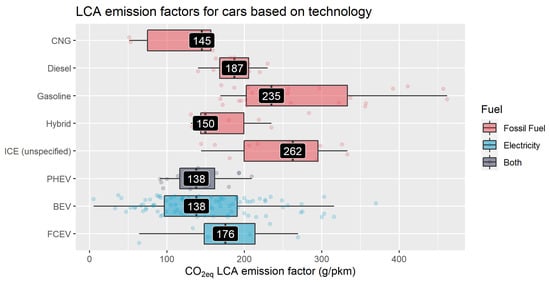
Figure 2 shows LCA emission factors for cars based on different technologies, differentiated as fossil fuel-based (CNG, diesel, gasoline, hybrid and LPG), electricity-driven (BEVs and FCEVs) or both (PHEV). While the boxplots show total LCA emissions, it is important to remember that the impact of internal combustion engine (ICE) cars is mostly due to direct (tailpipe) emissions, whereas electricity-driven vehicles have no direct emissions, and their impact is mostly related to indirect emissions for the generation of electricity.
Figure 2. Distribution of LCA emission factors for private cars.
Figure 2 shows that median values for traditional fossil-based technologies are generally higher than those of electrified options, although in many cases, the ranges of the values across technologies may overlap. Wider ranges are also seen for gasoline cars and BEVs due to the fact that these two technologies are the ones that are most often compared in the LCA studies that were considered for this work (with 15% and 45%, respectively, of the total data points in this chart).
The variability of fossil-based emission factors is due to hypotheses on vehicle and engine size (with American studies usually considering larger vehicles than European studies), occupancy, vehicle age, annual driving range and lifetime. As seen in the plot, while the median value for gasoline cars is 235 g/pkm, the range spans from 169 to 462 g/pkm (−28% to +97% of the median). Diesel cars show both a lower median value and lower variability thanks to fewer cases considered and due to the fact that American cars, which are generally bigger, only run on gasoline, while diesel is mostly used in other areas (including Europe).
The range for BEVs varies from 5 to 370 g/pkm, corresponding to −96% to +191% of the median value of 138 g/km. In addition to aforementioned aspects, such significant variability for BEVs is strongly related to the electricity generation considered in the analysis.
The chart also shows that PHEV cars have median values that are comparable to those of BEVs (although the range is much narrower, 91 to 209 g/pkm); however, this figure is based on only 18 data points, while BEV emission factors come from 99 data points. On the one hand, the low LCA emissions of PHEVs can be explained by the lessened impact of battery manufacturing, which is smaller than for BEVs; on the other hand, it can also be caused by optimistic estimates of the range driven using electricity vs. fossil fuels. Recent research
[50][54] shows that real-world fuel consumption of PHEVs is often much higher than the values expected from tests, suggesting users cover less distance on electricity and more on traditional fuel than forecast. This aspect should be carefully considered when assessing the potential benefits of PHEVs.
Finally, the median LCA emission factor from FCEVs is 176 g/pkm (range 64 to 269 g/km, based on eight data points), suggesting higher a impact than BEVs due to the less-efficient supply chain for the generation and storage of hydrogen
[51][55]. Further, while the global stock of BEVs and PHEVs surpassed 16 million in 2021
[52][56], the global FCEV fleet remains limited to around 50 thousands units.
In
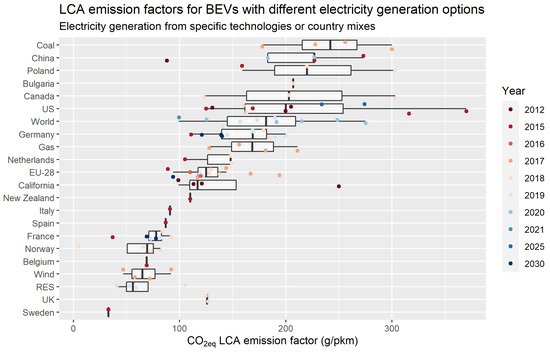
Figure 3, specific focus is presented on BEVs due to their importance in the literature and their potential role for the decarbonization of transportation. The use of reliable metrics to estimate their potential benefits is paramount for effective and reliable strategies and policies.
Figure 3 shows the effect of different electricity generation options on the LCA emission factors of BEVs, together with the (minor) contribution of different years considered in the analysis (with a general decarbonization trend over the years that is noticeable in studies).
Figure 3. Distribution of LCA emission factors for BEVs with different electricity generation options.
Nevertheless, it is interesting to note that the electricity mix and the year do not explain the whole variability, which means there are still other factors at play (as mentioned above for traditional cars). For BEVs, manufacturing of batteries is an important fraction of the total life-cycle impact, and thus, the electricity mix considered for battery manufacturing may represent an additional key parameter. Since batteries are often manufactured in specific countries (mostly in China), this electricity mix seldom corresponds to that of the country where the BEV is driven.
In addition to the parameters
reswe
archers have already discussed, a crucial point is vehicle occupancy. While most of the considered studies are based on average occupancy levels for passenger cars (generally in the range of 1.2–1.5), this parameter can have important variation in specific contexts, and it obviously has a significant contribution to the calculation of emission factors per pkm. Data show that occupancy can vary based on the purpose of the trip: while the average occupancy for British cars in 2020 was 1.49, commuting trips had on average 1.14 occupants, while for holiday trips this value increased to 1.96
[53][57]. This parameter is even more relevant when evaluating the specific effect of measures that aim to increase vehicle occupancy, such as carpooling schemes. Proper assessment of the effect of these schemes requires the possibility of separating the effect of vehicle occupancy on emission factors
[54][58].
Another aspect that is seldom addressed in the literature (making up only a few of the studies in
theour analysis, especially
[5]) is the role of taxi and ride-hailing services. In addition to their potential effect on average vehicle occupancy (of course without considering the driver), these solutions often show very high impact on deadweight loss, i.e., the distance driven by empty cabs between trips. Different studies highlight that this increased driving contributes significantly to congestion in large cities (together with a significant modal shift from transit)
[55][56][59,60]. In
[5], the total LCA emission factors are 98–114% higher for taxis and 53–70% higher for ride-hailing services compared to private cars. These figures show the importance of using dedicated emission factors that are focused on these specific transport modes for analyses.
2.2. Two-Wheelers
The two-wheelers category includes a range of different modes, such as mopeds and motorbikes, but also electric scooters, which are seeing increasing success in many cities worldwide thanks to sharing schemes.
ICE mopeds show LCA emission factors of 73 to 92 g/pkm (average and median of 83 g/pkm), while a single study
[6] shows an LCA emission factor for motorbikes of 137 g/pkm due to their larger size. The largest contribution comes from direct emissions, with a minor share from manufacturing and WTT. Emission factors are lower than those presented for ICE cars in the previous section due to lower weights of two-wheelers, which causes lower energy consumption both in operation and in manufacturing. As previously mentioned, however, increasing the number of passengers in cars can lead to comparable (or even lower, when at full-capacity) emission factors.
Private electric mopeds are considered in only three studies
[5][6][33][5,6,37] and show LCA emission factors of 21 to 41 g/pkm. When considering the contribution of each stage, these studies provide mixed results: two studies suggest a larger impact of manufacturing over operation, while the third study suggests the opposite.
Shared electric mopeds are also included in
[5], with an LCA emission factor of 79 g/pkm. The higher impact compared to private mopeds is due to the additional emissions from services (including trips for charging/relocation) and the shorter estimated lifetime (in terms of total km driven over the life of the vehicle). This value is higher than the results of another dedicated study
[30][34], which reports an emission factor of 53 g/pkm (with the largest part associated with battery swapping and charging), but comparable to another work
[33][37] that reports a value of 77 g/pkm.
An additional two-wheel transport mode that is gaining momentum in cities, and has also been the focus of a number of research studies in recent years, is shared electric scooters. Research on this mode
[5][6][31][32][5,6,35,36] reports total LCA emission factors in the range 102 to 160 g/pkm, with a median value of 122 g/pkm (and an average value of 123 g/pkm). While electricity consumption has a marginal impact, the production phase is the most critical (up to 80% of the total emissions) due to the short lifetime of e-scooters, which can be both a consequence of misuse by customers and low-quality materials. Another significant impact is due to the relocation of scooters for charging; in fact, analyses of private e-scooters show much lower impact, from 25 to 42 g/pkm of total LCA emissions. Operators of electric scooter sharing systems are trying to improve this performance through better construction quality and swappable batteries.
2.3. Bikes
Figures on emission factors of private bikes show a range of 5 to 17 g/km, with a median value of 9 g/km and an average value of 10 g/km. Most of the impact is related to manufacturing, with a minor share related to maintenance. Bike-sharing systems show higher impact, with emission factors varying from 10 to 58 g/km (median of 46 g/km and average of 38 g/km). Both the higher impacts and the variability are mostly related to the services supporting bike-sharing system, such as bike relocation.
Electric bikes generally have higher emission factors, mainly due to more complex manufacturing and only secondarily due to the impact of electricity consumption during their operation. Private e-bikes show emission factors in the range of 21 to 34 g/km (median 22 g/km, average 25 g/km), with emissions related to their operation accounting for 14% to 35% of the total. As seen with scooters, bike sharing increases the impact, as shared e-bikes emit 53 to 83 g/km due to the significant impact of different services of the system, since, in addition to relocation for optimizing the system, e-bikes also need to be charged. In this case, services account for 30–58% of the total emissions, depending on the study.
Some authors also consider the effect of additional food consumption in active mobility. Others even suggest that additional breathing leading to CO
2 emissions should be considered, although it is clear that emissions from breathing are part of a natural closed cycle and are thus net zero emissions. However, the considerations related to food consumption are still a debated topic and are affected by significant uncertainties.
A research report on cycling benefits published in 2011 and focused on the European Union
[57][61] estimated an impact of 16 g
CO2e/km related to food consumption. This result is based on the assumption that a cyclist consumes on average 11 kcal/km, and the average diet in the EU leads to the emission of 1.44 g
CO2e/kcal.
A recent report
[58][62] estimates that the potential impact of food consumption is 140 g
CO2e/km (with an uncertainty interval (UI) between 60 and 280 g/km) by considering additional energy expenditure to cycle one km to be between 25 and 40 kcal and assuming energy expenditure is fully compensated for with increased energy intake based on the average global diet. The report also remarks that the impact of food varies significantly around the world based on different diets and the related GHG impact. Moreover, the authors provide additional results based on the hypothesis that only 57% (UI 19–96%) of additional energy expenditure is compensated for by additional food intake (based on other studies), leading to emissions of 80 g
CO2e/km (UI 30–130 g/km) in developed countries.
However, Bell et al.
[59][63] report the incidence of obesity for users switching from bikes to motorized vehicles, suggesting they maintain their caloric intake even when reducing exercise. This challenges the assumption of a one-to-one relationship between energy requirements for cycling and caloric intake. Moreover, other scholars suggest that active mobility often substitutes for other forms of physical activity (running, gym, etc.) that would have been done, thus having marginal or null effects on food consumption by the users.
Due to these significant unsolved elements,
rwe
searchers believe that these emissions should not be compared to the other emissions related to the different stages of transport modes.
2.4. Buses
The climate impact of buses depends on a number of aspects, including average occupancy, powertrain technology and urban/intercity operation.
In the works considered for this analysis, traditional urban buses running on diesel have emission factors in the range 55 to 112 g/pkm (average 87 g/pkm, median 93 g/pkm). Long-distance buses and coaches show better performance, with emission factors in the range of 33–38 g/pkm due to better occupancy and less frequent starts and stops compared to urban buses.
Hybrid solutions provide some improvements, with hybrid diesel buses emitting 66–70 g/pkm and PHEV buses 38–68 g/pkm (also depending on the electricity mix). The use of fuels other than diesel may show benefits in some cases, as selected studies show hydrotreated vegetable oil (HVO) leading to 34 g/pkm
[38][42], and LPG and LNG having 47 g/pkm and 63 g/pkm, respectively
[39][43].
Electric buses show promising benefits, with emission factors from 16–72 g/pkm (median 48 g/pkm, average 43 g/pkm), especially when operated in countries that have low emission intensity for electricity generation (TTW emissions account for between 28% and 82% of the total, depending on the electricity mix).
2.5. Rail
This section includes mostly electrified transport modes, although non-urban trains may also include a share of diesel-powered vehicles in some locations. Compared to buses, all these transport modes are much less standard in terms of length and capacity, which adds a layer of complexity when comparing different systems. At the same time, the fact that they mostly rely on electricity leads to lower emissions than for other transportation modes.
An additional point of uncertainty is the impact of infrastructure: while roads are considered without taking into account the impact of construction and maintenance based on the fact that their use is shared across several different modes, rail transport often has dedicated infrastructure, which should be taken into account. However, this infrastructure usually has a long lifetime, complicating the extrapolation of meaningful values.
Few studies include different rail modes, and their results are not always comparable. For instance, two studies focus on urban rail (i.e., trams and metro) considering the LCA
[5][6][5,6], with emission factors from 11 to 66 g/pkm (average 40 g/pkm, median 43 g/pkm), while other studies present WTW values from 29 to 84 g/pkm (average 56 g/pkm, median 54 g/pkm) for the same modes
[8][9][10][12,13,14]. Moreover, none of these studies specifically address rail transport modes, which are instead included in broader comparisons of urban mobility options.
Considering national and regional trains (excluding high-speed trains), WTW emission factors are from 14 to 42 g/pkm (average 30 g/pkm, median 35 g/pkm), although one specific study
[8][12] reports values as low as 6 g/pkm and as high as 118 g/pkm, which represent the boundaries for electricity-driven trains with very low carbon electricity mixes and for diesel trains, respectively. LCA emission factors of national and regional trains, obtained from five different studies
[6][40][41][43][49][6,44,45,47,53], range from 6–100 g/pkm, with an average value of 59 g/pkm and a median of 55 g/pkm. The lowest value is from a study in Mumbai that shows a very high occupancy rate
[40][44] and that may therefore be less representative of the performance of this transport mode in other locations.
Finally, high-speed rail (HSR) is quite different compared to other rail transport modes due to the dedicated infrastructure. Some studies considering high-speed rail report 13 to 94 g/pkm for LCA emission factors (average of 36 g/km), although they do not always consider the impact of infrastructure. A specific analysis on the HSR infrastructure in Spain
[49][53] estimates its impact to be between 12 and 60 g/pkm depending on the region, with a national value of 18 g/pkm. As previously mentioned, the choice of considering the impact of infrastructure remains debated, especially when comparing HSR with road transport modes.