The outbreak of a novel coronavirus SARS-CoV-2 responsible for the COVID-19 pandemic has caused a worldwide public health emergency. Due to the constantly evolving nature of the coronaviruses, SARS-CoV-2-mediated alterations on post-transcriptional gene regulations across human tissues remain elusive. In this study, we analyzed publicly available genomic datasets to systematically dissect the crosstalk and dysregulation of the human post-transcriptional regulatory networks governed by RNA-binding proteins (RBPs) and micro-RNAs (miRs) due to SARS-CoV-2 infection. We uncovered that 13 out of 29 SARS-CoV-2-encoded proteins directly interacted with 51 human RBPs, of which the majority of them were abundantly expressed in gonadal tissues and immune cells. We further performed a functional analysis of differentially expressed genes in mock-treated versus SARS-CoV-2-infected lung cells that revealed enrichment for the immune response, cytokine-mediated signaling, and metabolism-associated genes. This study also characterized the alternative splicing events in SARS-CoV-2-infected cells compared to the control, demonstrating that skipped exons and mutually exclusive exons were the most abundant events that potentially contributed to differential outcomes in response to the viral infection. A motif enrichment analysis on the RNA genomic sequence of SARS-CoV-2 clearly revealed the enrichment for RBPs such as SRSFs, PCBPs, ELAVs, and HNRNPs, suggesting the sponging of RBPs by the SARS-CoV-2 genome.
- SARS-CoV-2
- COVID-19
- post-transcriptional regulation
- RNA Binding Proteins
- microRNAs
- RNA
- Network biology
We obtained the affinity purification-mass spectrometry (AP-MS)-based SARS-CoV-2 and human proteins interaction network established in HEK293 cells [23] [1] and investigated the human RBPs that directly interact with the viral proteins. Our analysis revealed that SARS-CoV-2-encoded proteins interact directly with 51 human RBPs (Figure 1A). We observed that these primary interacting RBPs were proven to serve several vital functions in the cells, such as polyadenylate binding protein 4 (PABP-4) and Dead-box RNA helicases (DDX21 and DDX10), enzymes involved in translation machinery such as the eukaryotic translation initiation factor 4H (EIF4H), and ribosomal protein L36 (RPL36) (Figure 1A). Among the direct interactors, the highly abundant cytoplasmic PABPs, known to bind the 3′ polyA tail on eukaryotic mRNAs, has previously been reported to interact with polyA tails in bovine coronavirus and the mouse hepatitis virus [49,50,51][2][3][4]. Since SARS-CoV-2 is also composed of polyadenylated RNA, it is likely that the host PABP could modulate the translation of the coronavirus genome through polyA binding. DDX10, another primary interactor observed in the analyzed dataset, has been reported to interact with SARS-CoV-2 nonstructural protein 8 (nsp8) [52][5], suggesting that the identified host RBPs could be implicated in the regulatory processes of SARS-CoV-2 genome synthesis. EIF4H, also found as one of the primary interactors, was reported to interact with SARS-CoV-2 nonstructural protein 9 (nsp9) in a recently published study [23][1]. Furthermore, among the immediate interactions, we also found human RBPs such as signal recognition particle 19 (SRP19 and SRP54) and Golgin subfamily B member 1 (GOLGB1) that have been well-recognized for co-translational protein targeting to the membrane and endoplasmic reticulum to Golgi vesicle-mediated transport [53,54] [6][7] (Figure 1A). These results suggest that several human RBPs that come into direct contact with SARS-CoV-2 proteins could contribute to virus assembly and export and could therefore be implicated as therapeutic targets. However, such findings require in-depth experimental validation in a tissue-specific context to support the functional involvement of the identified RBPs in response to SARS-CoV-2 infection.
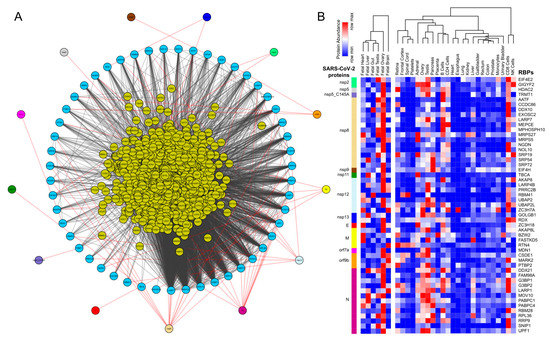
Figure 1. Protein-protein interaction network analysis suggests a direct interaction of human RNA-binding proteins (RBPs) with SARS-CoV-2 viral proteins (A) An integrated SARS-CoV-2—human RBP interaction network. We obtained the mass spectrometry (MS)-based SARS-CoV-2 viral protein to the human protein interaction network established in HEK293 cells and integrated with first-neighbor-interacting RBPs (obtained from BioGRID—https://thebiogrid.org). (B) Protein abundance of SARS-CoV-2-interacting RBPs across human tissues. Expression data was obtained from the human protein map and row normalized. SARS-CoV-2 proteins were color-coded and highlighted in the network.
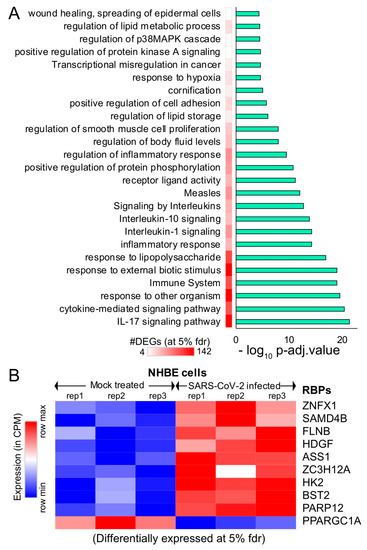
Figure 2. Differential expression analysis of mock-treated vs. SARS-CoV-2-infected primary human lung epithelial cells. (A) Bar plot illustrating the significant pathways obtained from the Gene Ontology (GO) term-based functional grouping of Differentially Expressed Genes (DEGs) at 5% False Discovery Rate (FDR) using ClueGO analysis (Cytoscape plugin) (B) Row normalized expression profile of differentially expressed RBPs in mock-treated and SARS-CoV-2-infected primary human lung epithelial cells (in biological triplicates). NHBE: normal vs. SARS-CoV-2-infected human bronchial epithelial cells.
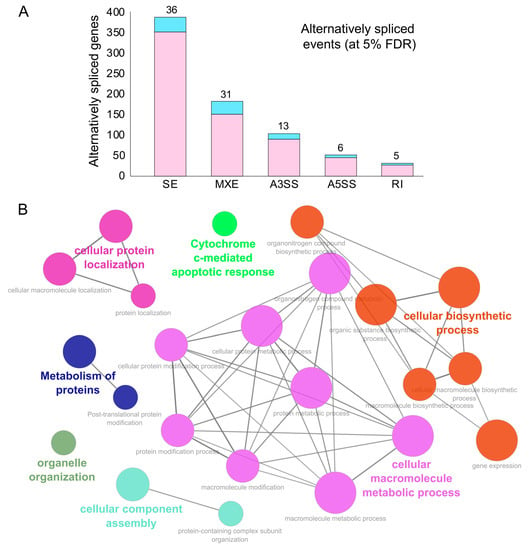
Figure 3. Alternative splicing events during SARS-CoV-2 infection. (A) Bar plot showing the genes (RBP-encoding genes in blue) exhibiting alternative splicing during SARS-CoV-2 infection in primary human lung epithelial cells (at 5% FDR). (B) Clustered GO term network obtained from the function annotation analysis and grouping of the GO term for the genes exhibiting alternative splicing using ClueGO (Cytoscape plugin). Significant clustering (adj. p < 1 × 10⁻⁵) of functional groups were color-coded by functional annotation of the enriched GO biological processes, with the size of the nodes indicating the level of significant association of genes per GO term were shown.
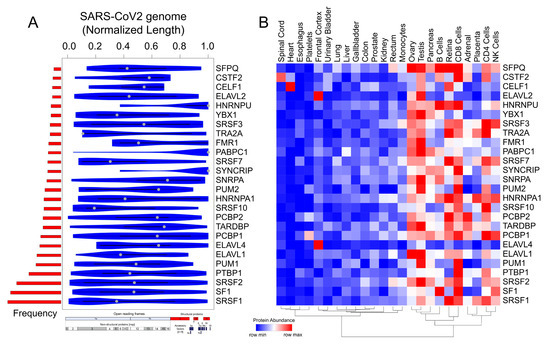
Figure 4. Motif enrichment analysis reveals potential human RBPs titrated by the SARS-CoV-2 viral genome. (A) Violin plot shows the statistically significant (p < 1 × 10⁻⁵) preferential binding profile of the RBP motifs (sorted by frequency of binding and greater than 10 sites) across the SARS-CoV-2 viral genome (length normalized) identified using FIMO. (B) Hierarchically clustered heatmap showing the protein abundance (row normalized) of RBPs across tissues.
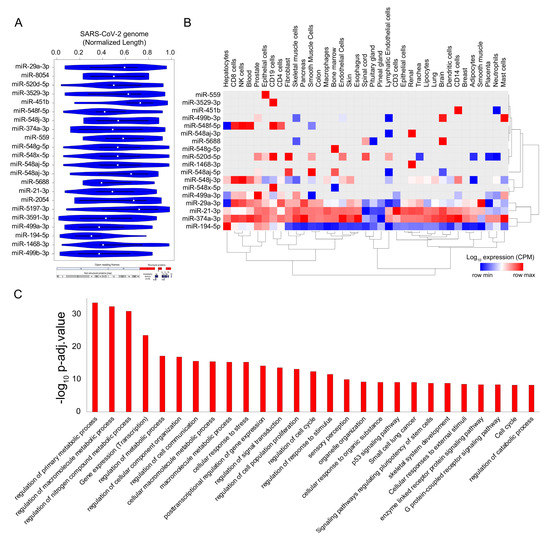
Figure 5. SARS-CoV-2 genome titrates the abundance of functionally important micro-RNAs (miRs) in human tissue. (A) Violin plot shows the statistically significant (p < 1 × 10⁻⁵) preferential binding profile of miR motifs (sorted by frequency of binding >15 sites) across the SARS-CoV-2 viral genome (length normalized) identified using FIMO. (B) Hierarchically clustered heatmap showing the log10 expression (Copies Per Million mapped reads (CPM), row normalized) of miRs across the tissues. (C) Bar plot illustrating the significant biological processes obtained from the gene ontology enrichment-based functional grouping of miR target genes (obtained from miRNet). Significant clustering (adj. p < 1 × 10⁻¹⁰) of genes enriched in GO biological processes generated by ClueGO analysis (Cytoscape plugin).
References
- Gordon, D.E.; Jang, G.M.; Bouhaddou, M.; Xu, J.; Obernier, K.; White, K.M.; O’Meara, M.J.; Rezelj, V.V.; Guo, J.Z.; Swaney, D.L.; et al. A SARS-CoV-2 protein interaction map reveals targets for drug repurposing. Nature 2020, 583, 459–468.
- Shi, S.T.; Lai, M.M. Viral and cellular proteins involved in coronavirus replication. Curr. Top Microbiol. Immunol. 2005, 287, 95–131.
- Spagnolo, J.F.; Hogue, B.G. Host protein interactions with the 3’ end of bovine coronavirus RNA and the requirement of the poly (A) tail for coronavirus defective genome replication. J. Virol. 2000, 74, 5053–5065.
- Yu, W.; Leibowitz, J.L. Specific binding of host cellular proteins to multiple sites within the 3’ end of mouse hepatitis virus genomic RNA. J. Virol. 1995, 69, 2016–2023.
- Tutuncuoglu, B.; Cakir, M.; Batra, J.; Bouhaddou, M.; Eckhardt, M.; Gordon, D.E.; Krogan, N.J. The Landscape of Human Cancer Proteins Targeted by SARS-CoV-2. Cancer Discov. 2020, 10, 916–921.
- Nyathi, Y.; Wilkinson, B.M.; Pool, M.R. Co-translational targeting and translocation of proteins to the endoplasmic reticulum. Biochim. Biophys. Acta 2013, 1833, 2392–2402.
- Saraogi, I.; Shan, S.O. Molecular mechanism of co-translational protein targeting by the signal recognition particle. Traffic 2011, 12, 535–542.