Your browser does not fully support modern features. Please upgrade for a smoother experience.
Please note this is a comparison between Version 2 by Catherine Yang and Version 1 by Siddig Adam Omer.
Electric vehicles (EVs) are important elements in the global strategy to tackle climate change. EVs are widely considered to be more environmentally and economically efficient than internal combustion engine-based vehicles (ICEVs), and as the technology matures and availability increases, governments around the world are beginning to phase out ICEVs and promote EV adoption.
- electric vehicles
- sustainable transportation
- EV adoption
- vehicle-to-grid
1. Key Factors Associated with EVs
There have been many studies of the factors influencing potential EV users and the importance of taking their views into consideration. For example, according to Funke [18][1] the share of electric taxi fleets in Karlsruhe, Germany, could increase by up to 45% if taxi users’ perspectives were considered. Meanwhile [19][2] suggests that knowing customers’ needs and segmenting buyers by range requirements is critical, rather than presuming that all drivers need currently expensive large batteries. In terms of adoption, [20][3] concludes that EVs are more attractive to consumers with high annual mileage in Germany, while [21][4] finds that the high purchase price and high battery costs are the most important factors affecting EV adoption in China. However, Singh [22][5] concludes that policymaking is the most influential factor in terms of influencing the rate of EV adoption since it can directly affect customers’ intentions to purchase an EV. In regions, such as Japan and California, US, for example, long-term government subsidies encourage drivers to switch to EVs [23][6], and many studies have found that the development of EV infrastructure enhances acceptance of EVs, something which requires policy support [22,24][5][7]. Such factors are expected to influence the perceptions of potential EV users in Saudi Arabia and other petroleum producing states, and these are discussed in more detail below.
1.1. Charging Infrastructure
Charging infrastructure is a key issue in relation to EV adoption, and Tie [25][8] recommends the building of a comprehensive nationwide charging infrastructure to precede the introduction of EVs. This is a particular issue in the context of Saudi Arabia, a relatively large country (at over 2,000,000 km2) [26][9] with a desert climate. The long distances between cities and the heavy use of air-conditioning drains batteries more quickly, and Saudi drivers report feeling ‘range anxiety’ [27][10], so charging stations are needed on all main roads. An optimal solution would be the formation of isolated microgrids supplied by renewable energy, with diesel backup [27][10].
Charging Stations
Numerous studies have found that a lack of infrastructure has a direct impact on consumers’ intentions to purchase an EV [22,28,29][5][11][12]; this not only affects market sales, but it has also risen to the top of the list of arguments against the spread of EVs [30][13]. Research indicates that an increase in public charging infrastructure development leads to an increase in EV sales; however, in the early stages of the EV market, private charging options, such as home or workplace charging, have also proven to be significant [31][14]. Moreover, lower total expenses associated with household charging unit installation and vehicle operation would significantly enhance customer behaviour towards and perceptions of EVs [6][15].
Repair and Maintenance Workshops
According to [32][16] the absence of EV repair centres and workshops compared to those for ICEVs has disappointed current EV owners. For example, a study in Denmark [33][17] found that the fact that EV technology is still new means that relatively few workers are qualified and trained to fix EVs, so even simple repairs are costly and more complex repairs may take several months.
Effect on the Electricity Grid
EVs consume a high amount of real power in a short period of time due to the non-linear nature of their loads, and this can cause instability in the power networks [34][18]. Overloading of charging may also affect aspects of the grid and distribution network, depending on driving and charging behaviour, so EVs can have a significant impact on the power network’s load curve [35][19]. The KSA generates an estimated 362 TWh of electricity, mainly from crude oil and natural gas, [36][20]; however, demand can exceed supply in the hot summer months, and the widespread adoption of EVs will place additional burdens on an overstretched grid. In addition, as less than 1% of electricity comes from renewable energy resources [36][20], this may also increase GHG emissions unless steps are taken to further develop renewable electricity production.
1.2. Vehicle to Grid Technology
Storage of energy is also an issue for EV adoption; however, the increasing global uptake of EVs facilitated by technological advances, such as cheaper batteries, has initiated new business models to exploit the potential of EVs for electric storage. V2G technology is one such development, and it enables EVs to be charged and to return stored electricity to the grid through a connection to a domestic, commercial, or public charging station [37][21]. Vehicle batteries are charged at a low tariff when demand on the grid is low and excess unused power is available, then partially discharged at a higher tariff during peak demand, when the grid is short of supply, allowing owners to make a profit [38][22]. V2G thus offers cheap, flexible, and fast-responding storage [39][23] and also incentivizes EV owners to participate in charge/discharge systems.
According to Weiller and Neely [40][24], V2G has both short- and long-term potential benefits. The former includes residential applications, such as vehicle-to-home for smart home systems, and it is significant to note that Tesla has promoted its EVs as central to the ‘self-powered home’, in which they are integrated with solar panels and a so-called Powerwall [41][25]. The long-term benefits include potential reductions in GHG emissions (around 13,429 kg CO2 per year with self-sufficiency of 99.1% and net metering) and reduce per-unit electricity prices by up to 12% [42][26]. In addition, as Tesla’s move suggests, continued technological innovation and development of V2G systems, alongside shorter battery response times, will potentially be enhanced by integration with solar photovoltaics, among other options [43][27].
The development of this technology is currently constrained by inadequate infrastructure, battery degradation, and low consumer awareness. For example, grid-scale uses of EV batteries for storage and V2G applications are unlikely to be deployed in the short-term because EV adoption rates do not yet justify new control architectures being implemented. However, studies of consumer acceptance of V2G have identified key institutional and policy factors as including incentives to EV consumers, such as direct subsidies, emission-based taxes, provision of charging infrastructure, and free parking. Developments in battery capacity, driving range, and in the purchase price of EVs are discussed below.
1.3. EV Batteries
Lithium ion batteries (LIBs) are used for EVs and grid storage applications because of their superiority to conventional lead–acid or nickel–cadmium batteries in terms of energy density, specific power, cost, safety, cycle life, and calendar life. An LIB stores chemical energy during charging and converts it to electrical energy while discharging, and an EV carries LIBs in groups connected as modules, which are joined together to form a complete battery pack. Each module has the circuits for a thermal management system and the whole pack is used to power the motor which propels the EV [44][28]. The power density, cycle life, cost per kWh of energy, and calendar life correspond to the energy requirement of the battery system. However, the range and the battery capacity of an EV are not linear; the weight of the battery pack increases with an increase in capacity, which adversely affects the efficiency of the vehicle on the road. It is therefore important to compare batteries and battery systems based on energy and power densities, rather than on range requirements. Different battery technologies and their specific energy and specific power ratings are shown in Figure 1 [45][29].
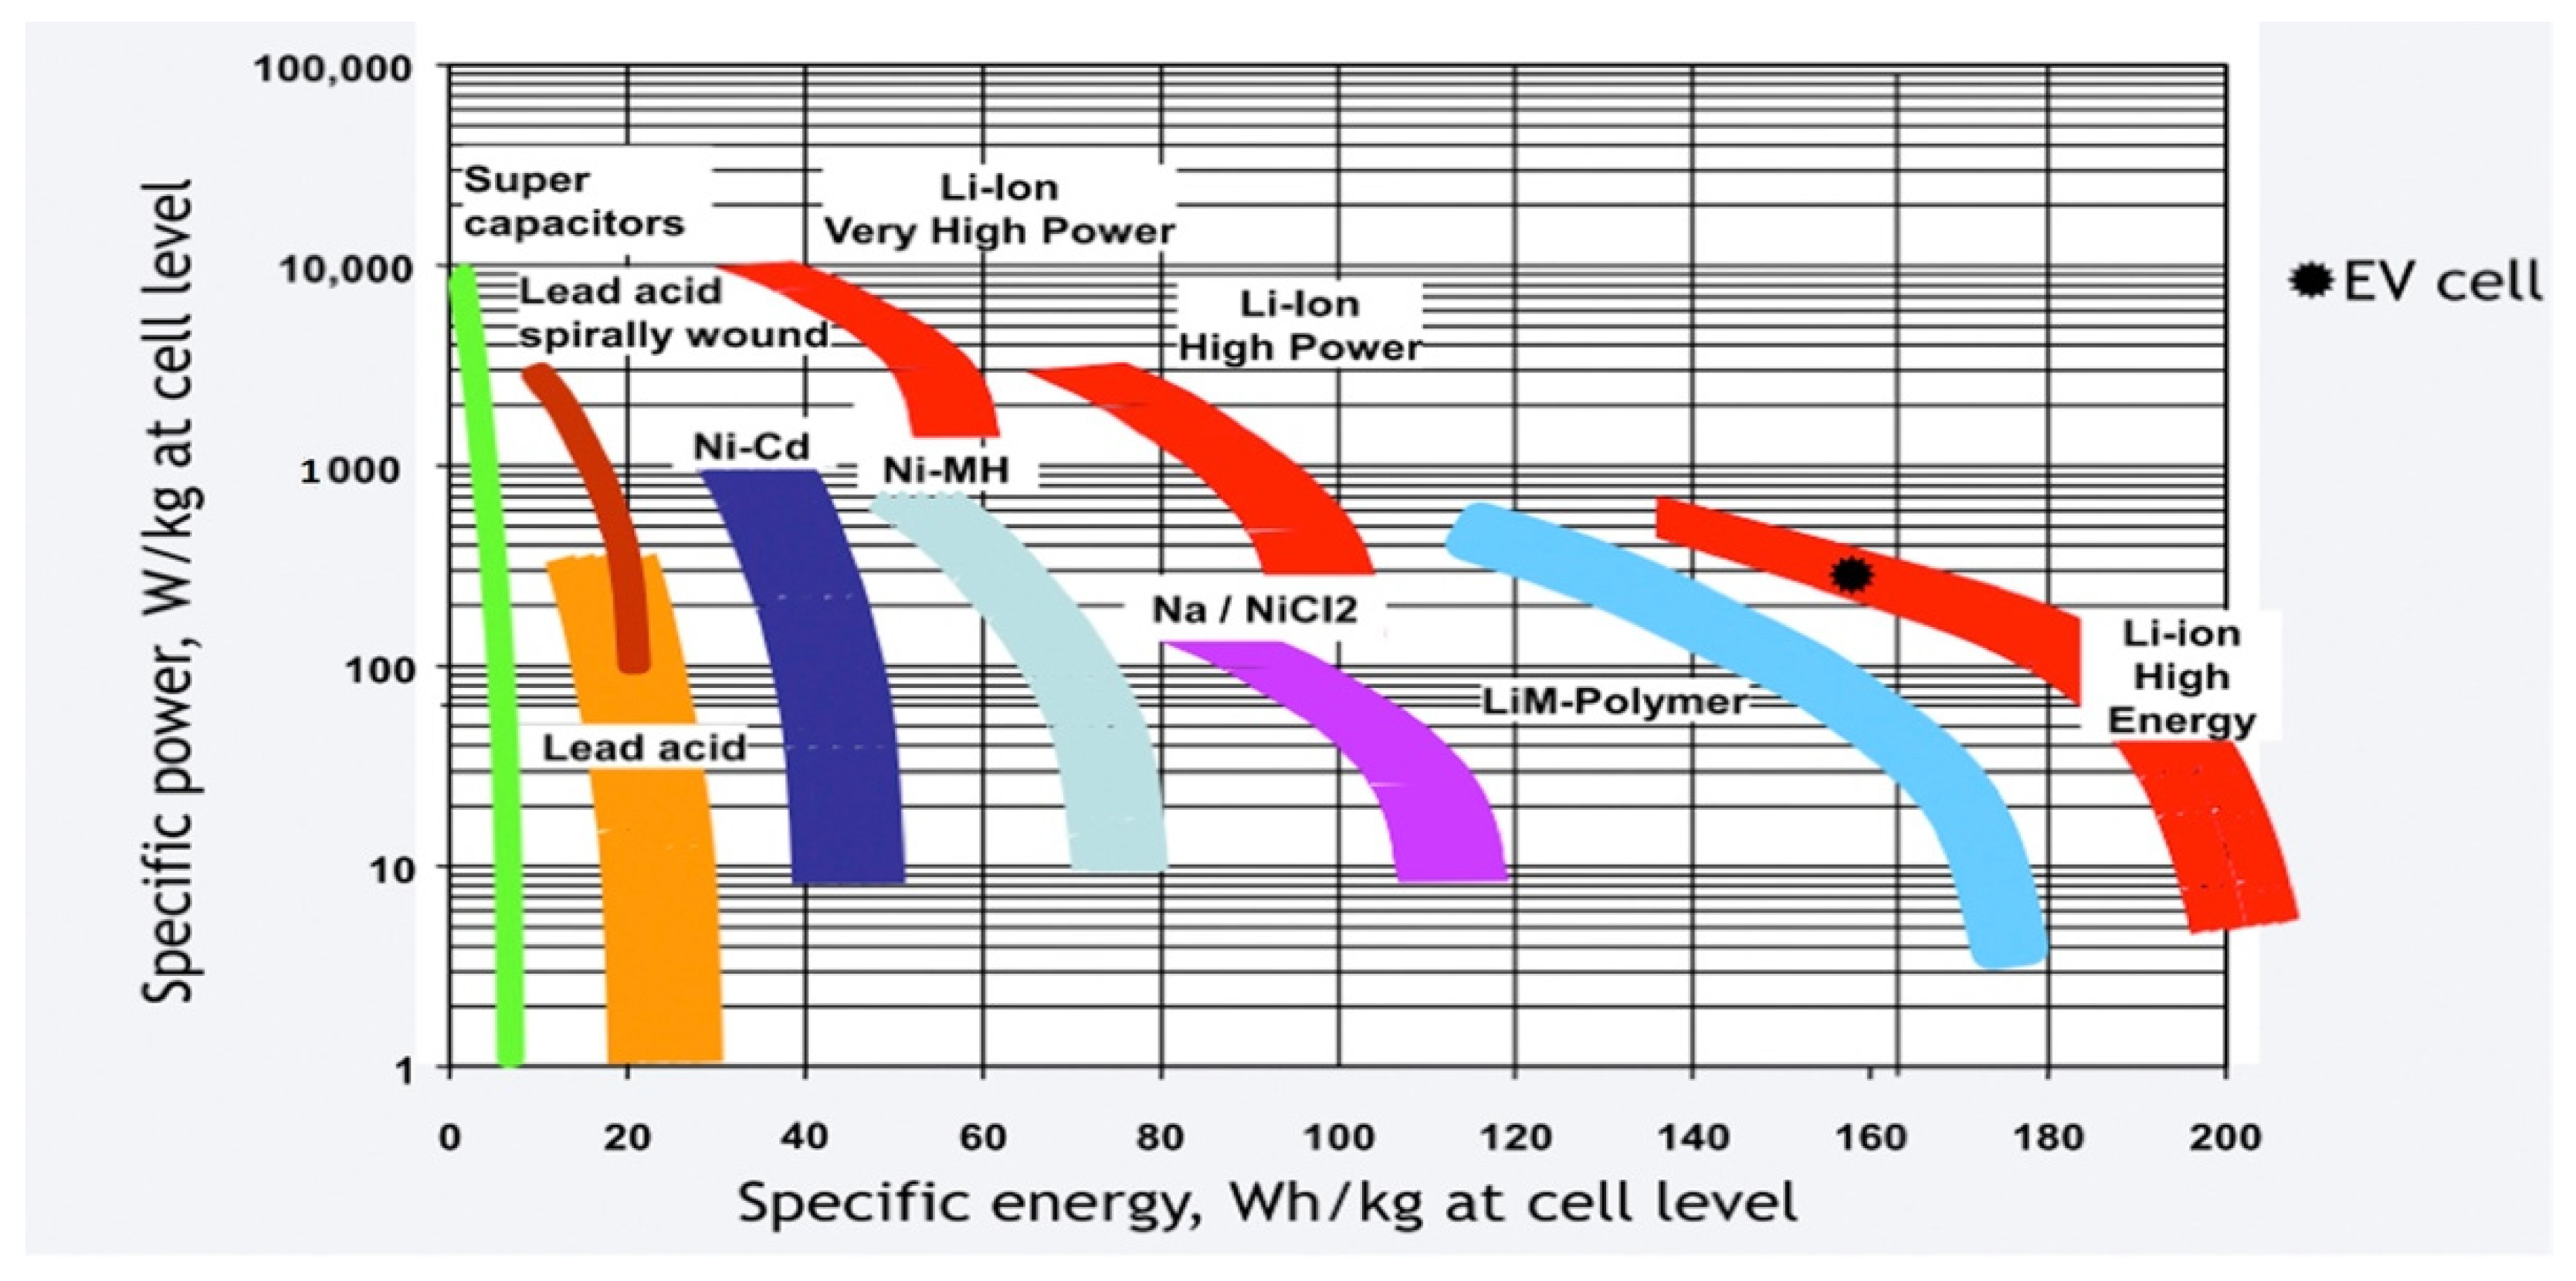
Figure 1.
Various battery technologies used in EVs and their specific energy and specific power ratings.
Driving Ranges and Charging Times
One of the main challenges associated with battery electric vehicles (BEVs) is the limited capacity and driving range associated with the batteries and their cost. The battery capacity of many current models limits their driving range to 250 km, although some new models offer ranges of up to 400 km, and upcoming models are predicted to range beyond this [50][30]. Consumers are also concerned about the cost of batteries. In 2015 this was approximately USD 350/kWh, making the cost for a battery capacity of 40 kWh as much as USD 14,000, meaning an EV would cost at least USD 12,000 more than a similar ICEV [50][30]; however, it is estimated that these will decrease to around USD 112/kWh by the end of 2025 [51][31]. It is important to recognize that real-world driving ranges will not be the same as the rated (or manufacturers’) range, as factors, such as driving conditions and drivers’ skills, will affect vehicle efficiency. Thus, the time taken to charge an EV is also a significant consideration.
The shortest attainable rapid charging time is 22 min for the Tesla Model 3, while most other modern EVs can be rapidly charged fully within 45 min. Among these, the Tesla Roadster has the longest range, at 965 km, with a real-world range closer to the rated range than other EVs. The length of time it takes to recharge an EV depends on the type of charger used, with the fastest chargers costing the most. There are currently three main types of chargers, AC level 1, level 2 and DC fast chargers, and their key performance details are shown in Table 31. AC level 1 EV supply equipment delivers charging through a 120-volt AC plug and provides a range of about 2–5 miles per charging hour, while AC level 2 equipment is capable of charging through 208–240-volt electrical supply, and it can be installed at home or as a public charging point. This provides 10–20 miles per charging hour; however, as the charging time for a 24 kWh battery pack is around 8 h, an EV should be fully charged at home when 240-volt services are available [55][32]. Next, 480-volt direct current (DC) fast charging equipment provides charging in around 30 min, but these are only available at public stations and cannot be installed in residential buildings for safety purposes. Globally, there are three types of DC charging systems: Type 4 CCS/COMBO (Combined Charging System), Type 4 CHAdeMO, and Tesla dual single-phase AC and DC charger [56][33]; however, only the Japanese CHAdeMO standard chargers (used by Nissan, Mitsubishi, and Kia), are currently fitted with V2G technology [57][34].
| Charging Levels | Miles per Charging Hour | Charging Time for a 24 kWh Battery Pack | Charger Standard |
|---|---|---|---|
| AC level 1 | 2–5 | ~17 h | SAE J1772 |
| AC level 2 | 10–20 | ~8 h | SAE J1772 |
| DC fast charging | 50–70 | ~30 min | CHAdeMO, CCS, Combo, Tesla Supercharger |
Battery Lifespan
Competition with conventional ICEVs requires EVs and their batteries to run reliably for 10–15 years under various climatic conditions and duty cycles. The main factors limiting battery lifetime are time at high temperature, state of charge (SoC), cycling at high depth of discharge (DoD), and C-rate [59][36]. While time at high temperature may not be regarded as a significant factor within Western European or North American contexts, it takes on much greater importance in the Saudi context, where summer temperatures average 45 °C [60][37].
Charging is most efficient when the battery has low charge or SoC, while charge acceptance slows towards saturation. Charging efficiency also depends on temperature and SoC. As the battery ages, internal resistance increases, and the charge rate slows. An SoC above 80% promotes capacity fade, while keeping the lithium ion at high SoC affects lifetime more than cycling at mid-range SoC [62][38].
1.4. Weather Conditions and Terrains
Research suggests that the performance of an EV varies considerably according to the climate and terrain in which it is driven. For example, [63][39] found that the driving range in mountainous terrain was less than the manufacturers had estimated. In addition, the thermal behaviour of lithium ion batteries is adversely affected by extreme heat, with both charging efficiency and life cycle significantly reduced when battery temperature exceeds 50 °C. For example, the Nissan Leaf’s battery capacity was found to deteriorate when tested in the heat of Arizona in the US [64][40]. Saudi Arabia has a desert climate with extremely high temperatures in the summer, reaching an average of 45 °C [65][41], and mountainous regions in the west and southwest, and this could raise doubts about the suitability of EVs, negatively impacting their quick adoption, at least in the short-term.
1.5. Safety of EVs
While there are risks with any motorised vehicle, the risk of fire and other hazards associated with lithium ion batteries are particularly serious in EVs for a variety of reasons; these include high demands in terms of driving performance and charging speed, the resulting increasing scale and energy density of battery packs, and unavoidable traffic accidents [66][42]. There is an additional risk that burning lithium ion batteries may release toxic gases as a result of their high heat rate [66][42]. Concerns around the risks associated with fires due to batteries overheating are likely to be exacerbated when external air temperatures are already high, as is the case in the KSA.
1.6. Environmental Benefits
EVs have the potential to play a key role in reducing GHG emissions within the transportation sector, which has one of the highest emissions rates of any sector [67][43]. However, evaluating exactly how environmentally friendly EVs are is a complex task that includes assessing the electricity generation sources for charging and manufacture and the challenges associated with recycling EV batteries, and their overall contributions to environmental degradation. Consequently, users are frequently unsure whether driving an EV will actually assist the environment by reducing GHG emissions [68][44]. However, the use of renewable resources to power EVs could significantly enhance their green credentials.
1.7. EV Prices
EV pricing depends on several factors, including driving range, battery capacity, and km/kWh energy consumption. Table 52 [69][45] lists the manufacturer’s suggested retail price (MSRP) for selected US BEVs, showing their range, battery capacity, and km/kWh consumption. The fact that even the cheapest models come in at over USD 29,900 demonstrates that purchase price is a significant factor in relation to EVs, especially by comparison with ICEVs.
Table 52. EV manufacturers and models with range, battery capacity, per kWh energy consumption, and manufacturer’s suggested retail price [69].
EV manufacturers and models with range, battery capacity, per kWh energy consumption, and manufacturer’s suggested retail price [45].
| Manufacturer | Model | Range (km) | Battery Capacity (kWh) | km/kWh | MSRP (USD) |
|---|---|---|---|---|---|
| Tesla | Model S 100D | 564 | 100 | 5.65 | 94,000 |
| Tesla | Model S P100D | 542 | 100 | 5.42 | 135,000 |
| Tesla | Model 3 | 498 | 78 | 6.39 | 35,000 |
| Tesla | Model X 100D | 474 | 100 | 4.75 | 96,000 |
| Tesla | Model X P100D | 465 | 100 | 4.65 | 140,000 |
| Tesla | Model S 75D | 442 | 75 | 5.90 | 74,500 |
| Chevrolet | Bolt EV | 383 | 60 | 6.39 | 36,620 |
| Tesla | Model X75 | 381 | 75 | 5.08 | 70,532 |
| VW | e-Golf | 201 | 35.8 | 5.62 | 30,495 |
| Hyundai | Ioniq Electric | 200 | 28 | 7.13 | 29,900 |
| Ford | Focus Electric | 185 | 33 | 5.60 | 29,120 |
| BMW | I3 | 183 | 33 | 5.55 | 44,450 |
| Kia | Soul EV | 178 | 30 | 5.95 | 32,250 |
| Nissan | Leaf | 172 | 30 | 5.74 | 29,900 |
| Honda | Clarity Electric | 150 | 25.5 | 5.61 | 33,400 |
| Fiat | 500e | 140 | 24 | 5.84 | 32,995 |
As Table 52 demonstrates, almost all models exhibit similar range per kWh energy consumption, at 5–6 km/kWh, except the Tesla Model X variants, at less than 5 km/kWh. While Tesla models are broadly comparable with competitors’ models in km travelled per kWh, they have superior ranges because of their larger battery capacity, compact packing, and efficient thermal management systems. The Hyundai Ioniq Electric has an impressive range per kWh of approximately seven kilometres; this high efficiency may be due to Hyundai’s battery technology. If Hyundai could scale its battery capacity to the 100 kWh capacity of Tesla, then it would have a driving range of 710 km, far longer than any other model, including those of Tesla. However, the pricing shown here suggests that any such innovation would lead to a significant increase in price, as Tesla models are among the most expensive listed, with the highest suggested retail price of the Tesla Model X P100 D being the most expensive at USD 140,000.
1.8. Charging Costs
While the average purchase costs of EVs far exceeds those of ICEVs, the running costs are typically much lower. For example, EDF Energy’s GoElectric 35 tariff [70][46], currently available to UK users, has an off-peak rate of GBP 0.045/kWh (USD 0.06/kWh), enabling users to fully charge a standard 40 kW Nissan Leaf overnight for only GBP 1.80 using a 7 kW home charger. This is much lower than the equivalent fuel cost for a conventional petrol or diesel car. In any driving scenario, the recharge consumption of an EV can be determined by multiplying its drive efficiency (in kWh/mile) by miles travelled. In the case of level 2 charging, the A/C charge rate is equal to the EV’s hourly recharge consumption, and dividing the required daily recharge consumption by the vehicle charging rate gives the number of charge hours per day [71][47]. The optimal daily charging amount can be estimated using Equations (1) and (2) below:
DHC= LMPT×(CHR−(T−1)×VCR)+∑T−1n=1VCR×LMPn
T=(CHRVCR)
DHC represents the daily hourly charges (USD), VCR is the vehicle charge rate (kW), T is charging time (hours), CHR is the charge required (kWh) and LMPn is the locational marginal price (LMP) during the nth lowest-ranked hour of the day (USD/kWh). When estimating DHC, the LMP values can, if necessary, be taken as starting from the lowest LMP hour and moving to the next rank ordered LMP hour. The savings achieved in the Tesla 3 long-range and Chevrolet Bolt for a range of driver profiles (light, average, heavy, and Lyft/Uber) are shown in Table 63 [71][47].
Table 63. Hourly and flat charging rates for Tesla and Bolt and corresponding savings over conventional petrol cars [71].
Hourly and flat charging rates for Tesla and Bolt and corresponding savings over conventional petrol cars [47].
| Driver Profile 1 | Vehicle | Hourly (USD) | Flat Rate (USD) | % Saving Hourly | USD Saving Hourly |
|---|---|---|---|---|---|
| Light driver | Tesla | 37 | 91 | 59 | 54 |
| Bolt | 40 | 98 | 59 | 58 | |
| Average driver | Tesla | 74 | 182 | 59 | 108 |
| Bolt | 81 | 196 | 59 | 115 | |
| Heavy driver | Tesla | 132 | 303 | 57 | 172 |
| Bolt | 143 | 327 | 56 | 184 | |
| Lyft/Uber | Tesla | 289 | 607 | 52 | 318 |
| Bolt | 315 | 654 | 52 | 339 |
1 Light driver—24 miles/day; average driver—48 miles/day; heavy driver—80 miles/day; Lyft/Uber driver—161 miles/day.
Having explored the main factors associated with EV usage globally, the next section examines the factors which are likely to influence their adoption in Saudi Arabia, notably recent rises in domestic fuel prices and the government’s ambitious carbon reduction plans set out in Vision 2030.
2. Drivers of EV Adoption in Saudi Arabia
There were over 15 million vehicles in Saudi Arabia in 2020 [72][48], four-fifths of these being cars and other light vehicles, and numbers are expected to reach 25 million by 2030 [73][49]. Although buses operate between cities and to and from neighbouring countries and trains run between major cities, such as Riyadh, Jeddah and Dammam, urban public transport is limited. Most people use their own vehicles, as the meagre public transport provision is compensated for by subsidized fuel, making cars affordable, even for low-income residents [74][50]. For example, in Riyadh, the capital city, private vehicle ownership almost doubled between 1996 and 2008, accounting for 85% of 8 million daily trips taken, against only 2% in buses [74][50]. According to the Saudi Energy Efficiency Center [75][51], transportation currently consumes around 21% of total energy in the KSA, at around one million barrels of oil equivalent per day, and 52% of the sector is light duty vehicles. As transportation energy consumption is expected to double by 2030 [75][51], the widespread adoption of electric vehicles could have a significant impact in reducing CO2 emissions; however, the findings of the survey (survey questions: https://rb.gy/lhogk8, accessed on 15 February 2021) conducted for this study indicate that there are almost no EVs on the KSA’s roads at the moment. Only one participant out of 698 stated that they currently drove an EV, with nearly 3.5% owning hybrid vehicles, but more than 96% of respondents still drive conventional vehicles.
However, domestic fuel prices are now being brought into line with international levels, as part of reforms aimed at easing the burden of subsidies on state finances, improving energy efficiency, and cutting consumption. Between 2007 and 2015, gasoline prices in Saudi Arabia were fixed, with premium 95-octane gasoline cost of SAR 0.60 (Saudi riyals) per litre, while 91-octane gasoline was at SAR 0.45 per litre. In the first wave of energy price reforms in December 2015, retail prices rose to SAR 0.90 and SAR 0.75 per litre, respectively, and there were larger increases in 2018, with prices rising to SAR 2.04 and 1.37 per litre [76][52]. In July 2021, following increased crude oil prices, the government capped prices at SAR 2.33 and 2.18 per litre, respectively [76][52]. As for electricity, the residential and commercial tariffs were set in January 2018 at SAR 0.18 and 0.20 per kWh, respectively [77][53]. With consumers now feeling the effect of increases in the price of gasoline, there is more willingness to consider switching to an electric option.
The Saudi government wishes to promote EVs in line with Saudi Vision 2030, an ambitious and broad reaching strategy to shift the economy away from oil and reduce GHG emissions, and some policies to support their adoption have already been developed [78][54]. However, adoption initiatives, such as the agreement with Lucid Motors, are in their early stages and are just beginning to be implemented in the country. This is reflective of the approach to EVs of the petroleum-producing states within the Gulf Cooperation Council (GCC), with the notable exception of the United Arab Emirates (UAE). Although a global revolution is occurring in the field of EVs, Dubai is the only location in the Gulf to have embraced this technology to date, with about 50% of Dubai’s taxi fleet now being hybrid or electric, and 300 charging stations available across the city [79][55]. Various studies have been conducted to assess the future of EVs in the KSA and to estimate the GHG reductions that may be achieved by their adoption [80][56]. Despite the fact that the country is one of the world’s largest oil producers, many of these studies indicate that a key challenge to EV adoption is the massive additional demand EVs will place on an already overloaded electrical network, especially during the summer, and steps are now being taken to design systems to evaluate the impact of EVs on the grid [81][57]. One possible solution is a techno-economic hybrid power system for EVs using a mixture of green energy [82][58]. This would be a significant development, both in terms of developing sustainable EV infrastructure and meeting the country’s GHG reduction targets.
References
- Funke, S.; Burgert, T. Can charging infrastructure used only by electric taxis be profitable? A case study from Karlsruhe, Germany. IEEE Trans. Veh. Tech. 2020, 69, 5933–5944.
- Pearre, N.; Kempton, W.; Guensler, R.; Elango, V. Electric vehicles: How much range is required for a day’s driving? Transp. Res. Part C Emerg. Technol. 2011, 19, 1171–1184.
- Plötz, P.; Schneider, U.; Globisch, J.; Dütschke, E. Who will buy electric vehicles? Identifying early adopters in Germany. Transp. Res. Part A Policy Pract. 2014, 67, 96–109.
- She, Z.-Y.; Sun, Q.; Ma, J.-J.; Xie, B.-C. What are the barriers to widespread adoption of battery electric vehicles? A survey of public perception in Tianjin, China. Transp. Policy 2017, 56, 29–40.
- Singh, V.; Singh, V.; Vaibhav, S. A review and simple meta-analysis of factors influencing adoption of electric vehicles. Transp. Res. Part D Transp. Environ. 2020, 86, 102436.
- Palmer, K.; Tate, J.; Wadud, Z.; Nellthorp, J. Total cost of ownership and market share for hybrid and electric vehicles in the UK, US and Japan. App. Energy 2018, 209, 108–119.
- Coffman, M.; Bernstein, P.; Wee, S. Electric vehicles revisited: A review of factors that affect adoption. Transp. Rev. 2017, 37, 79–93.
- Tie, L. Status analysis and development planning for the network of charging stations. Eur. J. Elec. Eng. 2018, 20, 485.
- Al-Jarboua, Z. The national energy strategy for Saudi Arabia. World Acad. Sci. Eng. Tech. 2009, 3, 501–510.
- Hafez, O.; Bhattacharya, K. Optimal design of electric vehicle charging stations considering various energy resources. Renew. Energy 2017, 107, 576–589.
- Egbue, O.; Long, S. Barriers to widespread adoption of electric vehicles: An analysis of consumer attitudes and perceptions. Energy Policy 2012, 48, 717–729.
- Narassimhan, E.; Johnson, C. The role of demand-side incentives and charging infrastructure on plug-in electric vehicle adoption: Analysis of US States. Environ. Res. Lett. 2018, 13, 74032.
- Funke, S.Á.; Sprei, F.; Gnann, T.; Plötz, P. How much charging infrastructure do electric vehicles need? A review of the evidence and international comparison. Transp. Res. Part D Transp. Environ. 2019, 77, 224–242.
- Hardman, S.; Jenn, A.; Tal, G.; Axsen, J.; Beard, G.; Daina, N.; Figenbaum, E.; Jakobsson, N.; Jochem, P.; Kinnear, N. A review of consumer preferences of and interactions with electric vehicle charging infrastructure. Transp. Res. Part D Transp. Environ. 2018, 62, 508–523.
- Chidambaram, K.; Ashok, B.; Vignesh, R.; Deepak, C.; Ramesh, R.; Narendhra, T.M.; Usman, K.M.; Kavitha, C. Critical analysis on the implementation barriers and consumer perception toward future electric mobility. Proc. Inst. Mech. Eng. Part D J. Automob. Eng. 2022, 9544070221080349.
- Quak, H.; Nesterova, N.; van Rooijen, T. Possibilities and barriers for using electric-powered vehicles in city logistics practice. Transp. Res. Procedia 2016, 12, 157–169.
- Ninh, P.; Bentzen, K.; Laugesen, M.S. Why should transportation companies join Public Private Partnership (PPP) proposed by the public sector to support the implementation process of Freight Electric Vehicles (FEVs) in Copenhagen Municipality. NSR Act. 2014, 7, 4.
- Shareef, H.; Islam, M.M.; Mohamed, A. A review of the stage-of-the-art charging technologies, placement methodologies, and impacts of electric vehicles. Renew. Sustain. Energy Rev. 2016, 64, 403–420.
- Yu, D.; Adhikari, M.P.; Guiral, A.; Fung, A.S.; Mohammadi, F.; Raahemifar, K. The Impact of Charging Battery Electric Vehicles on the Load Profile in the Presence of Renewable Energy. In Proceedings of the 2019 IEEE Canadian Conference of Electrical and Computer Engineering (CCECE), Edmonton, AB, Canada, 5–8 May 2019; pp. 1–4.
- U.S. Energy Information Administration. Saudi Arabia 2019 Primary Energy Data in Quadrillion Btu. Available online: https://www.eia.gov/international/overview/country/SAU (accessed on 21 May 2022).
- Noel, L.; Zarazua de Rubens, G.; Kester, J.; Sovacool, B. Vehicle-to-Grid: A Sociotechnical Transition beyond Electric Mobility; Palgrave Macmillan: London, UK, 2019.
- Jenkins, S.; Rossmaier, J.; Ferdowsi, M. Utilization and effect of plug-in hybrid electric vehicles in the United States power grid. In Proceedings of the IEEE Vehicle Power and Propulsion Conference, Harbin, China, 3–5 September 2008; pp. 1–5.
- Kester, J.; Noel, L.; De Rubens, G.; Sovacool, B. Promoting Vehicle to Grid (V2G) in the Nordic region: Expert advice on policy mechanisms for accelerated diffusion. Energy Policy 2018, 116, 422–432.
- Weiller, C.; Neely, A. Using electric vehicles for energy services: Industry perspectives. Energy 2014, 77, 194–200.
- Powerwall Modes. Tesla Website. Available online: https://www.tesla.com/en_gb/support/energy/powerwall/mobile-app/powerwall-modes (accessed on 21 May 2022).
- Ali, H.; Hussain, S.; Khan, H.; Arshad, N.; Khan, I. Economic and Environmental Impact of Vehicle-to-Grid (V2G) Integration in an Intermittent Utility Grid. In Proceedings of the International Conference on Smart Power & Internet Energy Systems (SPIES), Bangkok, Thailand, 15–18 September 2020; pp. 345–349.
- Sovacool, B.; Kester, J.; Noel, L.; De Rubens, G. Actors, business models, and innovation activity systems for vehicle-to-grid (V2G) technology: A comprehensive review. Renew. Sustain. Energy Rev. 2020, 131, 109963.
- EDF. All about Electric Car Batteries. 2020. Available online: https://www.edfenergy.com/electric-cars/batteries (accessed on 21 May 2022).
- Andwari, A.M.; Pesiridis, A.; Rajoo, S.; Martinez-Botas, R.; Esfahanian, V. A review of Battery Electric Vehicle technology and readiness levels. Renew. Sustain. Energy Rev. 2017, 78, 414–430.
- Lewis, M. Electric Vehicles Technology Brief, IRENA. 2017. Available online: https://www.irena.org/-/media/Files/IRENA/Agency/Publication/2017/IRENA_Electric_Vehicles_2017.pdf (accessed on 21 May 2022).
- Hensley, R.; Newman, J.; Rogers, M.; Shahinian, M. Battery technology charges ahead. McKinsey Q. 2012, 3, 5–50.
- Office of Energy Efficiency & Renewable Energy. Alternative Fuels Data Center. Available online: https://afdc.energy.gov/fuels/electricity_infrastructure.html (accessed on 21 May 2022).
- Mouli, G.R.C.; Kaptein, J.; Bauer, P.; Zeman, M. Implementation of dynamic charging and V2G using Chademo and CCS/Combo DC charging standard. In Proceedings of the 2016 IEEE Transportation Electrification Conference and Expo (ITEC), Dearborn, MI, USA, 27–29 June 2016; pp. 1–6.
- Rumale, S.; Al Ashkar, H.; Kerner, T.; Koya, F.; Eitzenberger, M. Design and Implementation of an On-Board Vehicle CHAdeMO Interface for Vehicle-to-Grid Applications. In Proceedings of the 2020 IEEE International Conference on Power Electronics, Smart Grid and Renewable Energy (PESGRE2020), Cochin, India, 2–4 January 2020; pp. 1–6.
- Badallaj, V. How Many Charging Stations for Electric-Cars Are Needed in Oslo by 2020? Department of Informatics Faculty of Mathematics and Natural Sciences, University of Oslo: Oslo, Norway, 2019.
- Battery Lifespan. National Renewable Energy Lab Report. Available online: https://www.nrel.gov/transportation/battery-lifespan.html (accessed on 21 May 2022).
- WeatherOnline. Climate of the World; Saudi Arabia. Available online: https://www.weatheronline.co.uk/reports/climate/Saudi-Arabia.htm (accessed on 21 May 2022).
- Battery Aging in an Electric Vehicle (EV). Battery University. Available online: https://batteryuniversity.com/learn/article/bu_1003a_battery_aging_in_an_electric_vehicle_ev (accessed on 21 May 2022).
- Travesset-Baro, O.; Rosas-Casals, M.; Jover, E. Transport energy consumption in mountainous roads. A comparative case study for internal combustion engines and electric vehicles in Andorra. Transp. Res. Part D Transp. Environ. 2015, 34, 16–26.
- Keyser, M.; Pesaran, A.; Li, Q.; Santhanagopalan, S.; Smith, K.; Wood, E.; Ahmed, S.; Bloom, I.; Dufek, E.; Shirk, M. Enabling fast charging–Battery thermal considerations. J. Power Sources 2017, 367, 228–236.
- Azorin-Molina, C.; Rehman, S.; Guijarro, J.A.; McVicar, T.R.; Minola, L.; Chen, D.; Vicente-Serrano, S.M. Recent trends in wind speed across Saudi Arabia, 1978–2013: A break in the stilling. Int. J. Climatol. 2018, 38, e966–e984.
- Sun, P.; Bisschop, R.; Niu, H.; Huang, X. A review of battery fires in electric vehicles. Fire Technol. 2020, 56, 1361–1410.
- Millen, S.; Page, E. Transport and Environment Statistics 2021 Annual Report; Department for Transport; UK Government: London, UK, 2021.
- Haddadian, G.; Khodayar, M.; Shahidehpour, M. Accelerating the global adoption of electric vehicles: Barriers and drivers. Electr. J. 2015, 28, 53–68.
- Fulton, L. Ownership cost comparison of battery electric and non-plugin hybrid vehicles: A consumer perspective. Appl. Sci. 2018, 8, 1487.
- Go Electric 35 Tariff. EDF Energy. Available online: https://www.edfenergy.com/electric-cars/tariffs (accessed on 21 May 2022).
- Zethmayr, J. Charge for Less: An Analysis of Hourly Electricity Pricing for Electric Vehicles. World Electr. Veh. J. 2019, 10, 6.
- Vehicle Statistic Data for 1441H. Ministry of Interior. Available online: https://data.gov.sa/Data/en/dataset/vehicle-statistics-data-for-the-year-1441-ah/resource/b25cd025-8668-4c05-aff8-f7b699a3a555 (accessed on 21 May 2022).
- Hussain, M. Saudi Arabia to set maximum limit on car ownership. Drive Arabia. 2020. Available online: https://www.drivearabia.com/news/2020/06/23/saudi-arabia-to-set-maximum-limit-on-car-ownership/ (accessed on 21 May 2022).
- Al-Fouzan, S. Using car parking requirements to promote sustainable transport development in the Kingdom of Saudi Arabia. Cities 2012, 29, 201–211.
- Enhancing Vehicles Energy Efficiency in Saudi Arabia. Saudi Energy Efficiency Center. 2018. Available online: https://theicct.org/sites/default/files/KSA_AlRoge_Enhancing%20Vehicles%20Energy%20Efficiency%20in%20Saudi%20Arabia.pdf (accessed on 21 May 2022).
- Aldubyan, M.; Gasim, A. Energy price reform in Saudi Arabia: Modeling the economic and environmental impacts and understanding the demand response. Energy Policy 2021, 148, 111941.
- Tariffs and Connection Rates. Saudi Electric Company 2021. Available online: https://www.se.com.sa/en-us/customers/Pages/TariffRates.aspx (accessed on 21 May 2022).
- Almutairi, A. Plug-in electric vehicles and their impact on power generation availability: A real survey-based analysis in Saudi Arabia. Sustain. Cities Soc. 2021, 75, 103389.
- Dubai Electricity & Water Authority. Available online: https://www.dewa.gov.ae/en/consumer/ev-community/ev-green-charger/ev-green-chargers-faq (accessed on 21 May 2022).
- Elshurafa, A.M.; Peerbocus, N. Electric vehicle deployment and carbon emissions in Saudi Arabia: A power system perspective. Electr. J. 2020, 33, 106774.
- Alquthami, T.; Alsubaie, A.; Alkhraijah, M.; Alqahtani, K.; Alshahrani, S.; Anwar, M. Investigating the Impact of Electric Vehicles Demand on the Distribution Network. Energies 2022, 15, 1180.
- Rahman, M.M.; Ghazi, G.A.; Al-Ammar, E.A.; Ko, W. Techno-Economic Analysis of Hybrid PV/Wind/Fuel-Cell System for EVCS. In Proceedings of the 2021 International Conference on Electrical, Communication, and Computer Engineering (ICECCE), Kuala Lumpur, Malaysia, 12 June 2021.
More