Your browser does not fully support modern features. Please upgrade for a smoother experience.
Please note this is a comparison between Version 1 by María-Teresa García-Conesa and Version 2 by Sirius Huang.
Tumour necrosis factor-alpha (TNF-α) is a pleiotropic molecule involved in multiple physiological and pathological mechanisms and constitutes an important target in therapies against a diversity of immunologically related disorders. In the context of obesity, a broad range of human intervention dietary studies have investigated the changes on the blood levels of TNF-α in connection with body weight changes.
- obesity
- inflammation
- interindividual variability
- TNF-α
1. The Biological Scenario of TNF-α
Tumour necrosis factor-alpha (TNF-α) is a widely investigated multifunctional cytokine that belongs to the TNF/TNFR (tumour necrosis factor receptor) superfamily. It is produced by multiple cells, primarily by circulatory and infiltrating immune cells, such as macrophages, T and B lymphocytes, natural killer cells, and monocytes, as well as by other types of cells including adipocytes, endothelial cells, muscle cells, mast cells, fibroblasts, osteoclasts [1][2][1,2] (Figure 1). The soluble trimeric form of TNF-α is activated by binding to the receptors TNFR1 and TNFR2 and triggering multiple cell-signalling transduction pathways involved in many different processes, i.e., cell proliferation and differentiation, cell death (apoptosis) and survival, and cell communication. Maintaining normal physiological levels of TNF-α is critical for health, and TNF-α itself can contribute to this process by being involved in a negative feedback regulatory mechanism between different subpopulations of T cells (effector and regulatory T cells) [3].
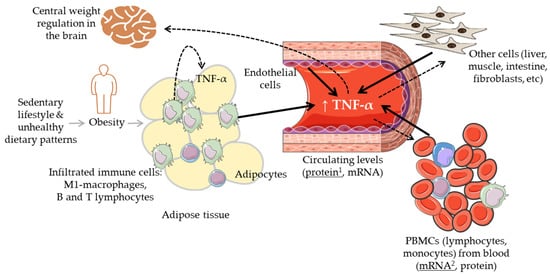
Figure 1. Graphic summary of the biological regulatory scenario of the levels of TNF-α in the context of body weight alterations. Solid black arrows indicate different cells and tissues that can contribute to the circulating levels of TNF-α; dashed arrows indicate different tissues where TNF-α can have a regulatory effect. 1: TNF-α protein levels most commonly measured in blood (serum, plasma); 2: TNF-α mRNA levels most commonly measured in peripheral blood mononuclear cells (PBMCs).
TNF-α is also a potent activator of the production of different cytokines promoting a pro-inflammatory status and thus, it has an important function in the inflammatory and immune responses. Multiple molecular and cellular mechanistic studies have pointed to the therapeutic potential of targeting the system TNF/TNFRs for the treatment of inflammatory and immune diseases [4]. In general, the long-term elevated levels of TNF-α associated with diseases such as arthritis, inflammatory bowel disease (IBD) or some specific types of cancer [5][6][7][5,6,7] can be deleterious, and the reduction in the levels of this cytokine is generally considered a beneficial anti-inflammatory effect. Thus, anti-TNF-α therapy has been successfully applied to combat some of these diseases even though it can also have some serious adverse effects [8].
It is now also clear that TNF-α has an impact on healthy metabolism as well as on metabolic diseases, particularly, on obesity-linked glucose metabolism and insulin resistance (IR) [9]. Increased levels of TNF-α have been linked with obesity and the associated low-grade chronic inflammatory status as well as with the derived cardiometabolic disorders [10][11][10,11]. Inversely, the reduction in body weight has been associated with a decrease in the levels of this and other cytokines [12]. Intriguingly, TNF-α also relates to metabolic dysfunctions such as anorexia and cachexia which share with obesity overlapping inflammatory mediators and IR but opposite relationship with fat mass [13][14][15][13,14,15]. Further, the use of anti-TNF-α antibodies (adalimumab, certolizumab, infliximab, etanercept) against some inflammatory diseases (e.g., IBD, Crohn’s disease, rheumatoid arthritis, psoriatic arthritis, spondyloarthritis) has produced contrasting results with some studies reporting increases in body mass index (BMI) and other anthropometric parameters upon treatment [16][17][18][16,17,18]. Overall, the mechanisms explaining the relationship between TNF-α, body weight changes, and metabolic disorders are not yet clear. It remains thus essential to clearly understand and establish the relevance of the levels of TNF-α and of its modulation (size and direction of its fluctuation) in the context of lean physiology and increased body weight (overweight/obese) conditions. Different sets of immune cells infiltrated into metabolic organs such as the adipose or the liver tissues regulating, at least partly, the balance between metabolic homeostasis and dysfunction (Figure 1). In obesity, the accumulation of fat and enlargement of adipocytes contribute to the dysfunctionality of these cells as well as that of endothelial cells and macrophages (M1-polarized macrophages), increasing the secretion of a range of adipokines including TNF-α [2]. These elevated levels of TNF-α have been associated with impaired insulin signalling [19], and altered lipid metabolism (lipolysis/lipogenesis) [1]. It has also been indicated that TNF-α may lead to weight loss by interfering with central weight regulation in the brain through the stimulation of anorexigenic neuropeptides release as well as by influencing catabolic processes in peripheral muscle cells [17].
2. TNF-α Levels in Lean, Overweight and Obese Individuals
A good diagnostic biomarker has been defined as one that allows for the differentiation between the conditions under investigation (health and disease), and for identifying an individual within one of those conditions [20]. When reporting the responses of a biomarker to any treatment, i.e., dietary or drug intervention, it is thus essential to try to describe and understand the relevance of the response (both size and direction of change) within the context of the interindividual variability but also taking into consideration the differences in the values between the investigated conditions.
A number of human studies carried out between 1995 and 2022 were examined, where the circulatory levels of TNF-α were determined in lean, overweight, and obese individuals [21][22][23][24][25][26][27][28][29][30][31][32][33][34][35][36][37][38][39][40][41][42][43][44][45][21,22,23,24,25,26,27,28,29,30,31,32,33,34,35,36,37,38,39,40,41,42,43,44,45]. All these data were examined and compared in an attempt to visualize the difference in the levels of TNF-α between these metabolic conditions, and to assess whether this difference could be used with sufficient reliability to clearly differentiate between lean, overweight and obese individuals. The levels of TNF-α were most commonly reported in pg/mL and as the mean values ± standard deviation (SD) for lean, overweight, and obese individuals. The coefficient of variation (CV%) was estimated (using the standard formula as follows: (CV%) = (Standard Deviation/Mean) × 100) for each of the different subgroups in every study. A summary of the intragroup variability and levels of circulatory TNF-α in lean, overweight, obese, and very obese individuals as reported in the different human studies examined in thereinis review is displayed in Table 1.
Table 1. Summary of the data on intragroup variability and levels of circulatory TNF-α in lean, overweight, obese, and very obese individuals as reported in the different human studies.
| Phenotype | CV% 1 (Range) | Most Commonly CV% Values (Range) |
TNF-α Levels (Range) |
Most Commonly Reported TNF-α Levels (Range) |
|---|---|---|---|---|
| Lean | (12%, ≥100%) | (≈30%, 50%) | (0.09, 82.3 pg/mL) | (≈2.0, 6.0 pg/mL) |
| Overweight | (37%, >100%) | (≈35%, 50%) | (0.09, 30.0 pg/mL) | (≈3.0, 6.5 pg/mL) |
| Obese | (11%, >100%) | (≈30%, 90%) | (0.11, 294.0 pg/mL) | (≈1.0, 10.0 pg/mL) |
| Very obese 2 | (21%, >100%) | (≈30%, 90%) | (1.3, 713.0 pg/mL) | (≈5.0, 10.0 pg/mL) |
1: CV% = (Standard Deviation/Mean) × 100; 2: This group includes participants classified as very obese, class II and III obesity, and morbidly obese.
The results show that the CV% values were typically >30% and, in some cases, well above 100%, for the lean, overweight and obese subpopulations, indicating a rather high relative intragroup variation. The data also show that the circulating levels of TNF-α displayed a very high between-studies variability. In the lean individuals, reported values expanded from <1.0 pg/mL to ~80 pg/mL; however, in most cases, the values were found in the range 2.0–6.0 pg/mL (Table 1). In general, most of the investigated studies reported higher levels of TNF-α in the overweight, obese, and/or very obese subgroups than in the lean participants. However, the differences were (S) in some studies [23][24][25][26][27][30][33][34][35][36][37][38][40][42][23,24,25,26,27,30,33,34,35,36,37,38,40,42] and not significant (NS) in others [21][22][28][29][31][38][39][44][45][21,22,28,29,31,38,39,44,45]. Also, the magnitude of the difference was highly variable. For example, in Polish women, the levels of TNF-α varied significantly (p < 0.001) from 2.9 ± 2.2 pg/mL in the lean participants to 6.5 ± 3.1 pg/mL in overweight individuals, 6.8 ± 3.1 pg/mL in participants with obesity, and 7.4 ± 2.6 pg/mL in very obese participants [23]. In another study also conducted in Polish women, the differences reported between lean and obese participants were 4.5 ± 2.3 pg/mL and 8.8 ± 7.0 pg/mL, respectively (p < 0.05) [30]. In a sample population from Israel [24], the difference found between obese and non-obese participants was also very significant, but the levels of the cytokine were much smaller (1.0 ± 0.8 pg/mL vs. 0.3 ± 0.3, p < 0.001). As an example of (NS) but substantial differences between individuals, in a sample population of Spanish women, the levels of TNF-α ranged from 5.7 ± 9.8 pg/mL in lean participants to 11.6 ± 19.0 pg/mL in obese ones, and 8.6 ± 12.4 pg/mL in very obese participants [22]. In addition, a few studies also reported lower levels in the overweight/obese participants than in the lean ones [32][41][43][32,41,43]. Likewise, a study conducted in a sample mixed population in the USA indicated that the levels of TNF-α were 0.8 ± 7.2 pg/mL in the obese participants and 82.3 ± 89 pg/mL in the lean ones [32].
Overall, the percentage of change from lean to overweight or obese subgroups varied from a (NS) 2% increase [41] up to a maximum increase of ~1700% in some morbidly obese individuals [37], although most increases oscillated between ~20% and ~200%. The levels of TNF-α in the overweight subgroups ranged from <1.0 pg/mL up to 30 pg/mL, and in obese participants, from <1.0 pg/mL up to 294 pg/mL. In these two groups, however, most values oscillated between ≈3.0 and 6.5 pg/mL in overweight individuals and between ≈1.0 and 10 pg/mL in the obese subjects (Table 1). Participants categorized as very obese also exhibited highly variable levels of TNF-α ranging from ~1.0 pg/mL up to values as high as 713 pg/mL (Table 1). Further, the combination of being overweight or obesity with an additional disorder such as Type 2 Diabetes mellitus (T2D), Metabolic Syndrome (MetS) or Polycystic Ovary Syndrome (PCOS) did not appear to critically modify the levels of this cytokine with values also varying between <1.0 pg/mL up to 20 pg/mL.
The overall scenario regarding the circulatory levels of TNF-α in humans shows a large intra- and between studies variability with several hundred- and, even up to several thousand-fold differences within the values attributed to each specific group of individuals. Many of the studies included herein reported an increase in the levels of this cytokine in the overweight/obese sample populations as compared to the lean ones, and the general message conveyed is that there is an association between increased body weight and increased levels of the cytokine. Yet, looking at all the data gathered here, it was not possible to designate clear-cut ranges of TNF-α values that differentiated between lean, overweight and obese individuals, and/or to discern any clear tendency between TNF-α levels and body weight. The majority of the reported values for circulating levels of TNF-α ranged between ~1.0 and 10.0 pg/mL, with apparent independence of the body weight category posing some reasonable doubts on the potentiality of TNF-α as a biomarker to differentiate between body weight conditions.