Your browser does not fully support modern features. Please upgrade for a smoother experience.
Please note this is a comparison between Version 1 by Reinald Pamplona and Version 3 by Amina Yu.
Decreased content and activity of the mechanistic target of rapamycin (mTOR) signalling pathway, as well as the mTOR complex 1 (mTORC1) itself, are key traits for animal species and human longevity. Since mTORC1 acts as a master regulator of intracellular metabolism, it is responsible, at least in part, for the longevous phenotype. Conversely, increased content and activity of mTOR signalling and mTORC1 are hallmarks of ageing. Additionally, constitutive and aberrant activity of mTORC1 is also found in age-related diseases such as Alzheimer’s disease (AD) and cancer. The downstream processes regulated through this network are diverse, and depend upon nutrient availability.
- mTORC1
- longevity
- metabolism
1. Introduction
The mechanistic (or mammalian) target of the rapamycin (mTOR) signalling pathway is one of the most studied intracellular networks, regulating the ageing and longevity processes. Its description is closely related to the discovery of the antifungal rapamycin, which was isolated from Streptomyces hygroscopius in the late 1970s. Immunosuppressant and antitumor activities were attributed to rapamycin before its mechanism of action was understood. In the 1990s, the genes codifying the putative targets of rapamycin in yeast (target of rapamycin (TOR) 1 and TOR2) were identified, but it wasn’t until 1994 that the mammalian homolog was isolated from mammalian cells [1].
mTOR is a member of an evolutionarily conserved group of serine/threonine kinases from the phosphatidyl-inositol-3 kinases (PI3K)-related kinase family that is present as two distinct complexes: mTOR complex 1 (mTORC1) and mTOR complex 2 (mTORC2) [2]. It has been suggested that mTORC1 and 2 regulate different processes. In fact, mTORC1 is sensitive to rapamycin, and its inhibition has been widely associated with an extended longevity and age-related processes. Therefore, most scientific efforts have been directed towards studying this complex. However, in recent years, mTORC2 has also been an aim ofocused study, and its integrity has recently been suggested to regulate longevity in worms [3].
mTORC1 plays a central role in the highly conserved mTOR signalling network, which integrates intracellular and extracellular signals to regulate cell physiology and metabolism [4]. The downstream effectors of mTOR regulate multiple processes, including mRNA translation, protein and lipid biosynthesis, mitochondrial function and biogenesis, stress responses, and autophagy, among others [2][4][5][6][7][8][9][2,4,5,6,7,8,9]. Briefly, under favourable conditions for cell growth, mTORC1 is activated and promotes anabolic processes. Conversely, when nutrient availability is scarce, mTOR is not activated, and catabolic processes are induced in order to feed the cells and maintain proper energy levels.
2. The Structure and Regulation of the mTORC1
Biochemical studies and cryo-electron microscopy allowed the description of the mTORC1 structure, which is defined as a giant complex weighing 1 MDa [10]. In mammals, the core of mTORC1 forms a symmetric dimer of an heterotrimer consisting of the mTOR itself, Raptor (regulatory associated protein of TOR) and mLST8 (mammalian lethal with SEC13 protein 8) [2] (Figure 1). These core elements of the mTORC1 are associated with inhibitory subunits, such as Deptor (DEP domain-containing mTOR-interacting protein) and PRAS40 (Proline-rich AKT1 substrate of 40 kDa). Deptor physically interacts with mTOR, inhibiting either mTORC1 or mTORC2 [11]. PRAS40 is a polypeptide that binds to Raptor, and thus it is commonly stably associated with mTORC1, which is repressed [10]. However, under certain conditions, PRAS40 is phosphorylated and separated from mTORC1, which is released from its inhibitory regulation. FKBP12 (FK506 binding protein) is a regulatory subunit of the rapamycin-sensitive mTORC1 activity. Importantly, Raptor and mTOR regulators PRAS40 and FKBP12 are exclusive to mTORC1.
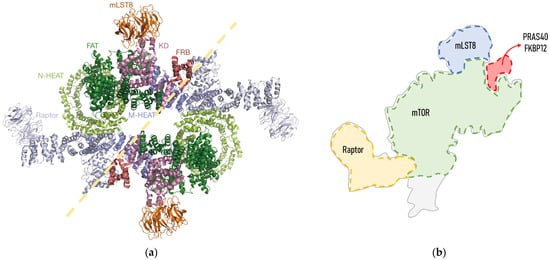
Figure 1. Structure of human mTORC1: (a) Cryo-electron microscopy structure obtained from Yang et al., 2018. mTORC1 forms a symmetric dimmer of an heterotrimer consisting of mTOR itself, Raptor and mLST8. The mTOR structure consists of N-terminal HEAT repeats (N-HEAT), an FATD (Frap, ATM, TRRAP domain), an FRBD (FKBP12-rapamycin binding domain) and a C-terminal kinase domain (KD). Each of the domains and subunits are indicated in different colours; (b) schematic representation of an mTORC1 heterotrimer and expected binding site of its regulators FKBP12 and PRAS40, adapted from [12][13][12,13]. FKBP12 binds to mTOR through its FRBD. The PRAS40 binding domain is structurally very close to that of FKBP12, as it binds to an α-helix from the FBD and to mLST80.
The regulation of mTORC1 is complex, and occurs at two levels: their upstream effectors and within mTORC1 itself. The upstream regulation of mTORC1 depends upon both extra- and intracellular signals. Specifically, extracellular signals include nutrient availability (e.g., glucose or trophic factors such as insulin), amino acids (e.g., leucine and arginine), and oxygen, whereas high energy demands (low ATP/ADP ratio) and metabolism intermediates (e.g., methionine and related metabolites) are sensed inside the cells [2][14][15][2,14,15]. These signals are transduced through multiple proteins and protein complexes, which are regulated through different phosphorylation patterns, finally activating mTORC1.
Notably, within mTORC1 there are also specific modifications that are characteristic of active mTORC1. In fact, multiple mTOR phosphorylation sites have been described, with the activating phosphorylation of Ser2448 and Thr2446 via Akt being the most commonly used. However, mTOR phosphorylation at Ser2448 and Thr2446 via S6K1 and AMPK can be inhibitory [16]. In fact, mTORC1 mutations at Ser2448 do not prevent the phosphorylation of its downstream effector S6K1, and deletion of Ser2448 surrounding amino acids lead to mTORC1 hyperactivation [17], revealing the complexity of phosphorylation in mTORC1 activity regulation. Other phosphorylation sites of mTOR are reviewed in [16]. Fewer phosphorylation sites have been described for PRAS40, which can be phosphorylated at Thr246 via AKT [18], but also at Ser183 and Ser221 via mTOR [19]. The phosphorylation of PRAS40, either via AKT or mTOR, leads to its dissociation from mTORC1, which is released and active [20]. Given this complexity, multiple phosphorylation patterns regulate mTORC1. For instance, phosphorylated mTOR at Ser2448 and dephosphorylated PRAS40 (at Thr246) results in an active mTORC1, whereas dephosphorylated mTOR (at Ser2448) and phosphorylated PRAS40 (at Thr246) lead to an inactive mTORC1 [14].
Finally, active mTOR promotes the induction of anabolic processes, such as lipid and protein biosynthesis, for maintaining proper cellular structure and function and mitochondrial biogenesis and metabolism, in order to fulfil the energetic requirement to maintain biosynthetic processes. Conversely, when cells are exposed to scant nutrient availability or hypoxic conditions, mTOR is not activated, and catabolic processes such as autophagy and the inhibition of biosynthetic processes are promoted in order to feed the cell and maintain proper energetic levels. Recent evidence points to the existence of a regulatory loop through which autophagy, after the recycling of cellular components, leads to the reactivation of mTORC1 [21].
3. mTORC1 and Longevity
Reduced mTOR signalling has been widely associated with longevity [2] (Table 1). In fact, apart from having a role in determining species longevity, the mTOR signalling pathway seems to be a key determinant of individual longevity [5]. Accordingly, reduced activity of the mTOR signalling network has been reported in tissues from exceptionally long-lived rodents [22][23][22,23], whales [24], and other mammals [25].
Table 1. Relationship between mTOR and maximum longevity (ML) in basal conditions: interspecies studies. Increased or reduced mTOR content can refer to transcript content, gene expression, protein content, protein phosphorylation, or activity after insulin stimulation. Letters refer to: maximum longevity (ML), in years; female (F); male (M); not determined (n.d.). Symbols refer to: * Studies in which mTORC1 itself expression, content or phosphorylation was evaluated; # Studies in which mTORC1 itself was not evaluated but its upstream or downstream effectors were.
| Species (ML) | Sex | ML Range | mTORC1 | Tissue | Phenotype | Ref. |
|---|---|---|---|---|---|---|
| Ames dwarf mice (5) vs. Wild type mice (3.5) |
F | 3.5 to 5 | Reduced # | Liver, skeletal muscle | Longevous | [22] |
| Naked mole rat (37) vs. Wild type mice (3.5) |
F | 3.5 to 30 | Reduced # | Liver | Longevous | [23] |
| 8 mammals | M | 3.5 to 46 | Reduced * | Heart | Longevous | [14] |
| 26 mammals | n.d. | 2.1 to 37 | Reduced * | Brain, heart, liver, kidney, lung and limb | Longevous | [25] |
| Human | M/F | 89 to 102 | Reduced * | Whole blood | Longevous | [26] |
Molecular adaptations in the mTOR signalling pathway leading to an enhanced longevity seem not only to be restricted to the global mTOR signalling network, but also to mTORC1 itself (Figure 2). In fact, the existence of a longevity-associated mTORC1 genomic, proteomic and metabolomics profile in the hearts of mammals has been recently described [14], and is characterised by reduced gene expression and protein content of mTORC1 subunits and activators. Specifically, the authors reported a reduced content of mTOR and Raptor, and identified phosphorylation patterns in mTOR and PRAS40 that might be consistent with a reduced mTORC1 activity in long-lived species. These results are supported by recently published transcriptomics data [25], and extend to other mammalian tissues. Again, the longevity-associated phenotype was associated with reduced mTORC1 core elements, such as mtor and rptor; downstream effectors such as rps6kb1 (S6K1); and its negative regulators akt1s1 (PRAS40) and fkbp1a (FKBP12). Accordingly, reduced mRNA content of rptor (Raptor) and mTORC1-negative regulators, such as akt1s1 (PRAS40), was found in blood from nonagenarians [26]. In addition, the offspring of those long-lived individuals have reduced rptor gene expression, which has emerged as a potential biomarker of familial longevity [26]. Altogether, these results suggest that not only protein content and gene expression mTORC1 core elements, but also that its regulatory factors are reduced in long-lived species and individuals.
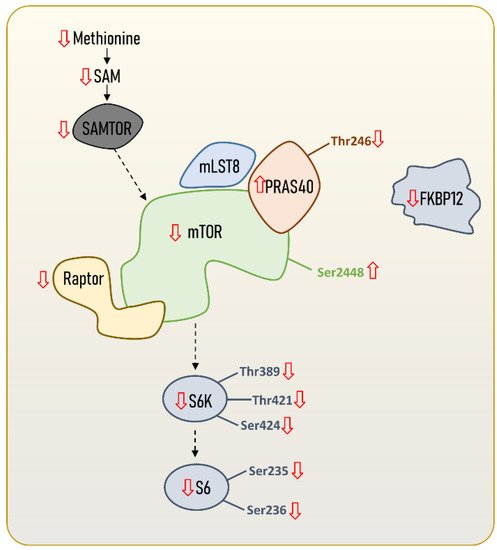
Figure 2. mTORC1 content and regulation in long-lived animal species, including humans. Steady-state levels of mTORC1 core elements and regulators are downregulated in long-lived species compared to short-lived ones. The content and regulation of other mTORC1 downstream proteins and transcript factors different from S6K and S6 are not included, since no data are available. However, scientific evidence suggests that there might also be specific regulations in downstream proteins or transcriptional factors targeting autophagy (e.g., ATG13, ULK1), mitochondrial biogenesis (e.g., PGC1α), lipids (e.g., SRBEP1, Lipin1, PP2A) and protein metabolism (e.g., 4E-BP1). Increased or reduced content of mTORC1 core elements and regulators can refer to either transcript content, gene expression, protein content, or metabolite content.
Experimental regulation of mTOR signalling or mTORC1 content itself, through the generation of genetically modified animal models, affects longevity (Table 2). In fact, the genetic inhibition of upstream regulators [27][28][27,28], downstream effectors [29][30][29,30], or mTORC1 components themselves [27][31][32][33][34][27,31,32,33,34] leads to a reduced mTORC1 content and increased longevity in invertebrate [27][31][32][27,31,32] and mice models [28][29][30][33][34][28,29,30,33,34]. In addition, in rodents, reduced mTORC1 content leads to an improved health span [28][29][30][28,29,30] and delayed ageing [34]. In contrast, mTOR activation shortens longevity [1][6][8][1,6,8] and leads to altered behaviour and neuronal function in rodents [35]. Taken together, these studies support the idea that reduced mTORC1 content and activity, as well as its integrity, play central roles in longevity determination and enhanced health span.
Table 2. Genetic interventions directed toward modifying the mTORC1 or mTOR signalling pathways. Genetic interventions refer to: heterozygous knockout (−/−), homozygous knockout (+/−), dominant-negative (d), hypomorphic (Δ/Δ), overexpression (gene), and human isoform (h). Increased or reduced mTOR content can refer to transcript content gene expression, protein content, protein phosphorylation, or activity after insulin stimulation. Longevity refers to percentage of maximum longevity (ML), in years. Letters refer to female (F); male (M); not determined (n.d.). Symbols refer to: * Studies in which expression, content, or phosphorylation of mTORC1 itself were evaluated; # Studies in which mTORC1 itself wasn’t evaluated, but its upstream or downstream effectors were. † Refers to percentage of change in average longevity (AL), in years.
| Species | Sex | Genotype | mTORC1 | Tissue | Phenotype | Longevity | Ref. |
|---|---|---|---|---|---|---|---|
| Worm | - | daf-15−/− | Reduced # | Whole | n.d. | +28% | [31] |
| Worm | - | let-363−/− | Reduced * | Whole | n.d. | +250% | [32] |
| Fly | M | dTOR | Reduced # | Whole | n.d. | +22–24% | [27] |
| Fly | M | dS6K | Reduced # | Whole | n.d. | +22–24% | [27] |
| Fly | M | Tsc1/Tsc2 | Reduced # | Whole | n.d. | +12–14% | [27] |
| Mouse | F | hTsc1 | Reduced # | Heart, liver, kidney, skeletal muscle |
Improved health |
+12.3% | [28] |
| Mouse | F | mtor+/−mlst8+/− | Reduced * | Liver | n.d. | +14.4 | [33] |
| Mouse | F | mTORΔ/Δ | Reduced * | Heart, liver, kidney, brain |
Delayed ageing |
+19% † | [34] |
| Mouse | M | mTORΔ/Δ | Reduced * | Heart, liver, kidney, brain |
Delayed ageing |
+22% † | [34] |
| Mouse | F | s6k1−/− | Reduced # | Liver, thymus, fibroblasts |
Improved health |
+19% | [29][30][29,30] |
| Mouse | n.d. | fkbp12−/− | Increased * | Hippocampus | Altered behaviour and neuronal function |
n.d. | [35] |
The evolution of longevity occurred through mTOR regulation. These adaptations evolved by maintaining lowered steady-state levels of mTORC1 content or activity [14][25][26][33][34][14,25,26,33,34], reducing the content of mTORC1 upstream regulators [14][25][26][28][14,25,26,28], or lowering the activation of its downstream effectors [14][22][23][25][29][30][14,22,23,25,29,30]. Furthermore, these regulations operate at all expression levels, either genes [14][25][26][14,25,26], proteins [14][22][23][14,22,23], or metabolites [14]. Apart from the metabolic effects resulting from a reduced pathway activity, reduced mTORC1 is essential to maintaining its integrity [35].