Tautomerism is typically the relocation of a light atom, often hydrogen, at the same time as a rearrangement of the electronic structure. Typical examples are acetylacetone and acetone. This entry gives a short introduction to how to
This entry gives a short introduction to how to
detect and describe a tautomeric equilibrium using Nuclear Magnetic Resonance (NMR). Typical parameters used are chemical shifts (
and describe a tautomeric equilibrium using Nuclear Magnetic Resonance (NMR). Typical parameters to be used are chemical shifts (
1
H,
13
C,
15
N,
19
F and
17O) one-bond coupling constants and isotope effects on chemical shifts.
O) one bond couplings and isotope effects on chemical shifts
- Tautomeric equilibria
- NMR
- chemical shifts
- coupling constants
- isotope effects
1. Introduction
Tautomerism detected by NMR
Submitted by Poul Erik Hansen
- Introduction
Tautomerism is typically the relocation of a light atom, often hydrogen, at the same time as a rearrangement of the electronic structure. Typical examples are acetylacetone and acetone. In the latter molecule a keto-enol equilibrium is present (Fig. 1), but the enol form is in a very low amount and not “visible”.
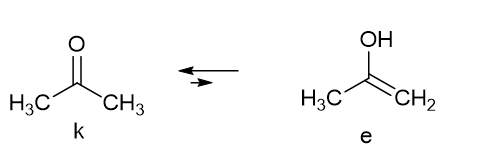
Tautomerism is typically the relocation of a light atom, often hydrogen, at the same time as a rearrangement of the electronic structure. Typical examples are acetylacetone and acetone. In the latter molecule a keto-enol equilibrium is present (Figure 1), but the enol form is in a very low amount and not “visible”.
Fig. 1. Acetone tautomeric equilibrium
In the case of acetylacetone (as a representative of the broader group of β-diketones) two equilibria takes place, a keto-enol one, which is slow at the NMR time scale (which means that separate resonances from the two tautomers can be observed) and a fast movement of the enol proton from one oxygen to the other
Figure 1. Acetone tautomeric equilibrium.
(Fig. 2).
In the case of acetylacetone (as a representative of the broader group of β-diketones) two equilibria takes place, a keto-enol one, which is slow at the NMR time scale (which means that separate resonances from the two tautomers can be observed) and a fast movement of the enol proton from one oxygen to the other
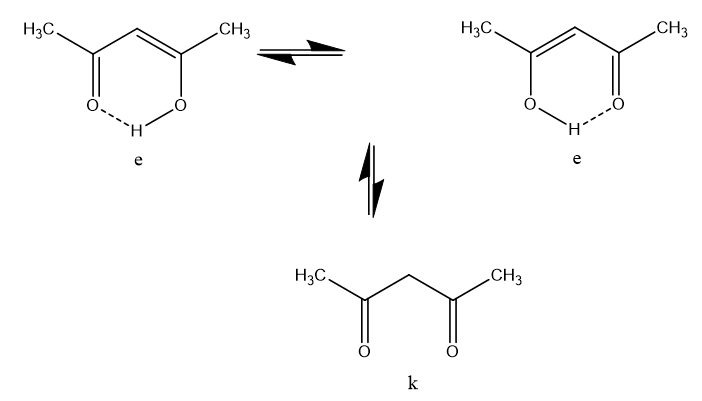
Fig. 2. Tautomeric species of acetylacetone
Figure 2. Tautomeric species of acetylacetone.
This latter equilibrium is very fast (the barrier is very low). It is not visible as such, but can be inferred from the fact that the two methyl resonances have the same chemical shift (see Figure 3). However, this is not the case in unsymmetrical cases. It is already clear that it can be difficult to detect the presence of an equilibrium. Could other spectroscopic techniques be useful? Yes, Infra Red spectroscopy is usually fast enough to detect the two tautomers and so is UV-VIS spectroscopy. However, Infra Red spectra of tautomeric compounds with two or more forms become very complex to interpret and for UV-VIS both forms may not have suitable chromophores. NMR clearly suffers from being a “slow” technique and will typically only provide average chemical shifts and coupling constants.
This latter equilibrium is very fast (the barrier is very low). It is not visible as such, but can be inferred from the fact that the two methyl resonances have the same chemical shift (see Fig. 3). However, this is not the case in unsymmetrical cases. It is already clear that it can be difficult to detect the presence of an equilibrium. Could other spectroscopic techniques be useful? Yes, Infra Red spectroscopy is usually fast enough to detect the two tautomers and so is UV-VIS spectroscopy. However, Infra Red spectra of tautomeric compounds with two or more forms become very complex to interpret and for UV-VIS both forms may not have suitable chromophores. NMR clearly suffers from being a “slow” technique and will typically only provide average chemical shifts and coupling constants.
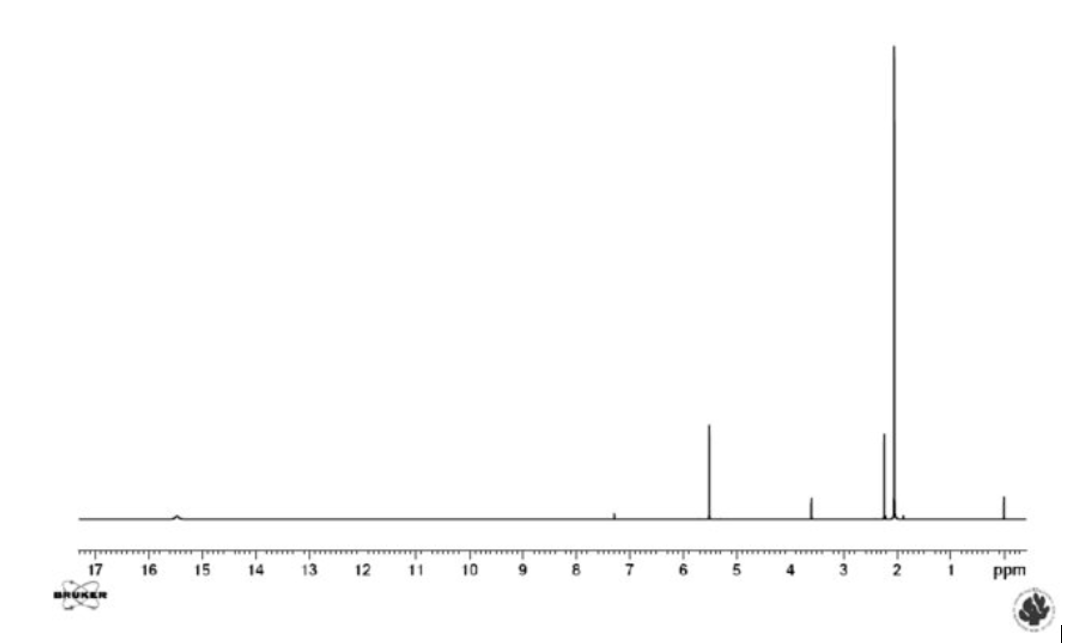
Figure 3.
Fig. 3.
1
H NMR spectrum of acetylacetone in CDCl
3
. The resonances belonging to the keto form are those at 3.6 and 2.2 ppm.
Using NMR we are concentrating on chemical shifts, coupling constants and isotope effects on chemical shifts and temperature can be of additional help. Furthermore, as we often only observe an average signal, it is very useful to know the parameters of both tautomers. Density Functional Theory (DFT) calculations may be of great help. It is important that tautomeric equilibria can occur both in solution and in the solid state. [1]
Chemical shifts primarily used in tautomeric studies are
1
H,
13
C,
15
N and
19
F (if present) and to a much lesser degree
17
O. Common for the latter four nuclei is a very large chemical shift range.
2.
2.1
1
H and
13C Chemical Shifts
C chemical shifts
1
H is especially interesting when looking at XH protons (X=O, N or S) and when a large chemical shift difference is present between the two tautomers. A case is β-thioxoketones in which a large chemical shift difference is found between OH and SH chemical shifts, as well as large chemical shift differences between
13C chemical shifts of C=S and CSH exist (see Table 1). Furthermore, large equilibrium isotope effects are also seen in this type of tautomeric equilibrium (see later). However, one may easily make mistakes as in the present case by only assuming the traditional two types of tautomers (A and B of Figure 4). It turns out that also an open form with the SH not hydrogen bonded does exist (form C of Figure 4). [2]
C chemical shifts of C=S and CSH exist (see Table 1). Furthermore, large equilibrium isotope effects are also seen in this type of tautomeric equilibrium (see later). However, one may easily make mistakes as in the present case by only assuming the traditional two types of tautomers (A and B of Fig. 4). It turns out that also an open form with the SH not hydrogen bonded does exist (form C of Fig. 4). [2]
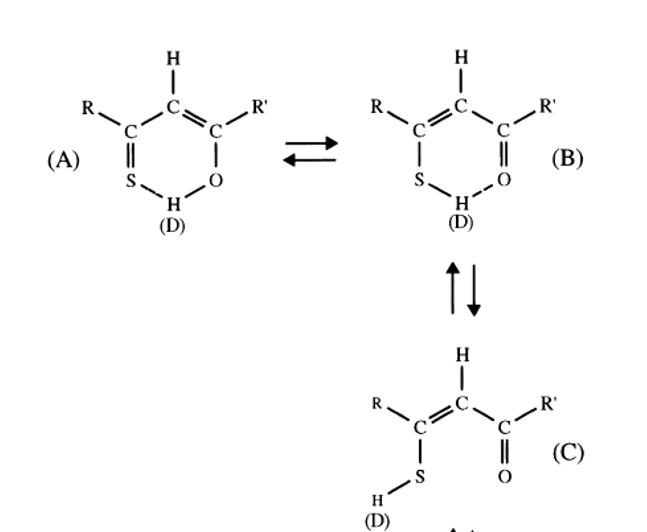
Figure 4. β-thixoketones. With R and R` equal to CH
Fig. 4. β-thixoketones. With R and R` equal to CH
3 it is thioacetylacetone. D is referring to deuteriation (see isotope effects).
it is thioacetylacetone. D is referring to deuteriation (see isotope effects).
Table 1. Chemical shifts of thioacetylacetone from Ref. 2.
Table 1. Chemical shifts of thioacetylacetone from Ref. 2.
|
|
δCS |
δCSH |
δCO |
δCOH |
δOH |
δSH |
|
A |
217 |
|
|
186 |
15.2 |
|
|
B |
|
163 |
198 |
|
|
6a |
|
C |
|
158 |
193 |
|
|
3.32 |
|
|
δCS |
δCSH |
δCO |
δCOH |
δOH |
δSH |
|
A |
217 |
|
|
186 |
15.2 |
|
|
B |
|
163 |
198 |
|
|
6a |
|
C |
|
158 |
193 |
- Estimated by comparison with model compounds
- Estimated by comparison with model compounds
|
|
3.32 |
It is of course important to know the chemical shifts of the two tautomers. Chemical shifts for one of the two can normally be obtained from solid state NMR spectra. [3] Model compounds have also been suggested, but in that case the monitoring atom has to be far from the site of tautomeric action.
It is of course important to know the chemical shifts of the two tautomers. Chemical shifts for one of the two can normally be obtained from solid state NMR spectra. [3] Model compounds have also been suggested, but in that case the monitoring atom has to be far from the site of tautomeric action.
[4] The chemicals shifts of both tautomeric species may be estimated from theoretical calculations (see later).
[4] The chemicals shifts of both tautomeric species may be estimated from theoretical calculations (see later).
3.
2.2
19F Chemical Shifts
F chemical shifts.
The very large chemical shift range of
19
F makes it well suited for detecting of tautomeric equilibria. A good example is fluorosubstituted
o-hydroxyazo compounds (see Figure 5). [4]
-hydroxyazo compounds (see Fig. 5). [4]
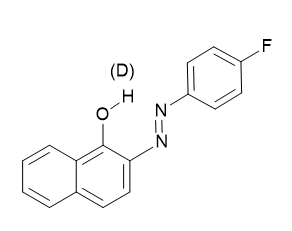
Figure 5. Only one tautomer is shown. For deuterium isotope effects on
Fig. 5 . Only one tautomer is shown. For deuterium isotope effects on
19F chemical shifts see later.
F chemical shifts see later.
Other examples are fluorosubstituted fuchsones and benzaurins [5] or fluoro-X-benzofurans. [6]
Other examples are fluorosubstituted fuchsones and benzaurins [5] or fluoro-X-benzofurans. [6]
Also
13
C-
19F coupling constants may be used in the characterization of tautomeric systems.[7] This is building on the fact the one-bond C-F coupling depend strongly on the double character of the C-F bond.
F coupling constants may be used in the characterization of tautomeric systems.[7] This is building on the fact the one-bond C-F coupling depend strongly on the double character of the C-F bond.
4.
2.3 17
O Chemical Shifts
O chemical shifts
The
17O resonances suffer from broad lines, but this is normally compensated by the very large chemical shift range. [8] Examples of b-diketones and 1,8-dihydroxy2-acetyl, 3,6-dimethylnaphthalene are given in Ref. [9]
O resonances suffer from broad lines, but this is normally compensated by the very large chemical shift range. [8] Examples of b-diketones and 1,8-dihydroxy2-acetyl, 3,6-dimethylnaphthalene are given in Ref. [9].
5. Coupling Constants
- Coupling constants
A much used parameter is the
A much used parameter is the 1J(N,H) in nitrogen containing compounds with an NH motif. This type of coupling is typically around 90 Hz. [1
J(N,H) in nitrogen containing compounds with an NH motif. This type of coupling is typically around 90 Hz. [10]
0] 1J(N,H) can be used in all compounds containing an NH group taking part in tautomerism. A typical examples is “
o-hydroxy Schiff bases” see Figure 6. [10]
-hydroxy Schiff bases” see Fig. 6. [10]
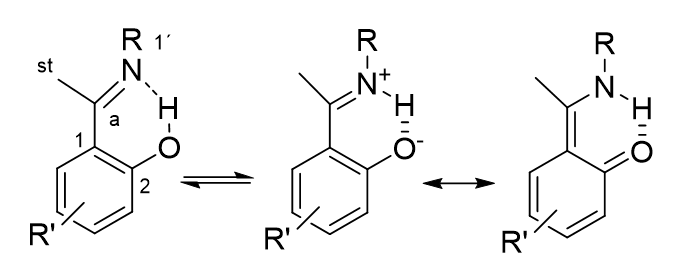
Figure 6.
Fig. 6.
o
-Hydroxy Schiff bases.
A typical problem to consider is NH exchange with the surrounding leading to too small coupling constants. Temperature studies may be helpful in eliminating this problem. For cases in which suitable model compounds are not available,
A typical problem to consider is NH exchange with the surrounding leading to too small coupling constants. Temperature studies may be helpful in eliminating this problem. For cases in which suitable model compounds are not available, 1J(N,H) can be predicted based on calculated NH bond lengths. [11
J(N,H) can be predicted based on calculated NH bond lengths. [11]
6. Isotope Effects on Chemical Shifts
- Isotope effects on chemical shifts
Two types of isotope effects on chemical shifts, primary and secondary can be applied. They are defined as follows in case of deuterium as the isotope : primary ,
P
ΔH(D) = δH-δD and secondary,
n
ΔX(D) = δX(H)-δX(D). n is the number of bonds between the deuterium and the atom in question, X. The most common isotope to be used is deuterium, as also indicated in the definition. In case of an equilibrium, the isotope effects are different from the so called intrinsic isotope effects, which are found in “static” cases.
6.1. Equilibrium Isotope Effects
4.1 Equilibrium isotope effects
The definition of the equilibrium isotope effects is expressed as:
ΔX
H(D)
x (δC
M
- δC
PT
) in which ΔX
H(D
is the change in the equilibrium upon deuteriation. The full equation was given early on by Bordner
et al.
[12] :
ΔC(D) = (δCA - δCB ) x (a - aD ) + [aD x ΔCA(D)i + (1- aD ) x ΔCB(D) i] Eq.1
The first term in this equation corresponds to the equilibrium isotope effect, whose magnitude depends on the change in the position of equilibrium (a - a
D
) due to substitution of H by D and on the difference in the magnitude of the chemical shifts of the given carbon in the A and B forms. The second term represents the direct effect of the isotopic substitution on the chemical shifts (intrinsic isotope effect, ΔC(D)
i ). The equilibrium term is a consequence of the potential energy diagram Figure 7. Deuteriation will in a double well potential lead to a change in the equilibrium. This means that the chemical shift difference comes into play multiplied with the change in the equilibrium upon deuteriation (see Eq. 1)
). The equilibrium term is a consequence of the potential energy diagram Fig. 7. Deuteriation will in a double well potential lead to a change in the equilibrium. This means that the chemical shift difference comes into play multiplied with the change in the equilibrium upon deuteriation (see Eq. 1)
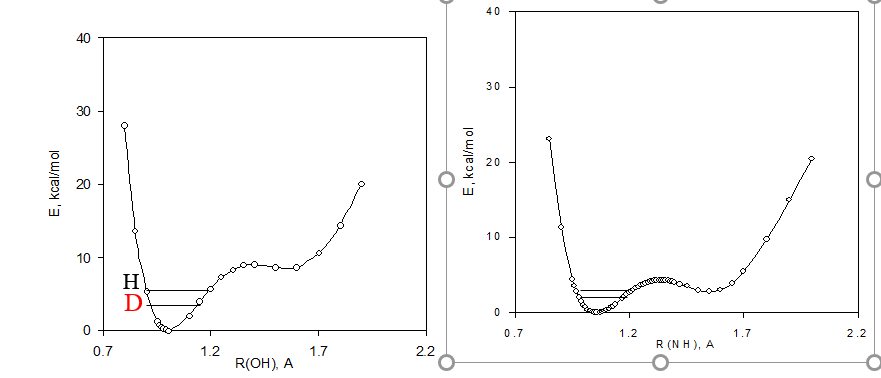
Figure 7. Potential energy diagrams including zero point energies for H and d species for a tautomeric equilibrium of
Fig. 7. Potential energy diagrams including zero point energies for H and d species for a tautomeric equilibrium of
o-hydroy Schiff bases.
-hydroy Schiff bases.
The Limbach group has used an approach based on bond valences. See e.g. Ref. [13]
Reviews dealing with equilibrium isotope effects can be found. [11][14][15][16][17][18][11],[14],[15],[16],[17],[18]
4.2 Primary deuterium isotope effects.
6.2. Primary Deuterium Isotope Effects
The sign of the primary deuterium isotope effect can be used to estimate hydrogen bond strength. Positive primary isotope effects are for weak to medium strong isotope effects, whereas a negative isotope effects was claimed to be an indicator of a strong hydrogen bond. [19] However, if equilibrium is occurring positive as well as negative effects may occur. [11]
The sign of the primary deuterium isotope effect can be used to estimate hydrogen bond strength. Positive primary isotope effects are for weak to medium strong isotope effects, whereas a negative isotope effects was claimed to be an indicator of a strong hydrogen bond. [19] However, if equilibrium is occurring positive as well as negative effects may occur. [11]
7. Secondary Deuterium Isotope Effects
4.3 Secondary deuterium isotope effects
7.1. Deuterium Isotope Effects on
Deuterium isotope effects on
13C Chemical Shifts
C chemical shifts
Secondary deuterium isotope effects have a characteristic S-shaped dependence if plotted vs. the mole fraction as illustrated in Figure 8. [20] It is also obvious that at the maximum and minimum the changes will be minimal, whereas they will be large and of different sign at the edges (small and large mole fractions).
Secondary deuterium isotope effects have a characteristic S-shaped dependence if plotted vs. the mole fraction as illustrated in Fig. 8. [20] It is also obvious that at the maximum and minimum the changes will be minimal, whereas they will be large and of different sign at the edges (small and large mole fractions).
Figure 8.Fig. 8. Plot of two-bond deuterium isotope effects of 13C chemical shifts vs. mole fraction. From Ref. 20 with Permission from Wiley-VCH.
7.2. Lifting Degeneracy in Symmetrical Systems
Lifting degeneracy in symmetrical systems
13
C NMR. Deuterium isotope effects on
13C chemical shifts can in a very elegant way be used to detect an equilibrium. The technique was originally invented in the study of carbonium ions. [21] A typical example of this technique is seen in Figure 9. The origin of the effect is the difference in CH stretching frequencies of the aldehyde, 2770 cm
C chemical shifts can in a very elegant way be used to detect an equilibrium. The technique was originally invented in the study of carbonium ions. [21] A typical example of this technique is seen in Fig. 9. The origin of the effect is the difference in CH stretching frequencies of the aldehyde, 2770 cm
-1
and the enol type, 3020 cm
-1.
.
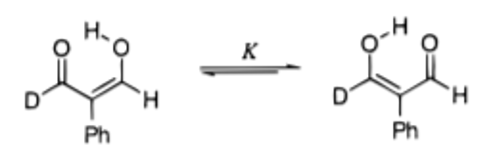
Fig. 9. Lifting of degeneracy by deuterium substitution. [22]
Figure 9. Lifting of degeneracy by deuterium substitution. [22]
18O has been used as the isotope in order to distinguish between double well and symmetric hydrogen bond potentials in compounds having strong intramolecular hydrogen bonds between carboxylic acid and carboxylate groups. Figure 10. [23]
O has been used as the isotope in order to distinguish between double well and symmetric hydrogen bond potentials in compounds having strong intramolecular hydrogen bonds between carboxylic acid and carboxylate groups. Fig. 10. [23]
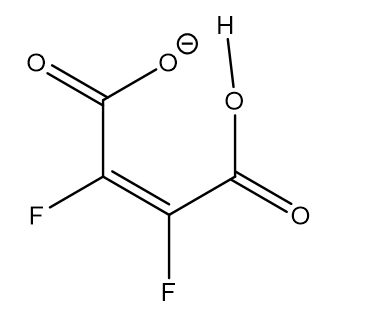
Figure 10.
Fig. 10.
18O labelled maleic anion.
O labelled maleic anion.
What is the characteristics of equilibrium isotope effects? They can be measured at nuclei far from the site of isotope substitution and can be very large. In case of thioacetylacetone (Figure 4) deuteriation at the OH;SH position leads to
What is the characteristics of equilibrium isotope effects? They can be measured at nuclei far from the site of isotope substitution and can be very large. In case of thioacetylacetone (Fig. 4) deuteriation at the OH;SH position leads to
13C isotope effects at the “CS” carbon as large as -10.5 ppm depending on temperature. [2] Furthermore, as seen from Eq. 1 they will in those cases that they are larger than the intrinsic ones be proportional to the chemical shift difference between the nuclei in question (the chemical sift differences can be estimated from DFT calculations of NMR nuclear shieldings). An example of the latter is shown in Table 2.
C isotope effects at the “CS” carbon as large as -10.5 ppm depending on temperature. [2] Furthermore, as seen from Eq. 1 they will in those cases that they are larger than the intrinsic ones be proportional to the chemical shift difference between the nuclei in question (the chemical sift differences can be estimated from DFT calculations of NMR nuclear shieldings). An example of the latter is shown in Table 2.
Table 2. Calculated 13C nuclear shieldings for the Schiff base 2-(N-methyl-α-iminoethyl)-3,5-dibromophenol (Figure. 6 with R= CH3 and R´= 3,5-dichloro)
|
|
C-a |
C-1 |
C-2 |
C-3 |
C-4 |
C-5 |
C-6 |
C-1´ |
Cst |
|
OH-form |
-11.0 |
13.9 |
-29.1 |
-9.0 |
-5.7 |
11.3 |
0.3 |
9.7 |
0.3 |
|
NH-form |
-28.9 |
5.5 |
9.3 |
13.5 |
0.3 |
1.0 |
0.8 |
-10.9 |
-1.9 |
From the above table we can predict that all carbons except C-4, C-6 and Cst will show large equilibrium isotope effects.
In addition, the ratio between isotope effects can be expressed in those cases in which the equilibrium isotope effects dominate:
In addition, the ratio between isotope effects can be expressed in those cases in which the equilibrium isotope effects dominate:
ΔC-1/ ΔC-2 = (δC-1M- δC-1PT)/ (δC-2M- δC-2PT)
This shows the ratio between isotope effects for C1 and C2 of the two tautomers called M and PT.
An illustration is given in Figure. 11 for a series of o-hydroxy Schiff bases (Figure. 5). [7]
[7]
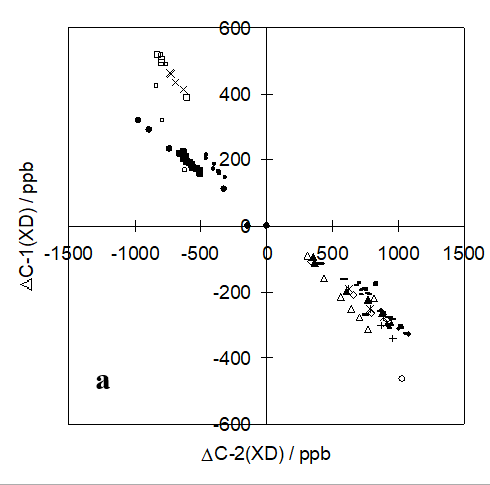
Figure 11. Ratios between deuterium isotope effects on
13
C chemical shifts for C-1 and C-2 for a series of
o-hydroxy Schiff bases. Taken from Ref. [7] with permission from the American Chemical Society.
-hydroxy Schiff bases. Taken from Ref. 7 with permission from the American Chemical Society.
7.3. Deuterium Isotope Effects on
4.3 Deuterium isotope effects on
19F Chemical Shifts
F chemical shifts
These have been demonstrated in
o
-hydroxyazo compounds (see Fig. 6). However, in the benzene derivative case no tautomerism is taking pIace ,the isotope effect is only 0.011 ppm, whereas in similar naphthalene derivatives the effects in the equilibrium case is 0.077 ppm or 0.123 ppm For the azo group in 1- respective 2-position. [24]
7.4. Deuterium Isotope Effects on
4.4 Deuterium isotope effects on
17O Chemical Shifts
O chemical shifts
These isotope effects are large at both oxygens involved (Fig. 12). [9]
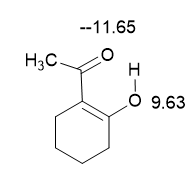
Fig. 12. Deutere ium isotope effects on 17O chemical shifts. Only one of the tautomers is shown.
- Determination of equilibrium constants
As NMR parameters, chemical shifts and coupling constants, are average ones, the equilibrium constants can be determined, if we have determined the corresponding parameters for the two tautomers. Furthermore, as described in Fig. 8 the mole fractions can be determined from deuterium isotope effects on 13C chemical shifts.
References
[1] Olivieri, A.C. Wilson, R.B. Paul, I.C. Curtin, D.Y. 13C NMR and X-ray Structure Determination of 1-(Arylazo)-2)-naphthols. Intramolecular Proton Transfer between Nitrogen and Oxygen Atoms in the Solid State. J.Am.Chem.Soc. 1989, 111, 5525-5532.
[2] Andresen, B. Duus, F. Bolvig, S. and Hansen, P.E. Variable Temperature 1H and 13C NMR Spectroscopic Investigation of the Enol-Enethiol tautomerism of β-Thioxoketones. Isotope Effects due to Deuteron Chelation. J.Mol.Struct. 2000, 552, 45-63.
[3] Fernándes-G, J.M. del Rio-Portillo, F. Quiroz-Garcia, B. Toscano, R.A. Salcedo, R. The Structure of some ortho-hydroxy Schiff base ligands, J.Mol.Struct. 2001, 561, 197-207. [9]
[4] Lycka, A. 19F-NMR Study of Azo-Hydrazone tautomerism of Some Fluorine-Containing Azo Dyes. Dyes and Pigments, 1990, 12, 179-185.
Figure [5] Hansen, P.E. Peregudov, A.S. Kravtsov, D.N. Krylova, A.I. Babakhina, G.M.and Golovchenko, L.S. Prototropic processes in benzaurins. 19F and 1H NMR spectra of fluoro- and methyl substituted 4-hydroxyphenyl-diphenylcarbinols, related fuchsones and benzaurins. Central. Eur.J.Chem. 2011, 9, 253-264.
[6] Kotovskaya, S.K. Romanova, S.A. Charushin, V.N.and Kodess, M.I. Fluorine-containing Heterocycles: XI. 5(6)-Fluoro-6(5)-X-benzofurans: synthesis, Tautomerism and Transformations. Russ.J.Org.Chem. 2.004, 40, 1167-1174.
[7] Filarowski, A. Koll, A. Rospenk, M. Krol-Starzomska, I. and Hansen,P.E. Tautomerism of sterically hindered Schiff bases. Deuterium Isotope Effects on 13C Chemical Shifts. J.Phys.Chem. A. 2005, 109, 4464-73.
[8] Boykin, D.W. 17O NMR Spectrope escopy in Organic Chemistry. CRC Press, Boca Raton, Fl. 1991.
[9] Bolvig, S. Hansen, P. E. Wemmer, D. and Williams, P. Deuterium Isotope Effects on 17O Chemichemal Shifts of Intramolecularly Hydrogen Bonded Systems. J.Mol.Struct. 1999, 509, 171-181.
[10] Hansen, P. E. Sitkowski J, Stefaniak, L. Rozwadowski, Z. and Dziembowska, T. One Bond Deuterium Isotope Effects on 15N Chemical Shifts, 1DN(D), in Schifft Bases. Berichte Bunsengesel Chem.Phys. 1998, 102, 410-13.
[11] Hansen, P. E. Methods to distinguish tautomeric cases from static ones. In Tautomerism: Ideas, Compounds, Applications. Ed. L. Antonov. Wiley-VCH, 2016.
[12] Bordner, J. Hammen, P.D. and Whipple, E.B. Deuterium-Isotope Effects on C-13 NMR shifts and the Tautomeric Equilibrium in N-substituted Pyridyl Derivatives of Piroxicam. J.Am.Chem.Soc. 1989, 11, 6572-6578.
[13] Sharif, S. Denisov, G.S. Toney, M.D. and Limbach, H-H. NMR Studies of solvent-Assisted Proton Transfer in a Biologically relevant Schiff base: Toward a Distinction of geometric and Equilibrium H-Bond isotope Effects. J.Am.Chem.Soc. 2006, 128, 3375-3387.
[14] Siehl, H.-U. Adv. Isotope Effects on NMR-spectra of Equilibrating Systems. Phys.Org.Chem. 1987, 23, 63-163.
[15] Forsyth, D.A. Isotopes in Organlic Chemistry; Buncel, E.; Lee, C. C., Eds.; Elsevier: Amsterdam, 1987; Vol. 6, Chapter 1.
[16] Hansen, P.E. Deuterium Isotope Effects on Nuclear Shielding. Prog.Nucl.Magn.Reson. Spectrosc. 1988, 20, 207-257.
[17] Hansen, P.E. Isotope effects on chemical shifts as a tool in the study of tautomeric equilibria.
In: Equilibria. Me othods and theories. L.Antonov ed. Wiley-VCH. 2014.
[18] Dziembowska, T. and Rozwadowski, Z. Application of the deuterium isotope effect on NMR chemical shift to study proton transfer equilibria. Curr.Org. Chem. 2001, 5, 289-313.
[19] Gunnarson, G. Wennerström, H. Egan, W. and Forsén, S. Proton and Deuterium NMR of Hydrogen Bonds: Relationshe taip between Isotope effects and the Hydrogen Bond Potential. Chem.Phys.Lett. 1976, 38, 96-99.
[20] Bolvig, S. and Hansen, P.E. Deuterium Isotope Effects on 13C Chemical Shifts as a Probers is for Tautomerism in Enolic b-Diketones. Magn.Reson.Chem. 1996, 34, 467-478.
[21] Saundersh, M. Telkownski, L. and Kates, M. R. J. Am. Chem. Soc. 1977, 99, 8070-8075.
8. Determination of Equilibrium Constants
[22] Perrin, C. L. and Kim, Y-J. Symmetry of the Hydrogen Bond in Malonaldehyde Enol in Solution J. Am. Chem. Soc. 1998, 120, 12641-12645.
[23] Perrin, C.L. Shrinidhi, A. and Burke, K.D. Isotopic-Perturbation NMR Study of Hydrogen—Bond Symmetry in Solution: Temperature dependence and Comparison of OHO and ODO Hydrogen Bonds. J.Am.Chem.Soc. 2019, 141, 17278-17286.
As NMR parameters, chemical shifts and coupling constants, are average ones, the equilibrium constants can be determined, if we have determined the corresponding parameters for the two tautomers. Furthermore, as described in Figure 8 the mole fractions can be determined from deuterium isotope effects on 13C chemical shifts.
[24] Hansen, P.E. Bolvig, S. Buvari-Barzca, A. and Lycka, A. Long range and Equilibrium Deuterium Isotope Effects on 19F Chemical Shifts. Acta Chem.Scand. 1997, 51, 881-888.