The electrodermal activity (EDA) signal is an electrical manifestation of the sympathetic innervation of the sweat glands. EDA has a history in psychophysiological (including emotional or cognitive stress) research since 1879, but it was not until recent years that researchers began using EDA for pathophysiological applications like the assessment of fatigue, pain, sleepiness, exercise recovery, diagnosis of epilepsy, neuropathies, depression, and so forth. The advent of new devices and applications for EDA has increased the development of novel signal processing techniques, creating a growing pool of measures derived mathematically from the EDA. For many years, simply computing the mean of EDA values over a period was used to assess arousal. Much later, researchers found that EDA contains information not only in the slow changes (tonic component) that the mean value represents, but also in the rapid or phasic changes of the signal. The techniques that have ensued have intended to provide a more sophisticated analysis of EDA, beyond the traditional tonic/phasic decomposition of the signal. With many researchers from the social sciences, engineering, medicine, and other areas recently working with EDA, it is timely to summarize and review the recent developments and provide an updated and synthesized framework for all researchers interested in incorporating EDA into their research.
- electrodermal activity
- sympathetic function
- EDA data collection
- EDA signal processing
1. Introduction
Sweat gland activity modulates the conductance of an applied current [[1][2][3][4]]. Such modulations produce electrodermal activity (EDA), a term that comprises the changes in electrical conductance of the skin. Increased sweating augments the electrical conductance of the skin, because although sweat contains minerals, lactic acid, and urea, it is mostly water. Thermoregulation is the primary function of most sweat glands, but those located on the plantar and palmar sides of the hand are known to be more concerned with grasping performance, rather than with temperature control. These sweat glands are more responsive to psychological stimuli rather than to thermal stimuli [[4]]. This phenomena is most evident in hands and feet because of the high density of eccrine glands in those areas; however, emotion-evoked sweating involves all eccrine sweat glands [[5]]. Therefore, EDA is believed to represent a quantitative functional measure of sudomotor activity, and consequently, an objective assessment of arousal [[6][7]]. Sudomotor activity is connected to the sympathetic function, and has the potential to be used for the evaluation of the autonomic function and assess the level of cognitive arousal [[8][9][10]]. EDA makes it theoretically possible to estimate the time and amplitude of stimuli generated from control centers in the brain by interpreting the manifestation of their arrival at the skin level, which is observable in the EDA signal [[4]].
The single effector model of the sweat glands is the most generally agreed-upon model for EDA. The changes in the level and phasic shifts of the EDA are the outputs of such a model. Sweat comes through varying numbers of ducts in the sweat glands at different levels, depending on the level of sympathetic arousal. The sweat ducts can be thought of as a set of variable resistors wired in parallel, which is the principle behind the single effector model. The higher the amount of sweat rises and the more ducts that are filled up, the lower the resistance in that variable set of parallel resistors. In this manner, changes in the level of sweat in the ducts produce observable variations in EDA [[11]].
The neurotransmitter involved in the mediation of eccrine sweat gland activity is acetylcholine, which is the primary neurotransmitter of the parasympathetic nervous system, rather than noradrenaline, which is typically associated with peripheral sympathetic activation [[12]]. For that reason, at one point in history, both the sympathetic and parasympathetic branches of the ANS were thought to control EDA. However, it is currently accepted that human sweat glands have predominantly cholinergic innervation from sudomotor fibers linked uniquely to the sympathetic chain [[5],[13]]. Studies that simultaneously recorded sympathetic action potentials in peripheral nerves and EDA provide evidence for the solely sympathetic control of EDA; a high correlation between bursts of sympathetic nerve activity and the amplitude of the rapid transient events in the EDA was shown [[14]].
2. Basics of the Signal Analysis of EDA
Basics of the Signal Analysis of EDA
The most salient characteristic of an EDA signal is the occurrence of skin conductance responses (SCRs) resulting from an underlying sympathetic reaction to a stimulus. The SCRs are the rapid and smooth transient events noticeable in the EDA signal (Figure 1). At least three pathways lead to the production of SCRs: hypothalamic control, contralateral and basal ganglion influences (involves one pathway of excitatory control by the premotor cortex and another pathway of exhibitory and excitatory influences in the frontal cortex), and the reticular formation in the brainstem [[13],[15][16]]. These pathways imply different functional roles associated with the central mechanisms: activation of the reticular formation is associated with gross movements and increased muscle tone, hypothalamic activity controls thermoregulatory sweating, amygdala activation reflects affective processes, premotor cortex activity occurs in situations requiring fine motor control, and prefrontal cortical activity is associated with orienting and attention [[11],[17][18]]. All these processes influence the EDA signal.
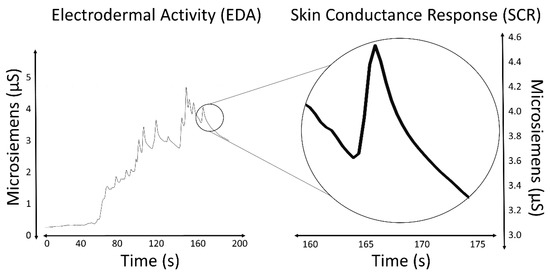
Figure 1. EDA signal and an isolated SCR.
Measures of the SCRs are used to evaluate a subject’s response to event-related experiments (“startle-like” stimuli) or tonic stimuli tests (like a change in condition, workload, cognitive stress, and so forth). In event-related experiments, the occurrence of an SCR is expected after the stimulus is applied. In such experiments, the SCRs are usually called the event-related SCRs (ERSCRs) [[13]]. Quantitative measures are obtained from SCRs by computing their amplitude, rise time (also referred to as onset-to-peak time), and other metrics. Figure 2 illustrates some of the quantitative measures available from an individual SCR. In the figure, time is relative to the stimulus and amplitude values are relative to the SCR onset level.
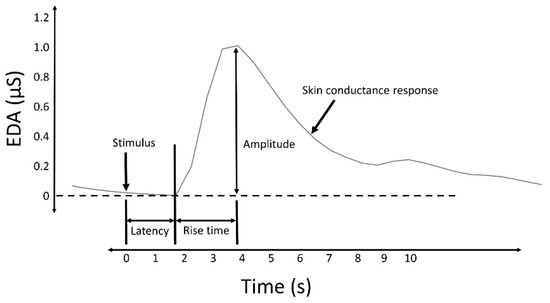
Figure 2. A typical skin conductance response (SCR) and illustration of some derived measures.
The skin conductance level (SCL) and nonspecific skin conductance responses (NSSCRs) [[3]] are measures obtained to assess the response to a tonic stimulus. SCL, expressed in the same units as EDA (typically microsiemens (µS)), specifically refers to the overall conductance obtained from the tonic component of EDA (Figure 3), and was conceived as a measure related to the slow shifts of the EDA. A SCL is typically computed as the mean of several measurements taken during a specific non-stimulation rest period, for example, the mean of the “tonic EDA” component shown in Figure 3. The non-specific NSSCRs are the number of SCRs in a period of time and are considered a tonic measure because they cannot be linked to a specific stimuli, but are the result of spontaneous fluctuations in EDA in the presence of an ongoing sustained stimulus over a period of time.
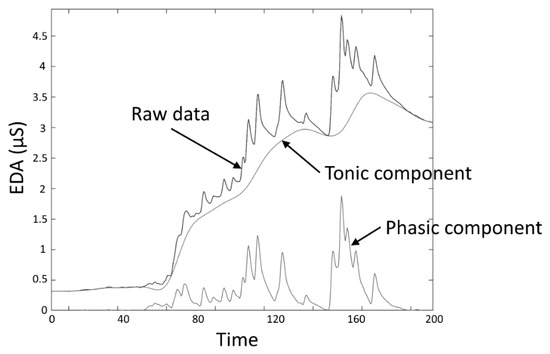
Figure 3. EDA data decomposition into tonic and phasic components.
Despite the source that caused the SCRs (specific to a stimulus or spontaneous), they are characterized by a rise from the initial level to a peak, followed by a decline [[19]]. When caused by a stimulus, the onset of the SCR is typically between 1 and 5 s after the delivery of the stimulus [[3]]. The amplitude of the SCRs (conductance at the peak relative to the conductance at the onset) can reach several µS. A minimum of 0.05 or 0.04 µS is typically set as a threshold to define a significant SCR to avoid incorrect measurements caused by movement artifacts, the noise level of the equipment, and experimental conditions [[3]]. The time from the onset of the SCR to the peak, termed the rise time (Figure 2), normally varies between 0.5 and 5 s [[20]]. The spectral content of EDA is mostly confined to 0.045–0.15 Hz [[21]]. Exercise increases the spectral content of EDA, exhibiting spectral content at about 0.37 Hz when subjects perform vigorous-intensity exercise [[22]].
References
- Cacioppo, J.T.; Tassinary, L.G.; Berntson, G. Handbook of Psychophysiology, 3rd ed.; Cambridge University Press: Cambridge, UK; New York, NY, USA, 2007; ISBN 978-0-521-84471-0.
- Martin, I.; Venables, P.H. Techniques in Psychophysiology; Psychological Medicine; John Wiley & Sons: Chichester, UK, 1980; Volume 10, p. 806.
- Society for Psychophysiological Research Ad Hoc Committee on Electrodermal Measures; Publication recommendations for electrodermal measurements. Psychophysiology 2012, 49, 1017-1034, 10.1111/j.1469-8986.2012.01384.x.
- Greenfield, N.S.; Sternbach, R.A. Handbook of Psychophysiology; Holt, Rinehart & Winston: Oxford, UK, 1972; Volume xii.
- Stephanie A. Shields; Kathleen A. MacDowell; Sarah B. Fairchild; Mary L. Campbell; Is Mediation of Sweating Cholinergic, Adrenergic, or Both? A Comment on the Literature. Psychophysiology 1987, 24, 312-319, 10.1111/j.1469-8986.1987.tb00301.x.
- P.H. Ellaway; Annapoorna Kuppuswamy; A. Nicotra; C.J. Mathias; Sweat production and the sympathetic skin response: Improving the clinical assessment of autonomic function. Autonomic Neuroscience 2010, 155, 109-114, 10.1016/j.autneu.2010.01.008.
- Mathias Benedek; Christian Kaernbach; A continuous measure of phasic electrodermal activity. Journal of Neuroscience Methods 2010, 190, 80-91, 10.1016/j.jneumeth.2010.04.028.
- Ben M. W. Illigens; Christopher H. Gibbons; Sweat testing to evaluate autonomic function. Clinical Autonomic Research 2008, 19, 79-87, 10.1007/s10286-008-0506-8.
- Cornelia Kappeler-Setz; B. Arnrich; J. Schumm; R. La Marca; G. Troster; U. Ehlert; Discriminating Stress From Cognitive Load Using a Wearable EDA Device. IEEE Transactions on Information Technology in Biomedicine 2009, 14, 410-417, 10.1109/titb.2009.2036164.
- J.A. Healey; R.W. Picard; Detecting Stress During Real-World Driving Tasks Using Physiological Sensors. IEEE Transactions on Intelligent Transportation Systems 2005, 6, 156-166, 10.1109/tits.2005.848368.
- Edelberg, R. Electrodermal Mechanisms: A Critique of the Two-Effector Hypothesis and a Proposed Replacement. In Progress in Electrodermal Research; Roy, J.-C., Boucsein, W., Fowles, D.C., Gruzelier, J.H., Eds.; NATO ASI Series; Springer: New York, NY, USA, 1993; pp. 7–29. ISBN 978-1-4613-6241-8.
- M J Christie; Electrodermal activity in the 1980s: a review.. Journal of the Royal Society of Medicine 1981, 74, 616-622.
- Posada-Quintero, H. Electrodermal Activity: What It Can Contribute to the Assessment of the Autonomic Nervous System. Ph.D. Thesis, University of Connecticut, Storrs, CT, USA, 2016.
- B. Gunnar Wallin; Sympathetic Nerve Activity Underlying Electrodermal and Cardiovascular Reactions in Man. Psychophysiology 1981, 18, 470-476, 10.1111/j.1469-8986.1981.tb02483.x.
- Henrique Sequeira; Jean-Claude Roy; Cortical and Hypothalamo-Limbic Control of Electrodermal Responses. Progress in Electrodermal Research 1993, null, 93-114, 10.1007/978-1-4615-2864-7_8.
- Jean-Claude Roy; Henrique Sequeira; Bernard Delerm; Neural Control of Electrodermal Activity: Spinal and Reticular Mechanisms. Progress in Electrodermal Research 1993, null, 73-92, 10.1007/978-1-4615-2864-7_7.
- Boucsein, W. Electrodermal Activity; Springer: Boston, MA, USA, 2012; ISBN 978-1-4614-1125-3.
- Davidson, R.J. Psychophysiology: The Mind–Body Perspective; Hugdahl, K., Ed.; Harvard University Press: Cambridge, MA, USA, 1995.
- Dawson, M.E.; Schell, A.M.; Filion, D.L. Chapter 7: The Electrodermal System. In Handbook of Psychophysiology; Cambridge University Press: Cambridge, UK; New York, NY, USA, 2007; pp. 159–181.
- Grings, W.W.; Recording of electrodermal phenomena. Methods Physiol. Psychol. 1974, , 1, , 273–296..
- Hugo Posada-Quintero; John P. Florian; Alvaro David Orjuela-Cañón; Tomas Aljama-Corrales; Sonia Charleston-Villalobos; Ki Chon; Power Spectral Density Analysis of Electrodermal Activity for Sympathetic Function Assessment. Annals of Biomedical Engineering 2016, 44, 3124-3135, 10.1007/s10439-016-1606-6.
- Hugo Posada-Quintero; Nataša Reljin; Craig Mills; Ian Mills; John P. Florian; Jaci L. VanHeest; Ki Chon; Time-varying analysis of electrodermal activity during exercise. PLOS ONE 2018, 13, e0198328, 10.1371/journal.pone.0198328.