Your browser does not fully support modern features. Please upgrade for a smoother experience.
Please note this is a comparison between Version 1 by Dek Vimean Pheakdey and Version 2 by Dean Liu.
Municipal solid waste (MSW) management is one of the utmost challenges for Cambodia’s city and district centers. The unsound management of MSW has detrimentally affected the environment and human health.
- composting
- incineration
- landfill
- municipal solid waste
- recycling
1. Introduction
Solid waste management is an emerging concern for countries around the world, particularly developing nations with limited financial resources, lack of technologies, and an absence of policy framework [1][2][3][4][1,2,3,4]. In 2016, global waste generation was estimated at 2.01 billion tons with per capita generation at 0.74 kg/day, and the East Asia and Pacific countries shared the highest proportion (23%), followed by Europe and Central Asia (20%) and South Asia (17%) [5]. Developed countries seem to have a higher annual growth rate at 3.2–4.5%, while the yearly growth rate in the developing world is 2–3% [6]. An increase in waste generation is generally associated with population growth, rapid urbanization, and national GNP [1].
Rapid economic growth in recent years has spurred Cambodia to devote effort to waste management challenges [7]. Solid waste in Cambodia is classified into three categories: household waste, commercial waste, and industrial and hazardous wastes (including medical waste) [8][9][8,9]. However, there is no consensus on this classification, and the up-to-date data are relatively limited [10]. Municipal solid waste (MSW) combines wastes from households and commercials [11], generated from households, markets, restaurants, shops, hotels, offices, street sweepings, and miscellaneous [12][13][12,13]. Rapid urbanization and industrialization have led people to migrate to cities to obtain better jobs, a higher education, and access to health care services, making waste generation unpredictable. The data on MSW generation are mainly estimated based on population and constant generation rate in the entire country, and the reliable data of MSW generation are hard to come by.
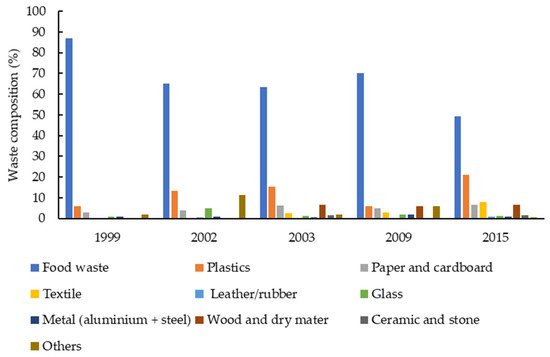
MSW composition is primarily food and organic waste (52–63%) [12][13][12,13], usually disposed of by mixing with plastic, glass, textile, paper, and other fractions without separation at the sources. An increase in population, rapid urbanization, economic growth, and improved living standards are the main factors affecting MSW generation, in terms of both quantity and quality [14]. The change of lifestyle and consumption patterns is also a driving force behind a rapid increase in MSW in the country [15]. For example, the use of plastic cups, plastic straws, and plastic bags for takeaway coffee is becoming more popular in Cambodian society. Another example is using plastic bags and Styrofoam containers for packaging food instead of reusable containers. These practices may not only pollute the environment but also negatively affect human health. Jadhav et al. illustrated that using plastic materials for packaging food and beverages releases microplastics and toxic substances, which may be harmful to consumer health [16].
A rapid increase in MSW in urban areas has put pressure on the collection and management system. The collection service is mostly prioritized in populated areas with good infrastructure and high commercial activities due to lack of transportation and low revenue collection [13][17][13,17]. In 2021, approximately 2.10 million tons of MSW were collected from 204 city and district centers [12] with an average rate of 72% [18]. The collection rate varies by city and district. Phnom Penh, the municipality of Cambodia, has the highest collection rate at 91–92% [5][19][5,19]. The limitation of public awareness and participation also poses a challenge for the environmentally sound management of MSW. Cambodia has no large-scale waste treatment and recycling facilities. The lack of waste treatment technologies and infrastructures has shortened the lifespan of landfills since most MSW collections are directly sent to landfills without intermediate treatment [17]. The effort to reduce and reuse refuse materials is still weak, and the management of landfills is poor. In recent years, the government has made many efforts to enhance MSW management by developing new regulations, policies, strategies, and guidelines. However, the question is how such instruments can be effectively implemented towards the sustainable management of MSW by taking account of environmental, economic, and social aspects.