Carbon emission trading market construction is an important policy tool to promote the realization of China’s “double carbon” goal. However, problems still exist, such as the lack of market trading vitality, the large difference in carbon trading prices between the eight pilot markets and the instability of the prices. In order to explore the key influencing factors on carbon trading prices, 15 factors were selected to study in detail according to the policy, green industry, economy and environment. Taking China’s eight pilot carbon trading markets as research subjects, thwe researchers eexplored the correlation degree of each factor by using the improved gray relational analysis model (GRAM) from the two dimensions of space and time. The research results show that from the space dimension, the industrial development level, development degree of low-carbon industries, air pollution degree and green technology maturity are the main factors that affect the carbon trading price in the eight pilot areas. Meanwhile, from the time dimension, the correlation degree between various factors and carbon trading price both showed a downward trend as a whole, and the fluctuation of the correlation degree of individual factors was different from the overall trend. In conclusion, the researchers cwe can put forward recommendations on the pricing mechanism of the carbon trading market after this comprehensive researchstudy.
- carbon emissions trading
- carbon trading price
- influencing factors
- improved gray relational analysis model
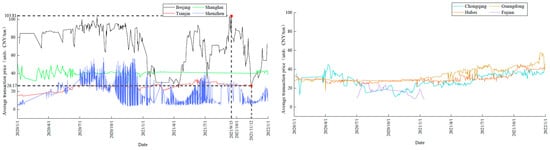
1. Current Situation Analysis of Prices
2. Selection of factors influencing the price of carbon trading
By analyzing the formation mechanism of carbon trading price and using cluster analysis method, thwe researchers finally identified 11 carbon trading price influencing factors, as shown in Table 12.
Table 12. Influencing factors on carbon trading price after screening.
| Factor Classification | Variable | Influencing Factors |
|---|---|---|
| Policy factors | a1 | Free carbon quotas issued by the government |
| a2 | Carbon quotas issued by the government through bidding | |
| a3 | Government carbon threshold | |
| Green industry factors | a5 | Green technology maturity |
| a6 | Development degree of low-carbon industry | |
| a7 | Clean energy penetration | |
| Economic factors | a8 | Coal price |
| a9 | Crude oil price | |
| a12 | Industrial development index | |
| Environmental factors | a14 | Air pollution degree |
| a15 | Air temperature |
3. Improved Gray Relational Analysis Model
After the above systematic cluster analysis, 11 low-correlation influencing factors on the carbon trading price were selected. Then, thwe researchers cconducted gray relational analysis between these 11 factors and the carbon trading price and ranked the correlation degrees between each factor and the carbon trading price from high to low. The specific application of the model was as follows.
3.1. Gray Relational Analysis Model
The gray relational analysis model is a correlation analysis model that measures the degree of association between factors by the similarity or dissimilarity of the trends between them. The application of gray relational analysis in this respapearchr was to measure the correlation of each influencing factor with the carbon trading price and to rank the correlations of each factor. Gray relational analysis is designed to analyze the development trend, and there is no requirement for the sample size, so gray relational analysis is suitable for analyzing data with a small sample size, and the results can be obtained from a small amount of data that are more consistent with other regression models. Therefore, the gray relational analysis model was selected to analyze the influencing factors on the carbon trading price filtered by the above cluster analysis. At the same time, the researchers we improved the model based on the traditional model with the research content.
3.2. Improvement of the Gray Relational Analysis Model
According to the above definition, the idea of the traditional gray relational analysis model is to calculate multiple correlation coefficients according to the distance between the corresponding points of the sequence and then calculate the correlation degree between the sequences from the arithmetic average of the correlation coefficients of each point. Based on the traditional gray relational analysis model, thwe researchers made two improvements. First, the traditional model calculates the correlation coefficient according to the distance between a sequence of corresponding points, which is suitable for all data analysis but lacks pertinence. Considering the volatility of the carbon trading price, the researchers rewe replaced the distance between a sequence’s corresponding points in the traditional model with the distance of variance between a sequence’s corresponding points and more accurately calculated the correlation degree between the carbon trading price and the factors. Second, the traditional model averages the correlation coefficients of each sequence point to derive the correlation degree of the sequence as a whole without considering the different degrees of influence of different sequence points on the sequence as a whole. To improve the accuracy of the correlation degree, the coefficient of variation method was used to objectively assign weights to each sequence point, replacing the average weight method in the traditional model with the coefficient of variation weight method to improve the accuracy of the calculation results. The specific improvement process is as follows:
Improvement 1. Sequence Variance Distance
Let , and then replace it with in the traditional gray correlation model. The correlation coefficient is calculated according to the distance of variance between sequence points. The improved formula is as follows:
where is the improved correlation coefficient between the k-th data of the i-th influencing factor and the k-th data of the carbon trading price and is the resolution coefficient, which is generally taken to be .
Improvement 2. Weight Calculation
In this respapearchr, the coefficient of variation method is introduced to determine the weight of each index. The coefficient of variation method is an objective weighting method that assigns weights to all the indicators to be identified based on the magnitude of variation of their measured values, and it assigns weights by the inherent association between the data, resulting in accurate and objective weighting results. Taking the free carbon quotas issued by the government as an example, the correlation coefficient between the monthly free carbon quotas issued by the government and the current month’s carbon trading price constitutes the correlation degree between the free carbon quotas issued by the government and the carbon trading price according to a certain weight.
Improvement 3. Add the Positive and Negative Correlations
Gray relational analysis can measure the correlation degree between factors but cannot measure the positive or negative correlations. To make up for the shortcomings of gray relational analysis, data analysis was used to calculate the correlation coefficients of the carbon trading price and each influencing factor and to determine the positive and negative correlations of each influencing factor with the carbon trading price according to the positivity and negativity of each correlation coefficient.
4. Empirical Analysis and Results
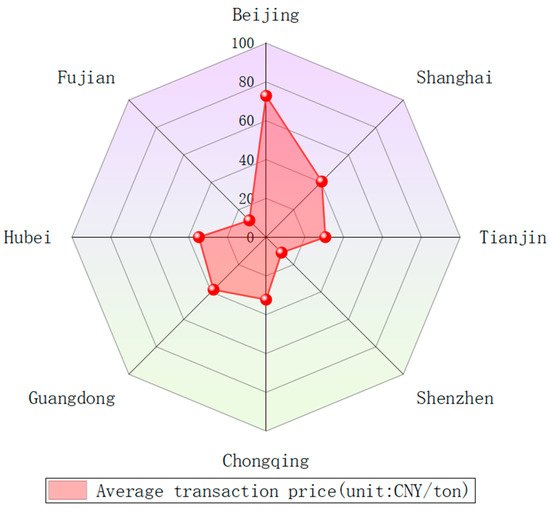
4.1. Spatial Dimension
Spatial dimension analysis was aimed at analyzing the correlation between various factors and the carbon trading price in the eight pilot regions. The monthly average carbon trading price from 2017 to 2020 was used as the parent sequence, denoted as . According to Table Table 11, the characteristic sequence of the measurement indicators of each influencing factor was (excluding the factors that were removed in the previous systematic cluster analysis).
4.1.1. Correlation Results of the Spatial Dimension
According to the calculations, the correlation degree and positive and negative relationships between various influencing factors and the carbon trading price in different regions are shown in Table 23.
Table 23. Correlation degree and positive and negative relationships of each factor in 8 regions.
| Variable | Beijing | Shanghai | Tianjin | Shenzhen | Chongqing | Guangdong | Hubei | Fujian |
|---|---|---|---|---|---|---|---|---|
| a1 | −0.810 | −0.814 | 0.769 | 0.742 | 0.718 | 0.866 | −0.673 | 0.799 |
| a2 | / | 0.706 | 0.628 | / | −0.720 | 0.623 | 0.523 | / |
| a3 | 0.729 (/) | 0.809 (/) | 0.736 (/) | 0.680 (/) | 0.711 (/) | 0.846 (/) | 0.609 (/) | 0.725 (/) |
| a5 | 0.862 | 0.726 | 0.786 | −0.740 | 0.754 | 0.923 | 0.669 | −0.802 |
| a6 | 0.818 | −0.851 | 0.790 | 0.755 | 0.749 | 0.896 | −0.729 | 0.773 |
| a7 | 0.783 | 0.847 | 0.808 | 0.729 | 0.724 | 0.878 | 0.630 | 0.743 |
| a8 | −0.781 | −0.872 | −0.775 | 0.708 | −0.727 | −0.871 | −0.653 | 0.756 |
| a9 | −0.818 | −0.746 | −0.807 | −0.764 | −0.757 | −0.908 | 0.688 | 0.757 |
| a12 | −0.839 | −0.866 | −0.776 | 0.773 | −0.756 | −0.904 | −0.759 | 0.791 |
| a14 | −0.813 | −0.813 | −0.744 | −0.795 | −0.747 | −0.915 | 0.724 | 0.766 |
| a15 | 0.510 | 0.545 | 0.546 | 0.722 | −0.810 | 0.915 | 0.586 | 0.755 |
Note: ① Beijing, Shenzhen and Fujian had not set carbon quotas through bidding, and there was no correlation between the carbon quotas issued by the government and carbon trading price. ② The government carbon threshold of the 8 regions did not change from 2017 to 2020, so the positive and negative correlations between the government carbon threshold and carbon trading price could not be calculated.
4.1.2. Analysis of Results
1. Overall Analysis
In order to analyze the correlation between various factors and the carbon trading price from an overall perspective, according to Table 34, thwe researchers averaged the correlation degrees of the eight pilot areas to obtain the overall correlation degree, and each correlation degree is shown in Figure 35.
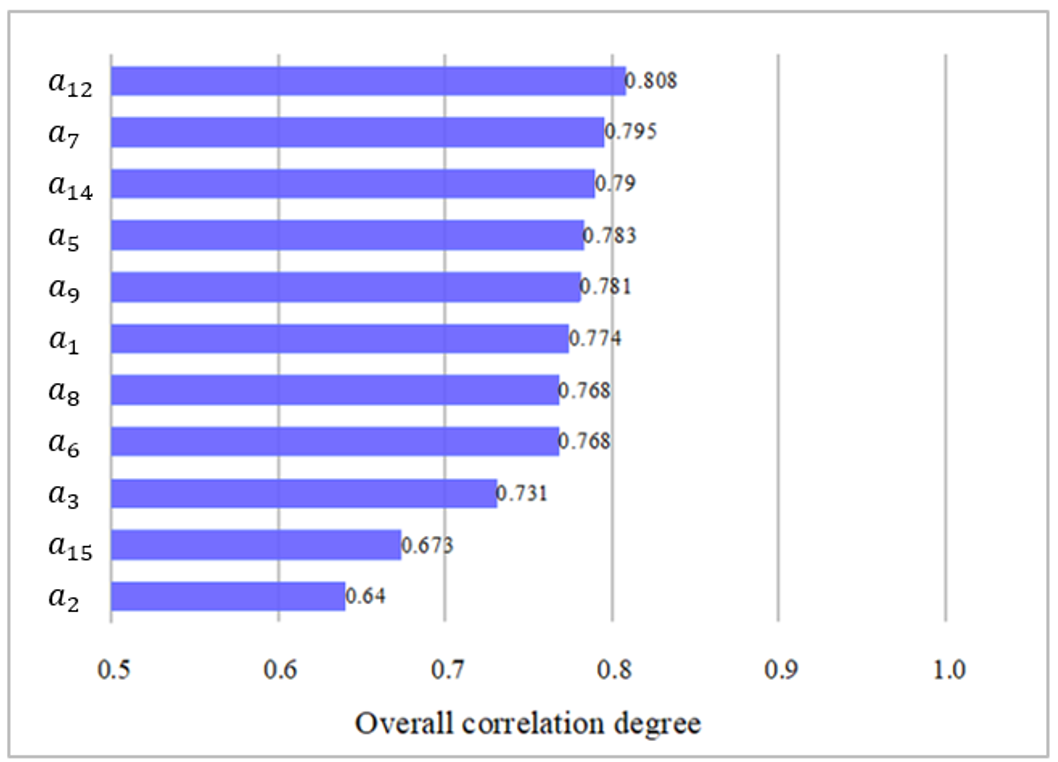
Figure 35. The overall correlation degree of each influencing factor.
According to Figure 35, the correlation degree between the 11 factors and the carbon trading price was greater than 0.5, which shows that the above 11 factors had a significant impact on the carbon trading price. The correlation degrees of the industrial development level (𝑎12), low-carbon industry development level (𝑎6), air pollution (𝑎14) and green technology maturity (𝑎5), which were in the top four positions, were 0.808, 0.795, 0.790 and 0.783, respectively. These factors had the most significant correlation with the carbon trading price, and the influence degree decreased in turn. The top four correlations included one economic factor, one environmental factor and two green industry factors. The free carbon quotas issued by the government (𝑎1), with the largest relevance among the policy factors, ranked sixth. It can be seen that among the four factors, the policy factors had the lowest impact on the carbon trading price.
Table 34. Ranking of correlation degrees.
| Region | Top Four in Correlation Degree Ranking |
|---|---|
| Beijing | a5 > a12 > a9 > a6 |
| Shanghai | a8 > a12 > a6 > a7 |
| Tianjin | a7 > a9 > a6 > a5 |
| Shenzhen | a14 > a12 > a9 > a6 |
| Chongqing | a15 > a9 > a12 > a5 |
| Guangdong | a5 > a15 > a14 > a9 |
| Hubei | a12 > a6 > a14 > a9 |
| Fujian | a5 > a1 > a12 > a6 |
Due to the different levels of economic development, energy consumption and carbon market construction in different regions, there were differences in the impacts of various influencing factors on the carbon trading price in different regions. Next, combined with the regional characteristics, thwe researchers aanalyzed the correlation results of the above four influencing factors.
(1) Industrial Development Level
The industrial development level had a negative impact on the carbon trading price in Beijing, Shanghai, Tianjin, Chongqing, Guangdong and Hubei, with correlation degrees of 0.839, 0.866, 0.776, 0.756, 0.904 and 0.759, respectively. On the contrary, it had a positive impact on the carbon trading price in Shenzhen and Fujian, and the correlation degrees were 0.773 and 0.791, respectively.
In terms of the correlation degree, the correlation degree of each region was more than 0.7, which shows that there was a significant correlation between the industrial development level and carbon trading price in the eight regions. Li and Song [1][36] also identified industrial development as an important factor influencing the carbon trading price. According to Table 2Table 3, Guangdong and Shanghai had the highest correlation degree, with both greater than 0.8, because Guangdong and Shanghai are located in the Yangtze River Delta and Pearl River Delta, which are important industrial areas in China. Industrial enterprises are concentrated, and industrial development can affect the carbon trading price to a greater extent.
In terms of positive and negative correlation, the industrial development level was negatively correlated with the carbon trading price in six regions. However, Zhu et al. [2][38] argued that industrial development implies an increase in energy inputs, leading to an increase in the carbon trading price. While the researcheours' findings were similar to the findings of Zhou and Li [3][25], the industrial index had a negative impact on the carbon trading price. This phenomenon may be due to the continuous acceleration of China’s industrialization process in recent years, and the resource consumption has far exceeded the speed of resource regeneration and the environmental carrying capacity. With the continuous investment of national capital and technology, industrial upgrading has accelerated, and the energy intensive heavy industry has begun to transform. While ensuring the development of enterprises, carbon emissions were reduced, the demand for carbon emissions rights was reduced, and the carbon trading price was reduced.
(2) Development Degree of the Low-Carbon Industry
The development degree of the low-carbon industry had a positive impact on the carbon trading price in Beijing, Tianjin, Shenzhen, Chongqing, Guangdong and Fujian, with correlation degrees of 0.818, 0.790, 0.755, 0.749, 0.896 and 0.773, respectively. On the contrary, it had a negative impact on the carbon trading price in Shanghai and Hubei, and the correlation degrees were 0.851 and 0.729, respectively.
In terms of the correlation degree, the correlation degree of each region was more than 0.7. It can be seen that the correlation between the development degree of the low-carbon industry and carbon trading price was significant in all regions. The correlation between the development degree of the low-carbon industry and carbon trading price in Guangdong and Shanghai was high, with both being greater than 0.8, which was similar to the ranking of the total value of the energy saving and environmental protection industry in the two regions. The total value of the energy saving and environmental protection industry in the two regions was at the forefront of the ranking of the eight regions. Compared with other regions, the development degree of the low-carbon industry in Guangdong and Shanghai affected the local carbon trading price to a greater extent.
In terms of positive and negative correlation, the three green industry factors had a positive relationship with the carbon trading price in most regions, which was contrary to the action mechanism mentioned above that the better the development of the green industry, the fewer carbon emissions, and the lower the carbon trading price. This is because with more subjects conducting carbon trading, the carbon trading price is in the rising stage. The development of the green industry is at a preliminary stage, and although it can reduce carbon emissions and provide surplus carbon allowances, thus reducing the carbon trading price, it is not enough to change the overall trend of rising carbon trading prices, so a negative relationship was shown in the data analysis results.
(3) Air Pollution Degree
The air pollution degree had a negative impact on the carbon trading price in Beijing, Shanghai, Tianjin, Shenzhen, Chongqing and Guangdong, with correlation degrees of 0.813, 0.813, 0.744, 0.795, 0.747 and 0.915, respectively. On the contrary, it had a positive impact on the carbon trading price in Hubei and Fujian, and the correlation degrees were 0.724 and 0.766, respectively.
In terms of the correlation degree, the correlation degree of each region was more than 0.7. It can be seen that the correlation between the air pollution degree and carbon trading price in the eight regions was significant.
In terms of positive and negative correlation, the air pollution degree in Hubei and Fujian was positively correlated with the carbon trading price and negatively correlated in other regions. However, thwe researchers arargue that the emission reduction measures taken by the government in response to air pollution do not include the reduction of carbon quotas because the cycle of allocating carbon quotas happens every year, and there is a lag in the policy. On the contrary, the government is urging industrial enterprises to cut production and limit traffic in cars and construction enterprises to reduce earthwork. The more the carbon emissions of enterprises decrease, the smaller the demand for carbon emissions rights, and the lower the carbon trading price. Except for Hubei and Fujian, the other regions were in line with the action mechanism of the air pollution degree mentioned above, and the air pollution degree was positively correlated with the carbon trading price. However, the Hubei and Fujian regions showed abnormalities, and the air pollution degree was negatively correlated with the local carbon trading price, indicating that local emissions reduction policies were not effectively implemented. It can be seen that Hubei and Fujian made few efforts to reduce emissions in response to air pollution, as the carbon emissions of enterprises had not been reduced to a certain extent, and the demand for carbon emission rights had not been reduced. Therefore, when air pollution was serious, it did not led to a decline in the carbon trading price in Hubei and Fujian.
(4) Green Technology Maturity
Green technology maturity had a positive impact on the carbon trading price in Beijing, Shanghai, Tianjin, Chongqing, Guangdong and Hubei, with correlation degrees of 0.862, 0.726, 0.786, 0.754, 0.923 and 0.669, respectively. On the contrary, it had a negative impact on the carbon trading price in Shenzhen and Fujian, and the correlation degrees were 0.740 and 0.802, respectively.
In terms of the correlation degree, the correlation degree of each region was more than 0.7. It can be seen that the correlation between green technology maturity and the carbon trading price in most regions was significant. Beijing and Guangdong had the highest correlation degree, which was similar to the ranking of the number of green patents authorized in the two regions. The number of green patents authorized in Beijing and Guangdong ranked first among cities or provinces at the same level, and the correlation with the carbon trading price was more significant.
In terms of positive and negative correlation, green technology maturity had a positive relationship with the carbon trading price in most regions. Technological innovation helps foster a low-carbon economy [4][39], further contributing to economic prosperity and driving up the carbon trading price [5][28].
2. Regional Analysis
After analyzing the results of the overall correlation degree, thwe researchers then analyzed the ranking of the factor correlation degree in each region. The top four rankings of the correlation degree in each region are shown in Table 34.
Next, thwe researchers ccompared the top four influencing factors in each region with the top four influencing factors overall and conducted a specific analysis of the influencing factors of different rankings from the perspective of regional characteristics.
(1) Crude Oil Price
Alberola et al. [6][21], Marimoutou and Soury [7][22], Wang and Yin [8][23] and Zhou and Li [3][25] demonstrated that energy prices are important factors influencing the carbon trading price. Coal and crude oil are important energy sources for industrial production. The combustion of these energy sources is the main source of carbon dioxide emissions. Energy prices have an important relationship with the carbon trading price. However, the overall correlation between the crude oil price and carbon trading price was ranked fifth in thisour entrypaper, which was higher than the correlation ranking for the coal price, which is related to China’s energy consumption structure. China’s coal consumption is much higher than that of crude oil. Due to the low demand price elasticity of coal caused by the high demand for coal, the correlation between the crude oil price and carbon trading price in various regions was therefore significant.
However, the correlation degree between the crude oil price and carbon trading prices in Shanghai and Fujian was low because the coal consumed in Shanghai comes from external procurement. Therefore, the correlation between the coal price and carbon trading price in Shanghai was more significant than that for the crude oil price. Fujian’s carbon trading market has been open for a short period of time. The carbon trading price there is more affected by the policy of free allocation of carbon quotas, and the correlation with energy prices was weak.
(2) Clean Energy Penetration
According to Table 2Table 3, clean energy penetration was positively correlated with the carbon trading price in all eight carbon trading pilot regions, which is consistent with the findings of Wang and Zhao [5][28]. The clean energy penetration in Shanghai and Tianjin had a relatively high correlation with the carbon trading price. The penetration rate of clean energy in Shanghai was higher among the eight regions, and Shanghai, as the most economically developed city in China, is a pioneer in the implementation of national policies. In order to comply with the national “carbon peak, carbon neutralization” policy and encourage the use of clean energy, it can be explained that the penetration of clean energy is an important factor affecting the carbon trading price in Shanghai. From the correlation degree ranking of Tianjin, thwe researchers ccan see that the green industry factors were in the top four, which shows that Tianjin has made great efforts to promote the green industry under the guidance of national policies.
(3) Air Temperature
There was a more significant effect from the temperature on the carbon trading price in Chongqing and Guangdong. Alberola et al. [6][21] and Mansanet-Bataller et al. [9][35] provided empirical evidence that extreme temperatures affect the EU ETS carbon price. Ji et al. [10][29] argued that in the long run, both high and low temperatures will increase the use of cooling and heating equipment, which will increase the demand for electricity and push up the carbon trading price. In contrast, the data analysis period of thisour researchpaper was short, and the analysis results were partially different from those in the existing literature. According to Table 3Table 4, overall, the air temperature had little impact on the carbon trading price, and the correlation between the air temperature and carbon trading price in Chongqing and Guangdong was relatively high. This is consistent with the summer temperature rankings of the two regions. Chongqing is located in the east of the Sichuan Basin with a low average altitude. Affected by the vertical decline in temperature, the downdraft is not easy to diffuse, and the temperature increases rapidly, resulting in extremely high temperatures in Chongqing in the summer. At the same time, Guangdong is located in the southernmost part of China, and the temperatures are also high in the summer. The high temperatures lead to the high utilization rate of air conditioning in the two regions, which will consume more energy and emit more carbon dioxide, which will affect the carbon trading price to a greater extent.
(4) Coal Price
As a whole, the correlation degree between the coal price and carbon trading price was not highly ranked. At the same time, Marimoutou and Soury [7][22] and Zhou and Li [3][25] concluded that there is a low correlation effect between the coal price and carbon trading price. However, the analysis results show that the correlation between Shanghai’s coal price and the carbon trading price was relatively high. This is because the Yangtze River Delta, where Shanghai is located, does not produce coal, but coal is an essential resource in the development process. Therefore, Shanghai’s coal source is basically purchased from the outside. It can be explained that the change in the coal price has a great impact on Shanghai’s carbon trading price.
(5) Free Carbon Quotas Issued by the Government
The free carbon quotas issued by the government in Fujian had a high correlation with the carbon trading price. Due to the shortest time of opening the carbon market in Fujian, the policy factors in the early stage of the market opening played a great role in guiding the carbon trading price. The amount of free carbon quotas issued by the government, which determine the supply of carbon emission rights, had an especially great impact on the carbon trading price. Therefore, it can be explained that the free carbon quotas issued by the government were an important factor affecting the carbon trading price in Fujian.
4.2. Temporal Dimension
The time dimension analysis was aimed at analyzing the relationship between various factors and carbon trading price in each month from 2017 to 2020. The average carbon trading price of the eight regions was used as the parent sequence, denoted as The data of each influencing factor measurement index in the eight regions were used as the characteristic sequence, denoted as (excluding the factors eliminated in the previous systematic cluster analysis).
4.2.1. Correlation Results of the Temporal Dimension
Through the gray relational analysis of the data, the correlation degree of each factor in each time period was obtained, and they are shown in Figure 46.
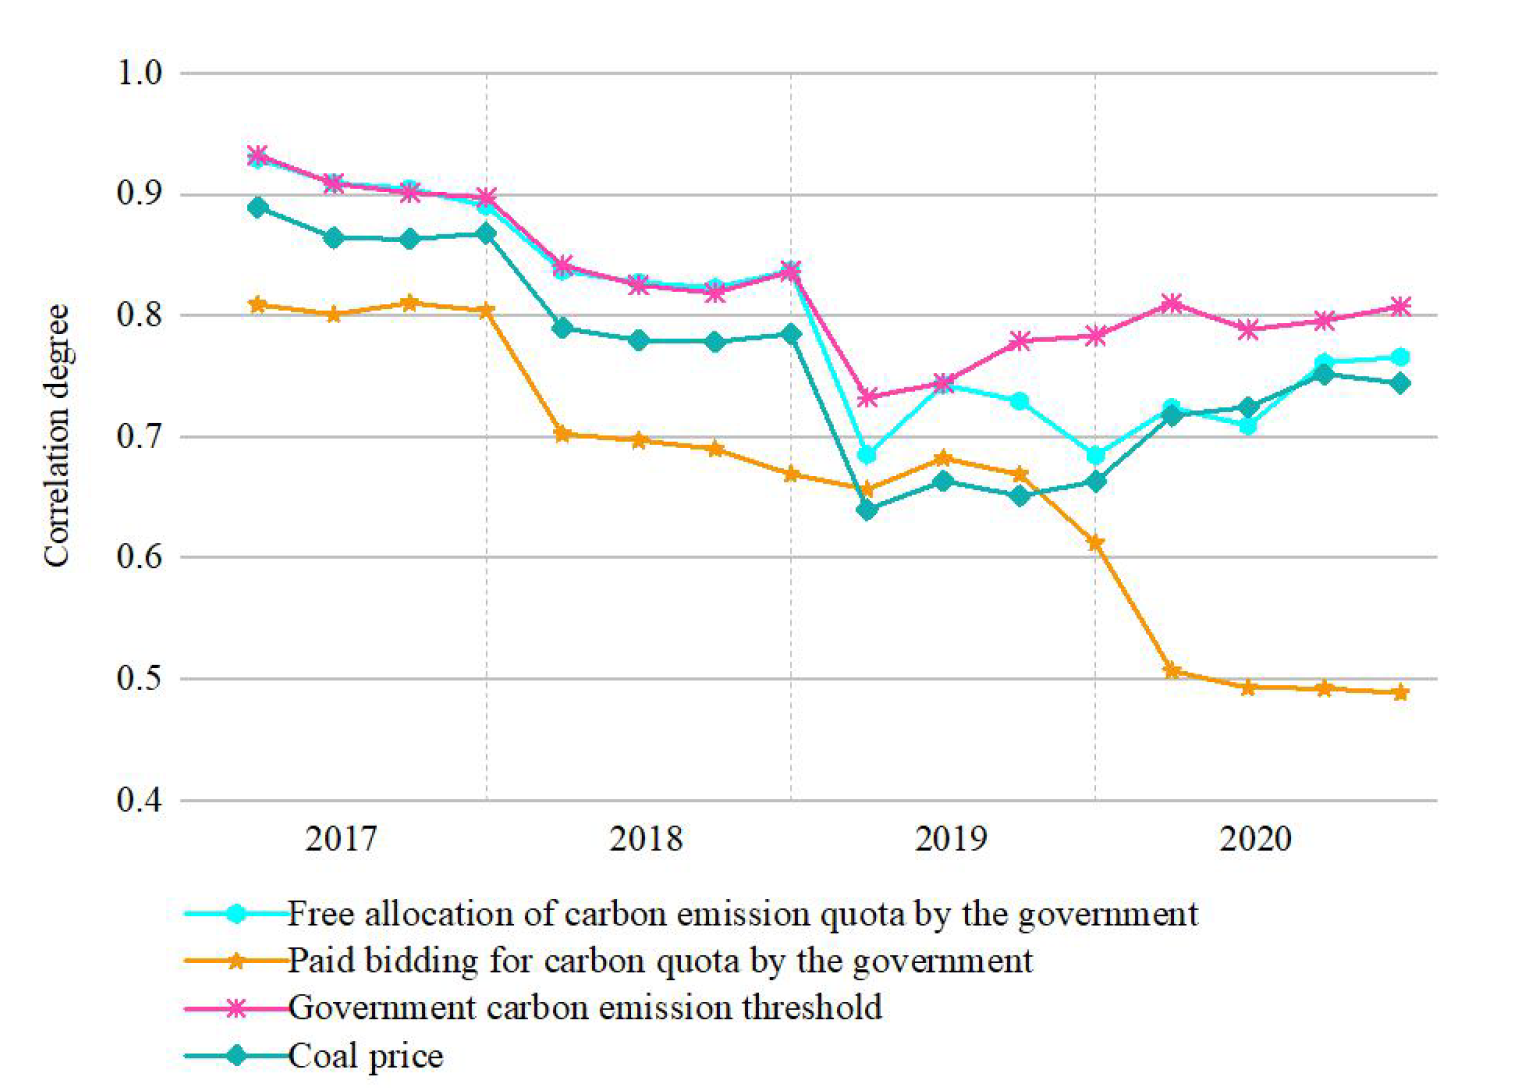
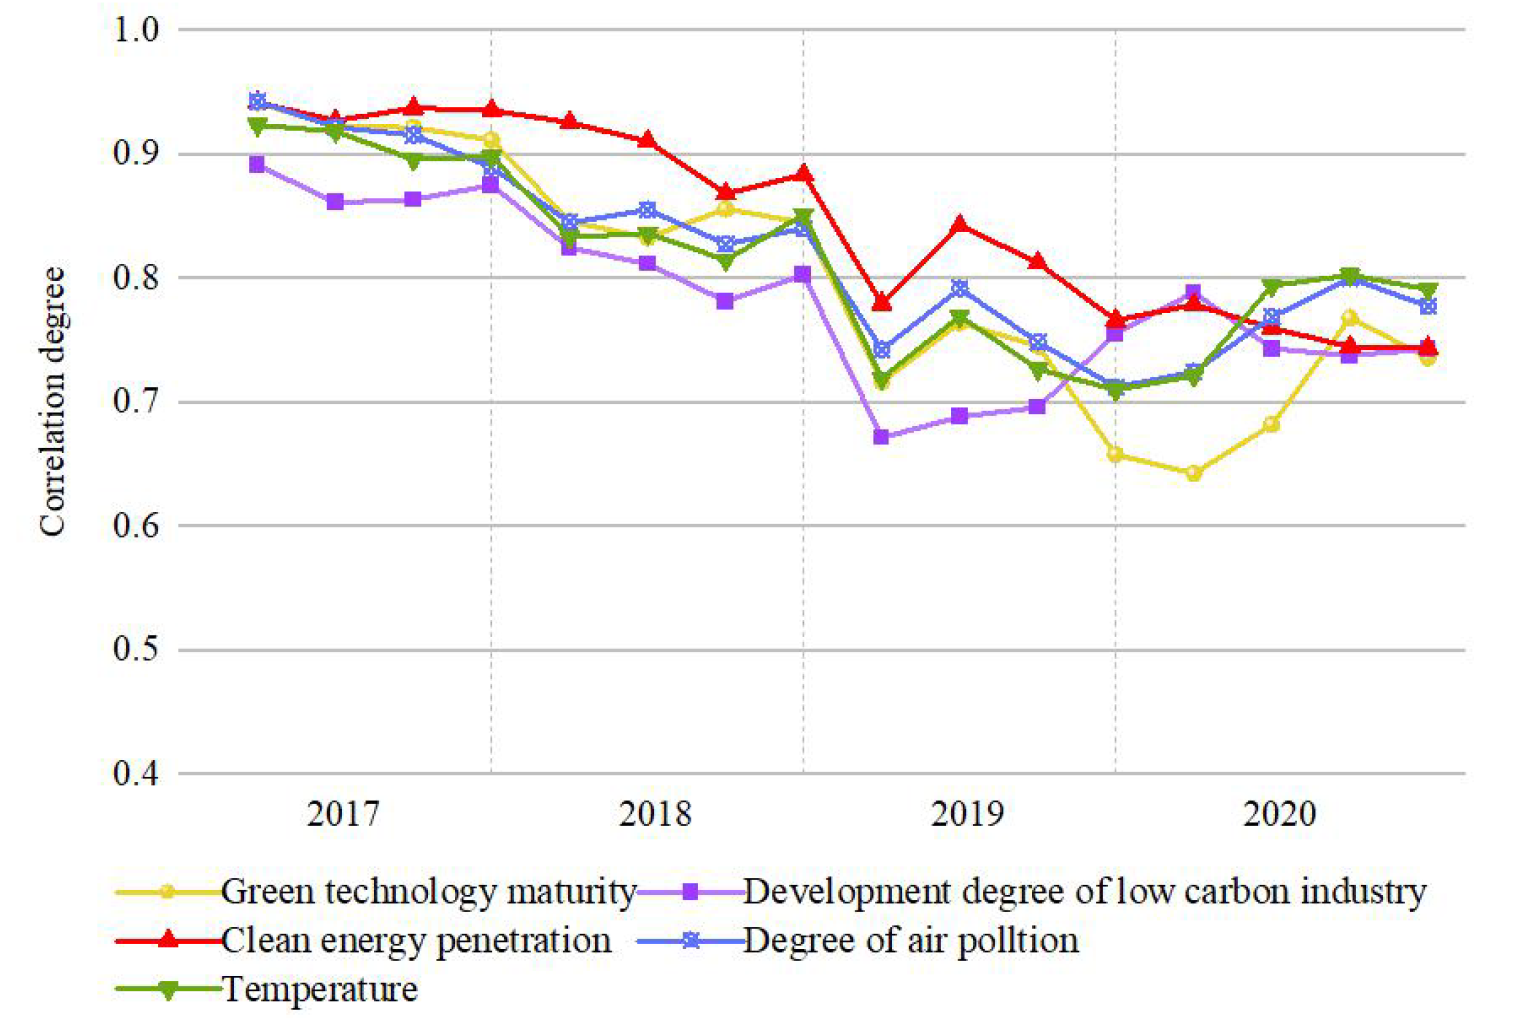
Figure 46. Line chart of correlation degree of each influencing factor. (Note: Since the data of the Shanghai Industrial Index, Bohai-Rim Steam-Coal Price Index and Brent crude oil price selected in different regions were the same, after averaging each index, the value of the above indicators in each region was 1. At the same time, the carbon trading price was the same in the same month in the same region. Therefore, after the same calculation steps, the correlation degrees between the above corresponding factors and the carbon trading price at the same time were also the same. Furthermore, the correlation degree curves of the industrial development level, coal price, crude oil price and carbon trading price were the same and coincided. For clarity, only the correlation degree curve of the coal price is shown in this figure.)
4.2.2. Analysis of Results
1. Overall Analysis
According to Figure 4Figure 6, with the change in time, although the correlation between various influencing factors and the carbon trading price showed an upward trend in individual stages, it showed a downward trend as a whole. This shows that with the operation of the carbon trading market, the improvement of the trading mechanism and the standardization of market rules, the maturity of the carbon trading market is higher, the carbon trading price is more stable, and the fluctuation range of the carbon trading price caused by the change of an influencing factor was smaller.
2. Regional Analysis
The change trend of the correlation degrees of various influencing factors was also different. Next, the ranking of the correlation degrees of various influencing factors in different stages is analyzed.
(1) Policy Factors
According to Figure 4Figure 6, the change trend of the correlation degree between the free carbon quotas issued by the government and the government carbon threshold was similar to the overall trend. Among the three policy factors, the association between the free carbon quotas issued by the government and the carbon trading price always remained first. It can be seen that among the policy factors, the free carbon quotas issued by the government were the most important factor affecting the carbon trading price. Compared with the free carbon quotas issued by the government, the government carbon threshold had a lesser impact on the carbon trading price.
Among the policy factors, the correlation degree between the carbon quotas issued by the government through bidding and the carbon trading price was the lowest, and the correlation degree trend deviated the most from the whole. Especially in 2020, the correlation degree curve between the carbon quotas issued by the government through bidding and the carbon trading price deviated the most obviously. This is because the number of paid bidding quotas issued by the government accounts for a small proportion of the total government carbon quota. The largest annual paid bidding quota was only 5 million tons, and the number of paid bidding quotas in 4 regions was 0, while the number of free allocation quotas amounted to thousands or even tens of thousands of tons. The very small number of paid bidding quotas had a weak impact on the carbon trading price. Moreover, in 2020, the four regions with paid bidding quotas reduced the number of paid bidding quotas, resulting in a sharp decrease in the correlation between the carbon quotas issued by the government through bidding and the carbon trading price in 2020.
(2) Green Industry Factors
According to Figure 4Figure 6, the correlation between three green industry factors and the carbon trading price has always been relatively high, but in 2020, the correlation degree of the three factors declined to a certain extent. Wu et al. [2][38] verified the difference in the role of each influencing factor in relation to the carbon trading price before and after the new crown pneumonia. Therefore, it is reasonable to assume that in 2020, as COVID-19 ravaged, the carbon emissions decreased significantly, the demand for carbon emissions from enterprises decreased, and the income of enterprises developing carbon reduction technologies from carbon emission trading decreased, which restrained the development of green industries to a certain extent. This led to a downward trend in the correlation between the three green industry factors and carbon trading prices in 2020.
(3) Economic Factors
The change trend of the correlation degree between the economic factors and carbon trading price is reflected in the coal price curve in Figure 4Figure 6. During the 4-year analysis period, the ranking of the correlation degree between the economic factors and carbon trading price was relatively stable, and the change trend was similar to the overall trend without any special changes.
(4) Environmental Factors
According to Figure 4Figure 6, the ranking of the correlation degree between the two environmental factors and the carbon trading price was relatively stable, which was similar to the change trend of the overall correlation degree. Due to the limited development of the green industry in 2020, the correlation degree between the two environmental factors and the carbon trading price in 2020 was ranked ahead of clean energy penetration and the development degree of the low-carbon industry.
5. Conclusions and Recommendations
5.1. Conclusions
By analyzing four types of factors that affect the carbon trading prices in eight regions of China—policy factors, green industry factors, economic factors, and environmental factors—and using an improved gray relational analysis method, thwe researchers cconducted an empirical study of the influencing factors that affect the carbon trading price in both the spatial and temporal dimensions, and the researchers cwe concluded the following:
1. From the perspective of the spatial dimension, on the whole, the correlation between the industrial development level and carbon trading price in the economic factors was the most significant, followed by the development degree of the low-carbon industry in the green industry factors, air pollution degree in the environmental factors and finally green technology maturity in the green industry factors. In addition, due to the different levels of economic development, energy consumption and construction of the carbon trading market in different regions, the correlation degree ranking of factors in different regions was different from the overall ranking. For example, the correlation degree between the crude oil price and local carbon trading price in Beijing, Tianjin, Shenzhen, Chongqing, Guangdong and Hubei was high. The clean energy penetration in Shanghai and Tianjin was highly correlated with the local carbon trading price. Shanghai had the highest correlation degree between the coal price and local carbon trading price.
2.From the perspective of the temporal dimension, with the development and improvement of the carbon trading market, the correlation degree between various factors and the carbon trading price showed a downward trend as a whole, and the fluctuation of the correlation degree of individual factors was different from the overall trend. It can be seen that the carbon trading market gradually matured, and the carbon trading price gradually became stable. The change of a certain factor will not lead to a sharp fluctuation in the carbon trading price. This reduces the risk of loss of enterprises due to sharp fluctuations in the carbon trading price and can effectively promote enterprises to conduct carbon trading, increase the trading volume and make the carbon trading mechanism play a better role in emissions reduction. This is a good sign for the realization of the “double carbon” goal in the future.
5.2. Recommendations
Based on the above analysis results and conclusions, thwe researchers put forward the following suggestions:
1. Promote new industrialization, and control the number of carbon quotas.
Industrial production is the main source of carbon dioxide emissions, and industrial development is the part that needs to be focused on. The results show that there is a significant correlation between the industrial development level and carbon trading price. In most regions, the industrial development level has a negative relationship with the local carbon trading price. The better the industrial development level is, the lower the carbon trading price is. Due to the promotion of China’s new industrialization policy, the carbon emissions of industrial enterprises are gradually reduced, and the demand for carbon emissions rights is reduced, resulting in the reduction of the carbon trading price. Therefore, while changing the mode of production and taking the road of new industrialization, the government should, in combination with the process of new industrialization in various regions, clarify the characteristics of industries covered by carbon trading and the differences in industrial distribution in different regions, define the limit of the total amount of the carbon quota, prevent the excessive supply of a quota from leading to a sharp decline in the carbon trading price and carbon emission costs, eliminate the enthusiasm of enterprises to take the road of new industrialization and actively reduce environmental pollution and then weaken the effectiveness of the market mechanism.
2. Encourage the development of low-carbon industries and promote the sharing of green technologies.
With the introduction of carbon reduction policies, the development of green low-carbon industries has broad prospects. The analysis results show that there is a significant correlation between the development degree of the low-carbon industry, green technology maturity and the carbon trading price. At present, due to the overall upward trend of the carbon trading price, the initial development degree of the low-carbon industry is not enough to lead to a decline in the carbon trading price, which is a good opportunity for China to encourage the development of the low-carbon industry. The upward trend of the carbon trading price can effectively stimulate enterprises to carry out low-carbon technology research and development and gain from trading surplus quotas. Therefore, thwe researchers shshould accelerate the formation of a new energy-led energy structure, vigorously promote the overall green transformation of social development, urge industry, communities and individuals to explore renewable energy and green technologies, strengthen the green and low-carbon industries and accelerate the development of clean energy application industries. At the same time, the exchange and sharing of the green and low-carbon technologies among regions should increase, and they should work together to achieve the goal of “double carbon”.
3. Steadily improve the ecological environment and prevent the rebound of air pollution.
The environment and climate are closely related to carbon dioxide emissions. The results show that there is a significant correlation between the air pollution degree and carbon trading price. Ensuring the stability of the environment and climate is very important for stabilizing the carbon trading price. Therefore, the rwesearchers should strictly abide by the red line of ecological protection, continue to promote air pollution control, steadily improve global air quality, prevent the rebound of air pollution, establish a scientific air quality control system (emissions list, sources and causes, control measures, implementation supervision, monitoring and evaluation) and accurately prevent dust emission. Stable air quality is conducive to a stable price for carbon trading. This weakens the negative impact of carbon trading price fluctuations to a certain extent.
4. Increase the number of allocation quotas through bidding, and appropriately increase the cost of carbon emissions.
The analysis results show that the amount of carbon quotas through bidding was very small compared with the number of free carbon quotas, resulting in a low correlation with the carbon trading price, and the change trend was also different from the change trend of the overall correlation. At present, four of the eight regions have not set carbon quotas through bidding. An appropriate carbon quota through bidding can increase the carbon emissions costs of enterprises, promote energy saving and emissions reduction and enable enterprises to gradually adapt to and accept carbon emissions trading. At the same time, the base price of paid bidding is generally the market-weighted average price, which helps to maintain stable operation of the carbon trading price to a certain extent.