Your browser does not fully support modern features. Please upgrade for a smoother experience.
Please note this is a comparison between Version 1 by Xiliang Liu and Version 2 by Camila Xu.
Rooftop solar photovoltaic (PV) retrofitting can greatly reduce the emissions of greenhouse gases, thus contributing to carbon neutrality. Retrofitting distributed rooftops with solar PV is an effective means of promoting “carbon peaking” and “carbon neutral” strategies. Rooftop solar PV is geographically unrestricted. The PV cells can be closely integrated into buildings without taking up additional land resources, not only saving land resources but also improving their utilization rate.
- GF-2 remote sensing images
- building rooftop recognition
- rooftop solar PV
- DeepLabv3+
- MLP
- carbon reduction
1. Introduction
At present, the primary energy sources globally are non-renewables including coal, oil, and natural gas. With global economic growth, energy demand continues to increase. Huge energy consumption reduces the availability of non-renewable energy, and the energy crisis has become one of the major problems plaguing the world [1]. In addition, the exploitation of fossil energy is a key factor in global environmental change and pollution, bringing serious ecological and environmental problems such as the greenhouse effect and global warming [1][2][1,2]. Among new energy types including wind, solar, tidal, and biomass power, solar can be considered a key solution for relieving environmental climate change [2]. As a representative technology for solar energy conversion, solar photovoltaic systems (photovoltaics, PV) already demonstrate competitive performance in terms of energy payback time (EPBT), greenhouse gas (GHG), and levelized cost of energy (LCOE) compared with conventional energy sources [3].
Retrofitting distributed rooftops with solar PV is an effective means of promoting “carbon peaking” and “carbon neutral” strategies. Rooftop solar PV is geographically unrestricted. The PV cells can be closely integrated into buildings without taking up additional land resources, not only saving land resources but also improving their utilization rate. In addition, the importance of large-scale PV development has been emphasized in the national renewable energy development plan [4]. Therefore, accurate assessment of long-time-series carbon emission reductions due to rooftop solar PV has become an important research topic.
2. Building Rooftop Recognition from Remote Sensing Images
Previous works on building rooftop extraction and recognition in high-resolution remote sensing images can be divided into two categories: artificial-feature-based methods and deep-learning-based methods [5][33]. The former have mainly utilized geometric, spectral, and background information about building rooftops. Lin and Nevatia [6][34] proposed an edge detection algorithm to extract building rooftops by detecting their walls and shadows. Zhang et al. [7][35] extracted the appearance of the external morphological boundaries of building rooftops based on the geometric linear relationship features after edge detection to improve the accuracy of recognition. Katartzis et al. [8][36] combined edge detection with the Markov model and employed aerial images to extract building rooftops. However, the edge detection method is susceptible to the influence of features similar to building morphology, resulting in building rooftop identification errors. Andres et al. [9][37] developed a threshold determination method based on the K-means algorithm to classify and identify building rooftops in remote sensing images, with a significant reduction in segmentation errors. Liu et al. [10][38] put forward a novel integrated classification method using a Support Vector Machine (SVM) and Decision Tree (DT), combining spectral transform and geographic location information for building rooftop recognition. Most of the methods mentioned above are based on spectral feature difference analysis, which can easily confuse similar features during recognition [11][39]. The latter group are deep-learning models that construct feature space automatically from high-resolution remote sensing images. These methods, especially Fully Convolutional Networks (FCNs) [12], introduce Convolutional Neural Network (CNN) structures to the image semantic domain, and have been widely used in recent years [13][14][15][40,41,42]. Liu et al. [16][43] proposed a new FCN structure consisting of a spatial residual convolution module for extracting building rooftops from remote sensing images, known as spatial residual onset. Shariah et al. [17][44] rewrote FCN without a pooling layer so that the network could retain as much important and useful information from the original image as possible. Ding et al. [18][45] proposed an adversarial method to consider the rectangular shape of buildings while performing building extraction. Although FCN-based methods have shown good performance in building rooftop extraction, such methods are not capable of ulteriorly fusing multi-scale feature information, due to the diverse patterns of buildings rooftops [19][46]. New network structures such as the Global Multiscale Codec Network (GMEDN) [20][47], U-shaped hollow pyramid pooling (USPP) networks [21][16], and Atrous Spatial Pyramid Pooling (ASPP) [22][48] may alleviate this problem in FCNs, but the object boundaries remain blurred and not continuous. The DeepLabv3+ network [23][49] adds the encoder-decoder structure based on an ASPP module to make full use of multi-scale feature information, paving a new direction for building rooftop recognition from high-resolution remote sensing images.3. The Actual Usable Area of Rooftop Solar PV Systems
The methods for estimating the actual usable area of rooftop solar PV systems can be broadly classified into three categories: fixed-value methods, manual intervention methods, and GIS-based methods [24][50]. The advantage of fixed-value methods is that the calculations are fast. For example, Vardimon [25][24] applied a constant value of 30% to calculate usable rooftop areas in Israel. However, the result was imprecise because the actual factors of influence were not considered. Manual intervention methods make assumptions based on empirical utilization factors [26][27][21,51]. Izquierdo et al. [28][52] estimated the available rooftop solar PV potential in Spain by combining information on population, number of buildings and land use with various coefficients (e.g., shading), although this method lacks generality. GIS-based methods can take more roof details into account, including 3D information from LiDAR, slope, orientation, and building structures [29][30][31][53,54,55]. However, high-resolution remote sensing images (e.g., GF-2, Sentinel 2, etc.) generally discard building elevation information for reasons of economics and data volume [32][22]. Moreover, different local subsidy policies can lead to various practical implementations of rooftop solar PV systems, an aspect which has been neglected in most existing research [33][56]. Table 1 summarizes the different PV policies implemented in different regions in China.Table 1.
PV subsidy policies in different regions of China.
| Region | Subsidy Object | Subsidy |
|---|---|---|
| Beijing | Resident-owned industries | 0.30 RMB/kWh |
| Parks and commercial facilities | 0.30 RMB/kWh | |
| Universities, primary schools and hospitals | 0.40 RMB/kWh | |
| Shanghai | Industries and commerce | 0.25 RMB/kWh |
| Schools | 0.55 RMB/kWh | |
| Individuals and nursing homes | 0.40 RMB/kWh | |
| Yiwu, Zhejiang | Residents | 0.20 RMB/kWh |
| Companies providing space | 0.30 RMB/kWh | |
| Investment companies | 0.10 RMB/kWh | |
| Suzhou, Jiangsu | Parks | 0.10 RMB/kWh |
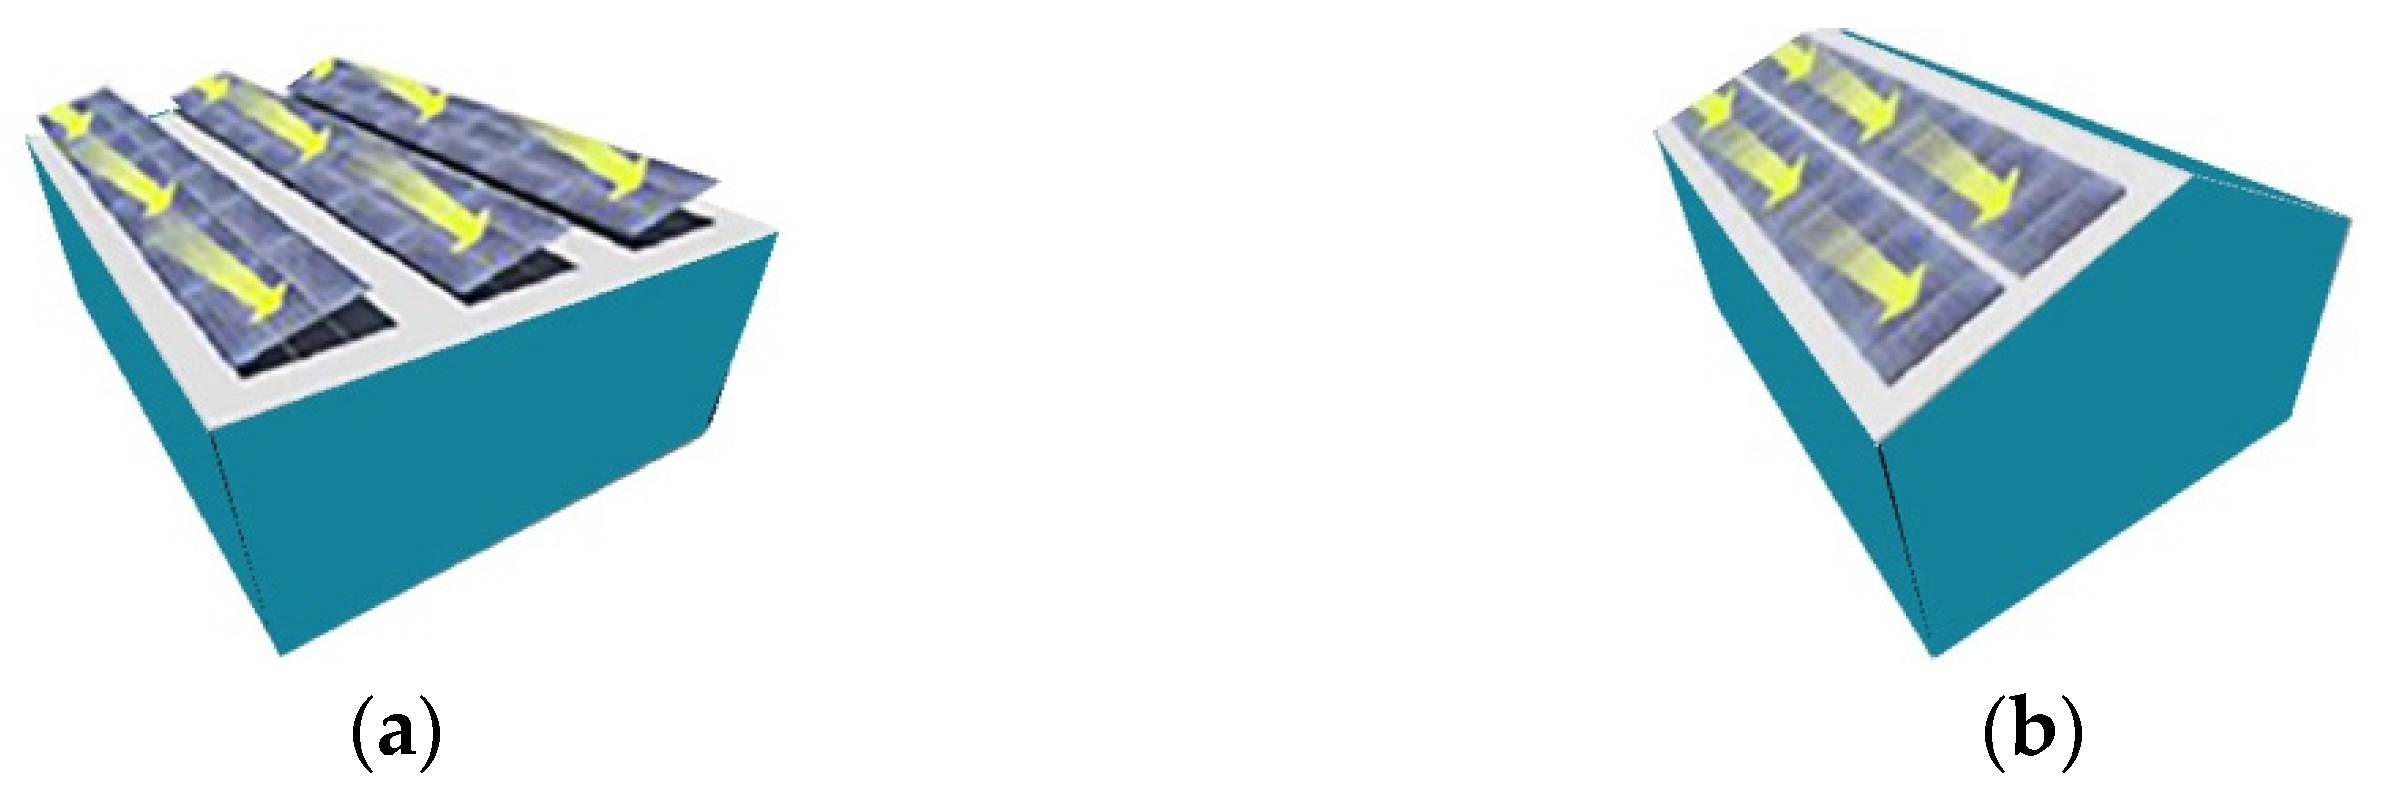
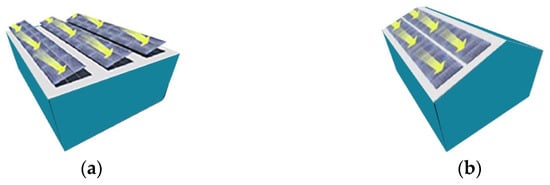
Figure 1. Different PV installation methods: (a) PV installation on terrace rooftops. It is necessary to consider the installation inclination and the mutual shading between the PV panels. (b) the PV installation on pitched rooftops. The PV panels are installed directly onto the pitched rooftops. Most of the buildings in northern China have terrace rooftops, and most use a combination of arrays to choose the best installation inclination according to the angle of solar radiation.