Your browser does not fully support modern features. Please upgrade for a smoother experience.
Please note this is a comparison between Version 2 by Dean Liu and Version 3 by Dean Liu.
Multiplex spatial analysis methods have recently been developed; these have offered insight into how cellular crosstalk dynamics and heterogeneity affect cancer prognoses and responses to treatment. Multiplex (imaging) technologies and computational analysis methods allow for the spatial visualization and quantification of cell–cell interactions and properties. These technological advances allow for the discovery of cellular interactions within the tumor microenvironment and provide detailed single-cell information on properties that define cellular behavior.
- tumor microenvironment
- multiplex imaging
- spatial analysis
- spatial technologies
1. Introduction
Tumors and their microenvironments often comprise complex and heterogeneous tissues made up of multiple cell types, mainly tumor cells, immune cells, fibroblasts, and endothelial cells. Interactions between these heterogeneous subsets in the tumor microenvironment (TME) are required for stepwise tumor evolution and tumor progression [1]. In recent years, insights into the TME have increased rapidly due to the development of single-cell multiplex measurements, such as single-cell transcriptomics and proteomics [2]. Many single-cell proteome and transcriptome studies have been performed on single-cell suspensions from dissociated tumors in order to analyze the heterogeneity of the immune microenvironment and how it relates to therapy responses [3]. For example, multiple single-cell studies, employing RNA sequencing and flow cytometry of isolated tumor infiltrating T cells, have demonstrated that T cell exhaustion in the TME can predict the response to immune checkpoint inhibition [4][5]. These single-cell approaches have led to the discovery of various tumor-specific cell types and activated transcriptional programs in the TME relevant to cancer evolution, cancer progression, or patients’ treatment responses. While these studies bring valuable and novel insights, single-cell isolation can cause the loss of cell types and proteins that are sensitive to dissociation methods, and disregards the extracellular matrix. Moreover, single-cell suspension analyses inevitably overlook tissue organization and specific cell–cell interactions in pathology. To overcome these limitations, spatial analysis technologies have been developed over the last decade to analyze the intact TME, which have, for example, revealed B cell and T cell co-localization in organized tertiary lymphoid structures (TLS) [6]. Some of the multiplex spatial technologies that have been developed utilize fluorescence-based microscopy [7][8][9], and others make use of antibody-targeted sequencing [10] or mass spectrometry-based detection to generate spatial expression data [11][12][13]. Spatial data has opened up new possibilities for studying specific tissue regions and cell subtypes, local cellular behavior marked by active signal transduction or receptor expression, and interactions between diverse cell types in the TME (Figure 1).
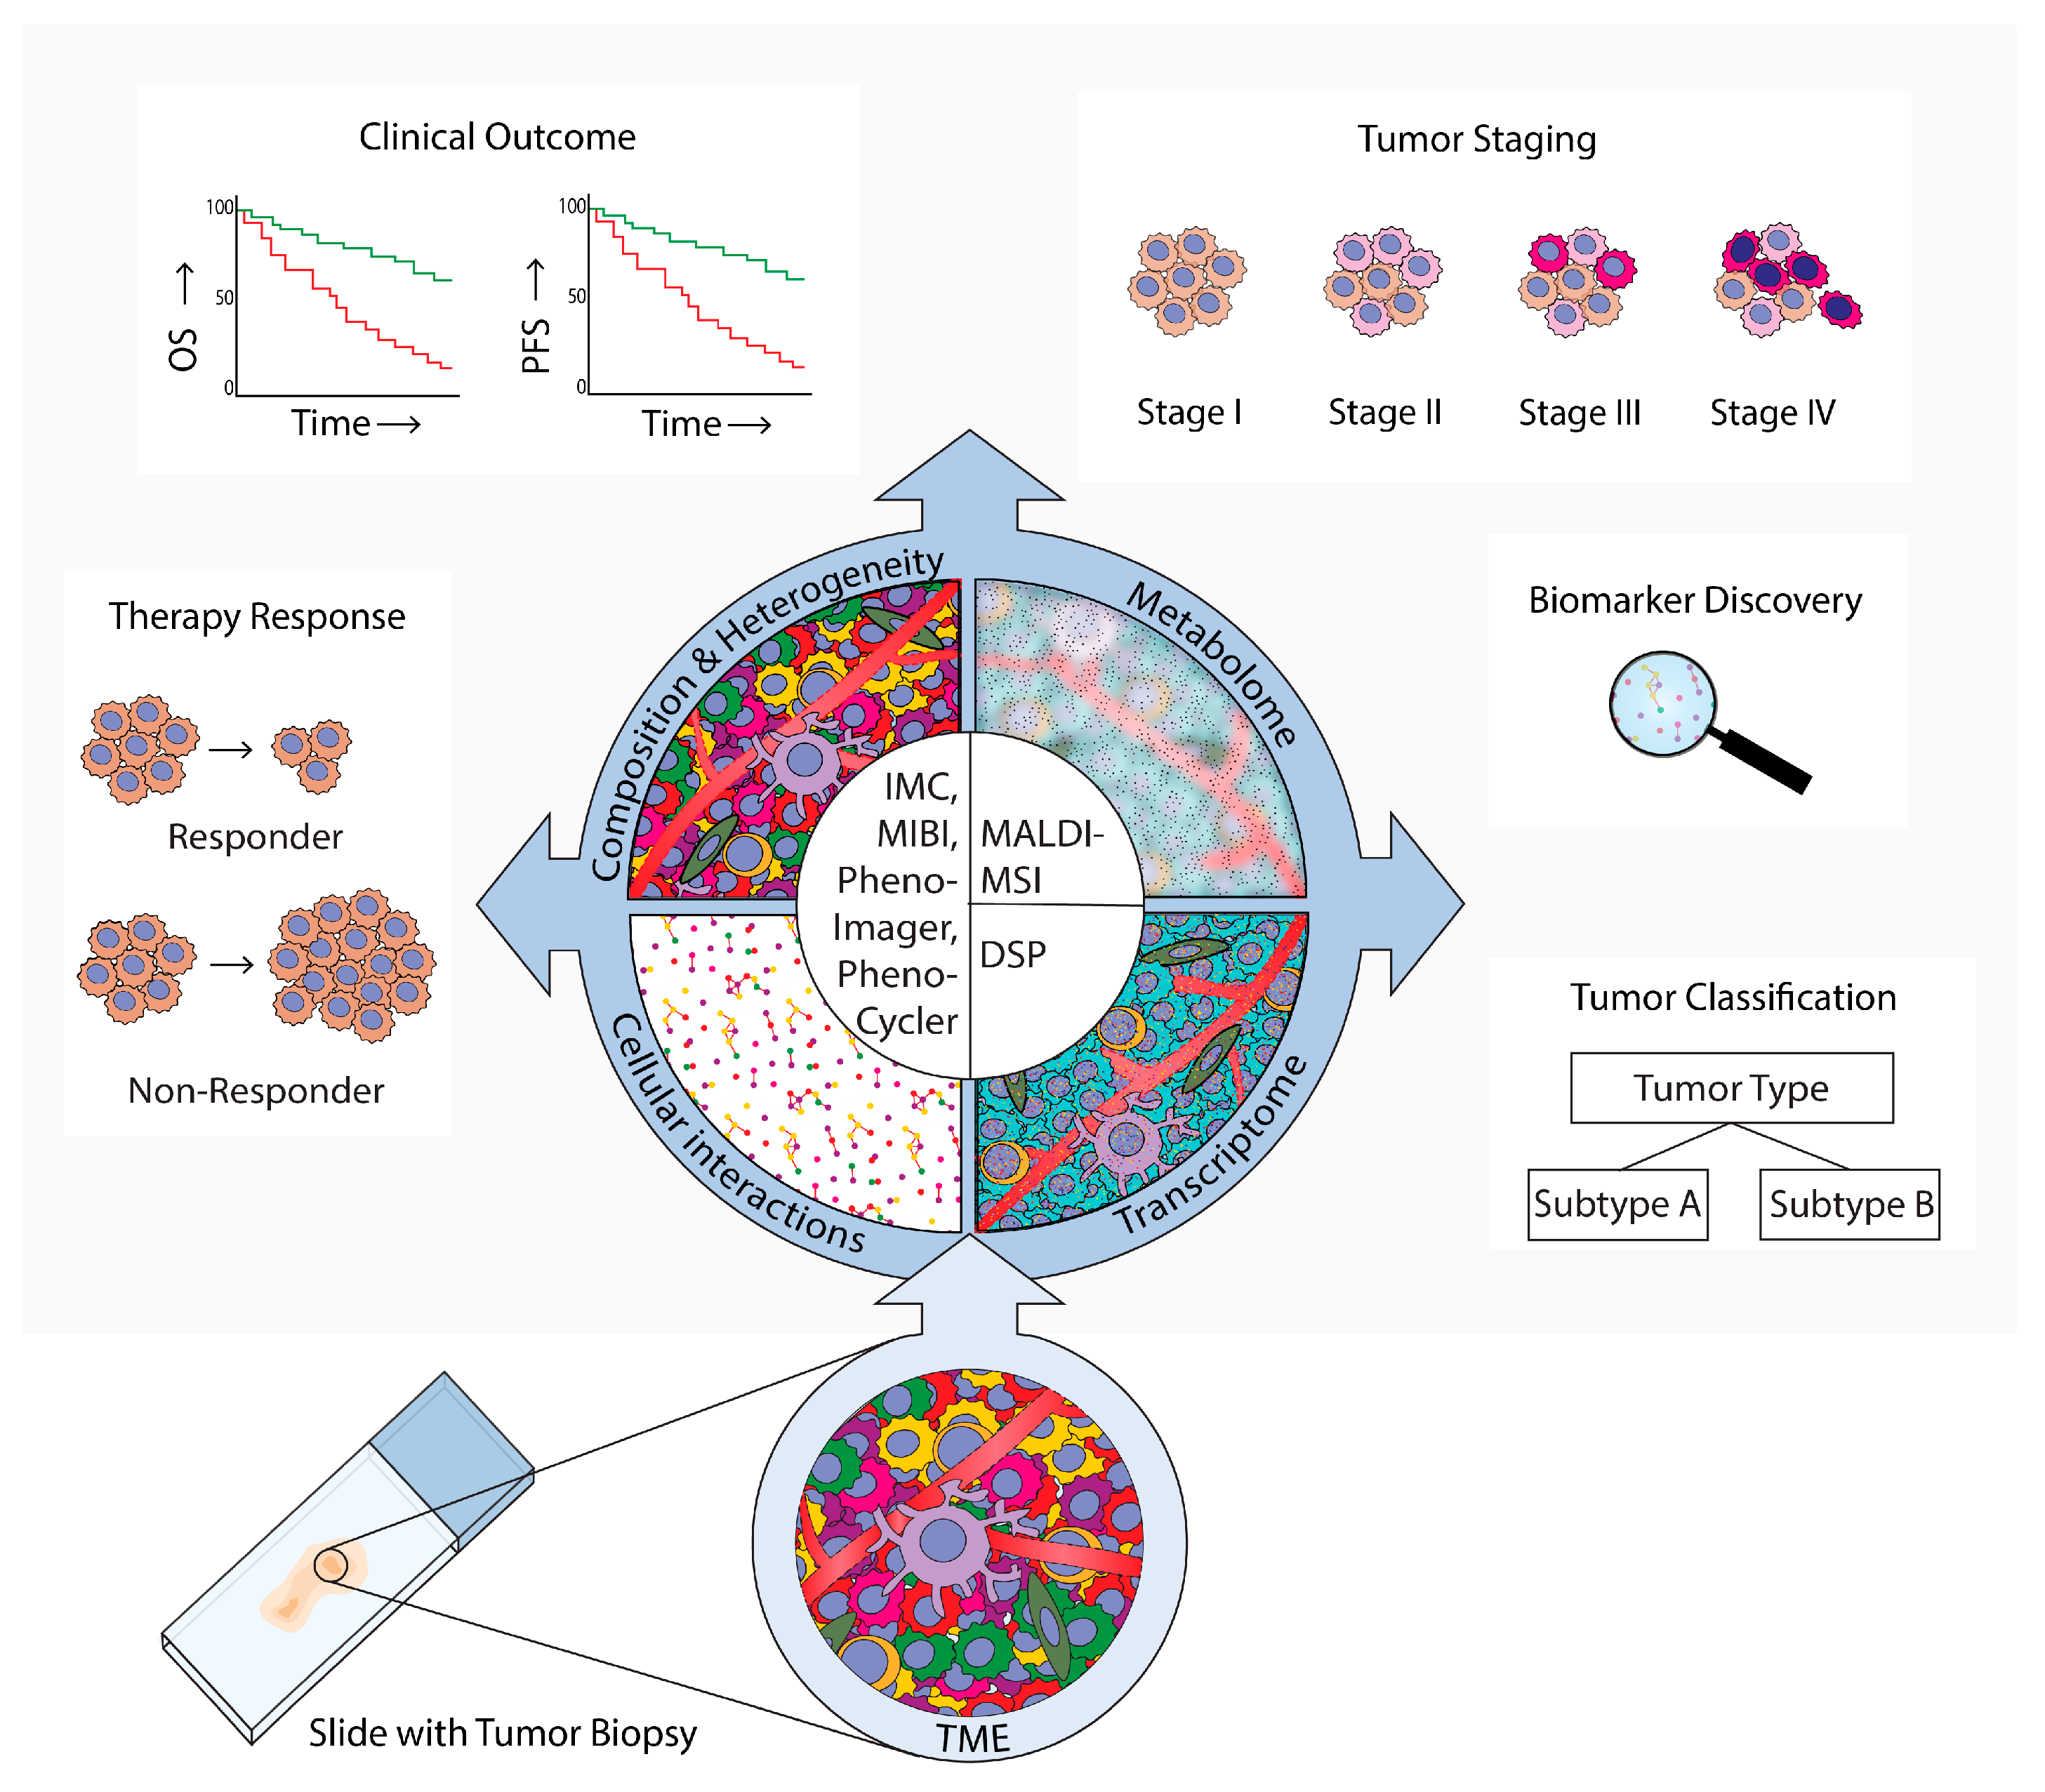
Figure 1. Spatial analysis of the tumor microenvironment (TME). Methods, results, and implications in cancer research. An overview of technologies that are used for TME spatial analyses in cancer research was provided. These technologies employ microscopy (PhenoImager, PhenoCycler), mass-spectrometry (imaging mass cytometry (IMC)), multiplexed ion beam imaging by time-of-flight (MIBI), and (matrix-assisted laser desorption ionization mass spectrometry imaging (MALDI-MS)), or digital spatial profiling (DSP). PhenoImager, PhenoCycler, IMC, and MIBI can be used to investigate single cells and to explore the cellular composition, heterogeneity, and cellular interactions of the TME. MALDI-MSI can be employed to investigate the TME metabolome in specific regions, and DSP can be used to explore the transcriptome in bulk cells of up to three different subsets. These multiplex spatial methods have provided novel insights into specific biomarkers and TME spatial hallmarks that can be used for tumor subtype classification. Moreover, these methods have uncovered which TME characteristics are related to tumor evolution and progression to advanced stages, clinical prognosis parameters such as overall survival (OS) and progression-free survival (PFS), and prediction of therapy responses.
2. Discoveries within the TME Using Multiplex Imaging Methods
In recent years, novel technologies have allowed for the development of spatial multiplex imaging, which enables the simultaneous analysis of >5 markers of interest on a tissue slide while conserving the spatial context. Multiplex spatial imaging methods allow the generation of large datasets containing clinically relevant biological data, consisting of multi-layered information. A schematic overview of each discussed method is provided in Figure 2, Figure 3, Figure 4, Figure 5, Figure 6 and Figure 7. These multiplex spatial methods facilitate in-depth investigation of TME heterogeneity within and between various cancer types. Reports of multiplex spatial imaging studies often provide detailed descriptions of differences in cellular composition, novel cellular phenotypes, or co-localization of specific cell types. Finally, data of these multiplex spatial imaging methods are used for tumor classification and grading, clinical outcomes, therapeutic responses to immune checkpoint inhibitors, or other therapies like chemotherapy, radiotherapy, or chemoradiotherapy.
2.1. Development of the Imaging Field
The first key studies used immunohistochemistry to analyze a limited number of markers simultaneously [14]. Immunohistochemistry has contributed to the development of the ‘immunoscore’, which showed for the first time that, compared to histopathological analysis, immunological imaging data of T cells in tumors provide a better predictor of the clinical outcome in patients with colorectal cancer (CRC). Besides immunohistochemistry, multiplex immunofluorescence is routinely used to stain the TME. Multiplex immunofluorescence is a method combining one to five different antibodies coupled with fluorophores. This method allowed for the first identification of distinct cellular phenotypes within the TME and is routinely used in diagnostics. The advantage of this method is that fluorophores can be imaged simultaneously, and the signal has a large linear range which allows quantification. These fluorophores must be chosen carefully to prevent signal spillover, and fluorophore combinations are limited.
2.2. PhenoImager
To minimize spillover in other channels, a multispectral imaging approach is required. A decade ago, the multispectral imager, PhenoImager, formerly known as Vectra (Figure 2), became commercially available to study the TME. This method allows the use of four to seven primary antibodies plus one nuclear counterstain. The antibody staining is performed in repetitive cycles of one primary antibody, secondary horseradish peroxidase (HRP)-labeled antibody, followed by addition of an opal polymer. This HRP converts the opal fluorophore with a short half-life. The primary and secondary antibodies are stripped, the following staining cycle begins, and finally the tissue slide is imaged using the PhenoImager. This method has been used to study tumor heterogeneity [15], cell–cell interactions [16], the spatial localization of subsets [9][17][18], prognosis prediction, [19][20][21][22][23], evaluation of therapeutic responses to immune checkpoint inhibition (ICPI), and changes in the immune landscape after chemotherapy with or without radiotherapy [24][25][26][27].
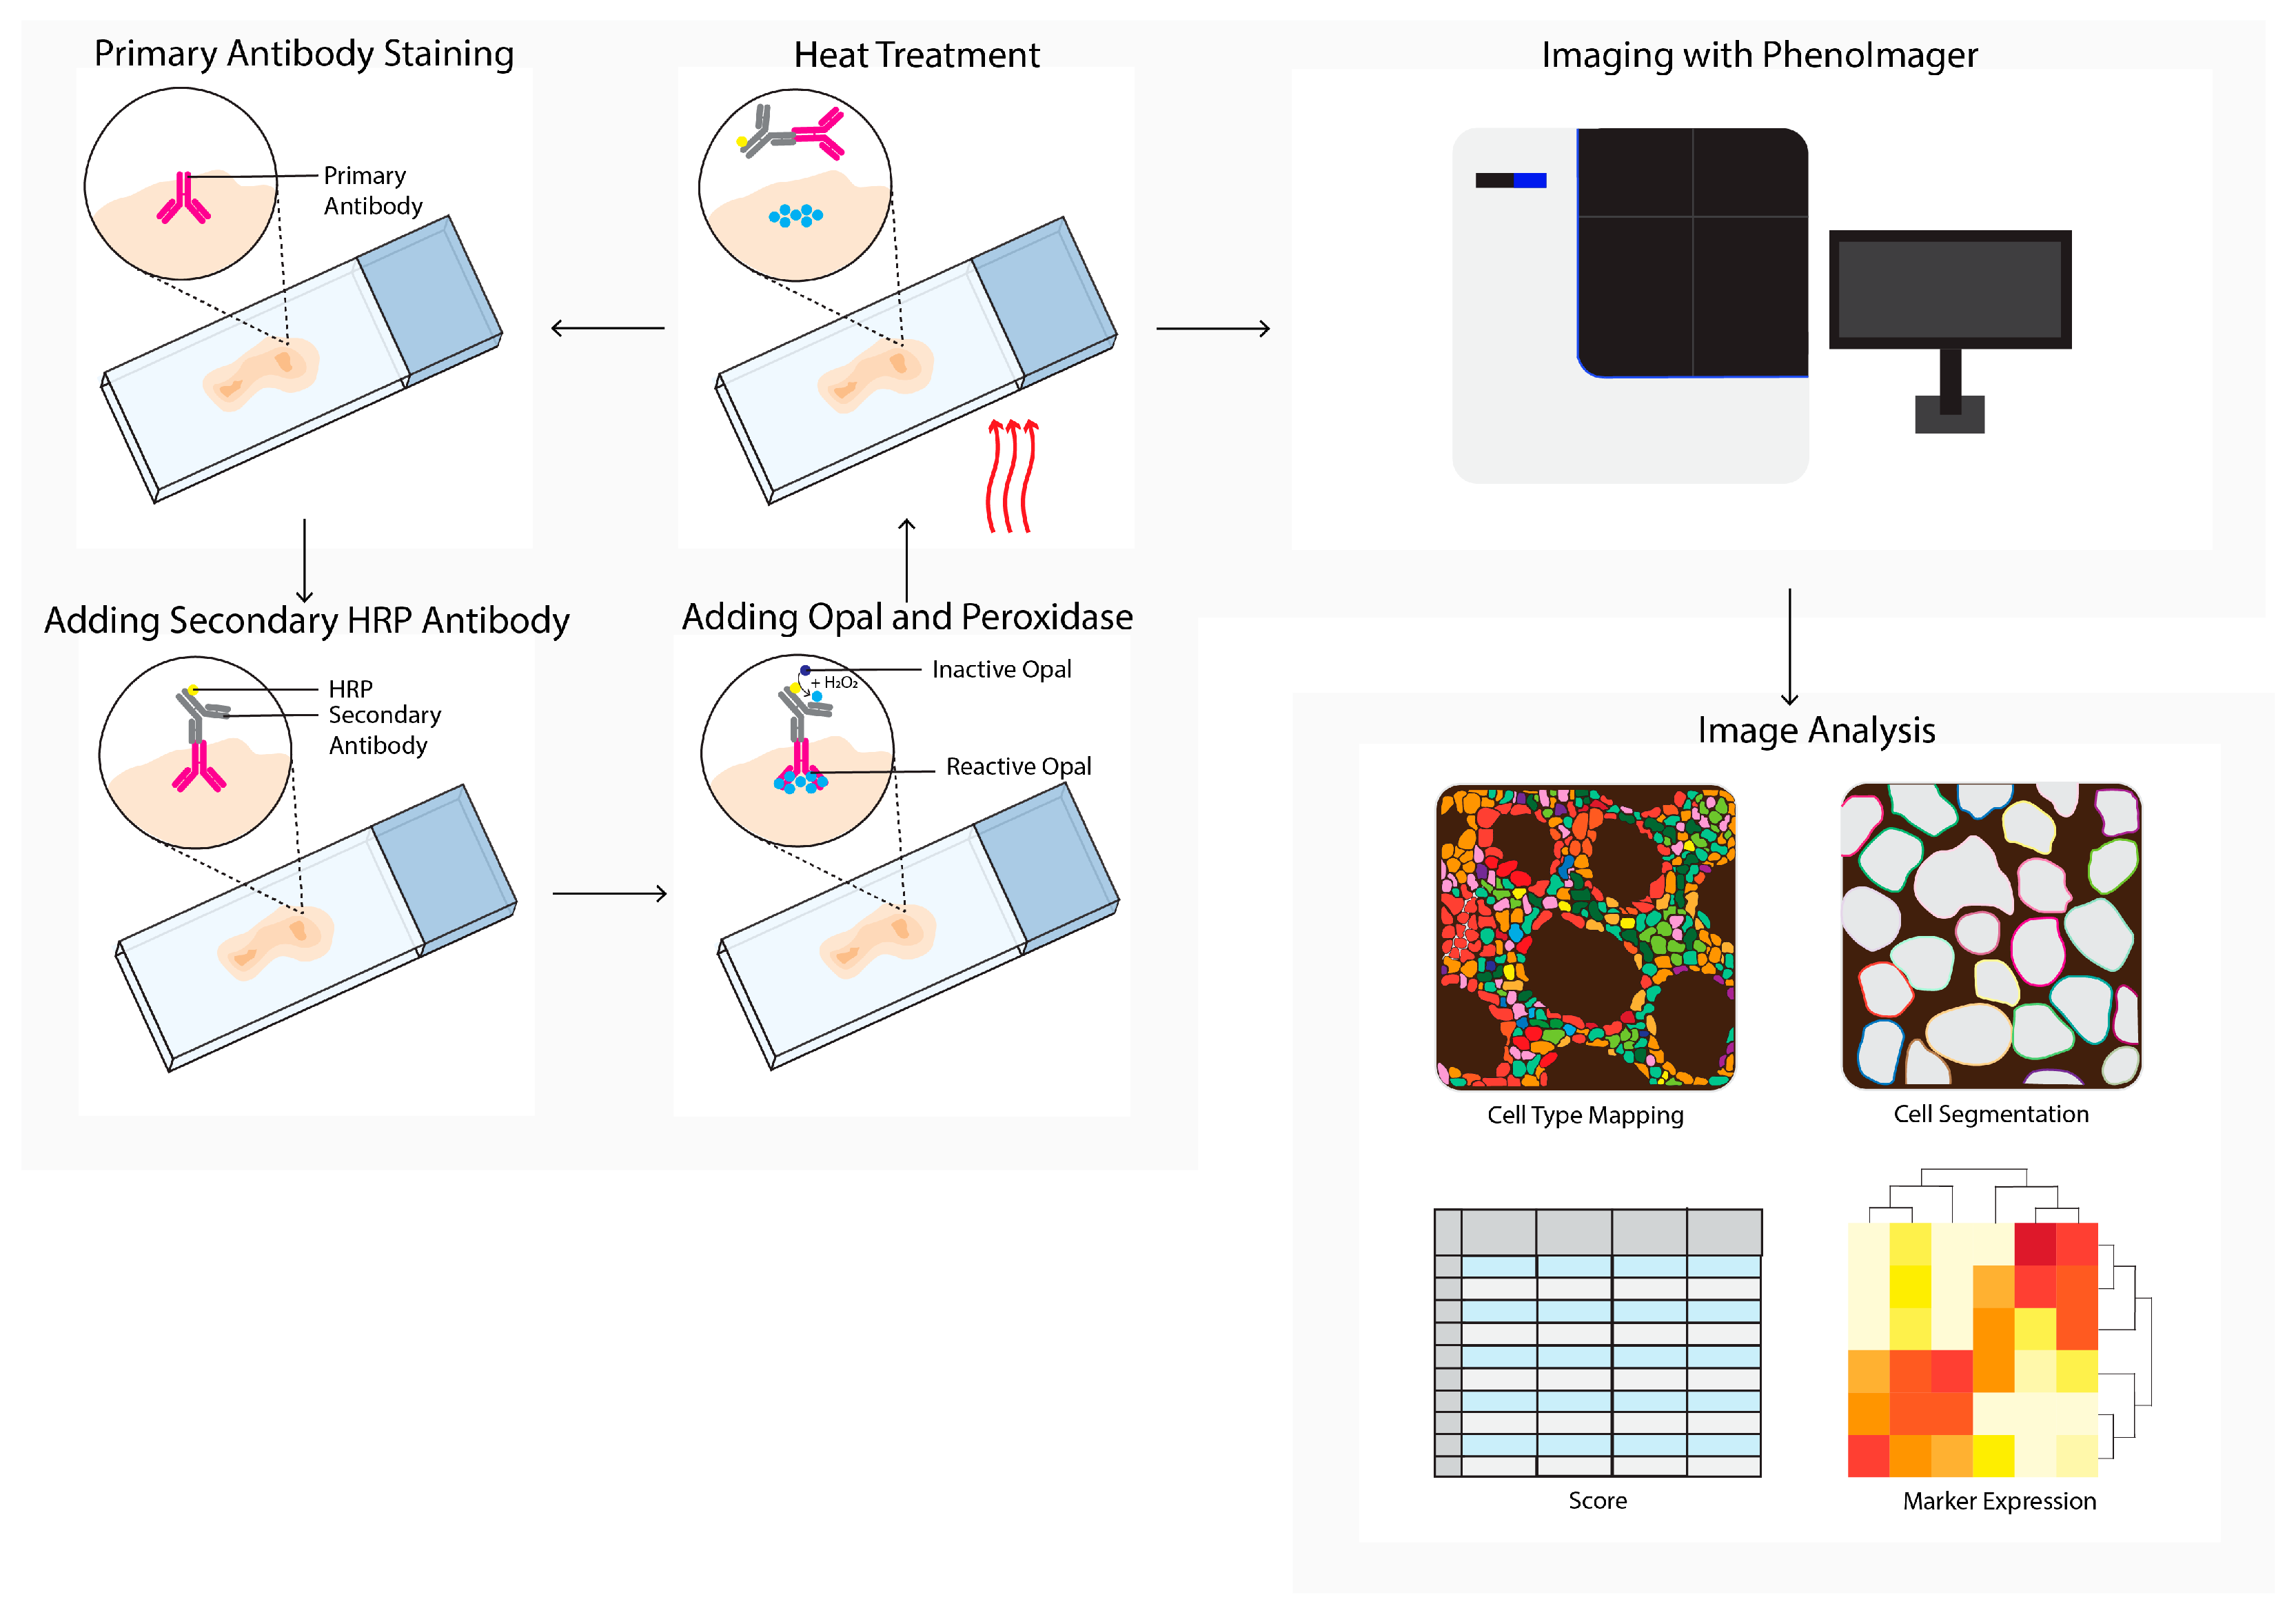
Figure 2. PhenoImager (Vectra) workflow. PhenoImager allows for the use of up to six primary antibodies (or eight in case of the high throughput version) and a nuclear stain. Antibody staining is performed in repetitive cycles of one primary antibody, a secondary horseradish peroxidase (HRP)-labeled antibody, followed by the addition of an opal polymer. HRP converts the opal fluorophore when peroxidase is present. Next, the primary and secondary antibodies are stripped by heat treatment, followed by the next staining cycle, and finally the tissue slide is analyzed using the PhenoImager microscopy system, resulting in data images. Cells in these images can be segmented and downstream analysis can be performed (e.g., cell type mapping and marker expression).
2.3. PhenoCycler
PhenoCycler, formerly known as CO-Detection by Indexing (CODEX), is a commercially available multiplex tissue imaging platform that uses oligonucleotide conjugated antibodies to detect up to one hundred markers in the same tissue (Figure 3). Initial antibody staining is followed by hybridization cycles with three reporter oligonucleotides containing spectrum-separable fluorophores. These reporter oligonucleotides hybridize with the unique antisense oligonucleotide that is conjugated to the primary antibody. After each cycle, a microscopy image is acquired, followed by removing the fluorophores and a novel hybridization cycle. Upon the completion of all cycles, the images are compiled and aligned to achieve a multiplex image [7]. This cycle-dependent approach drastically increased the number of potential markers, and opened opportunities for detailed characterization and spatial exploration of the TME [28][29].
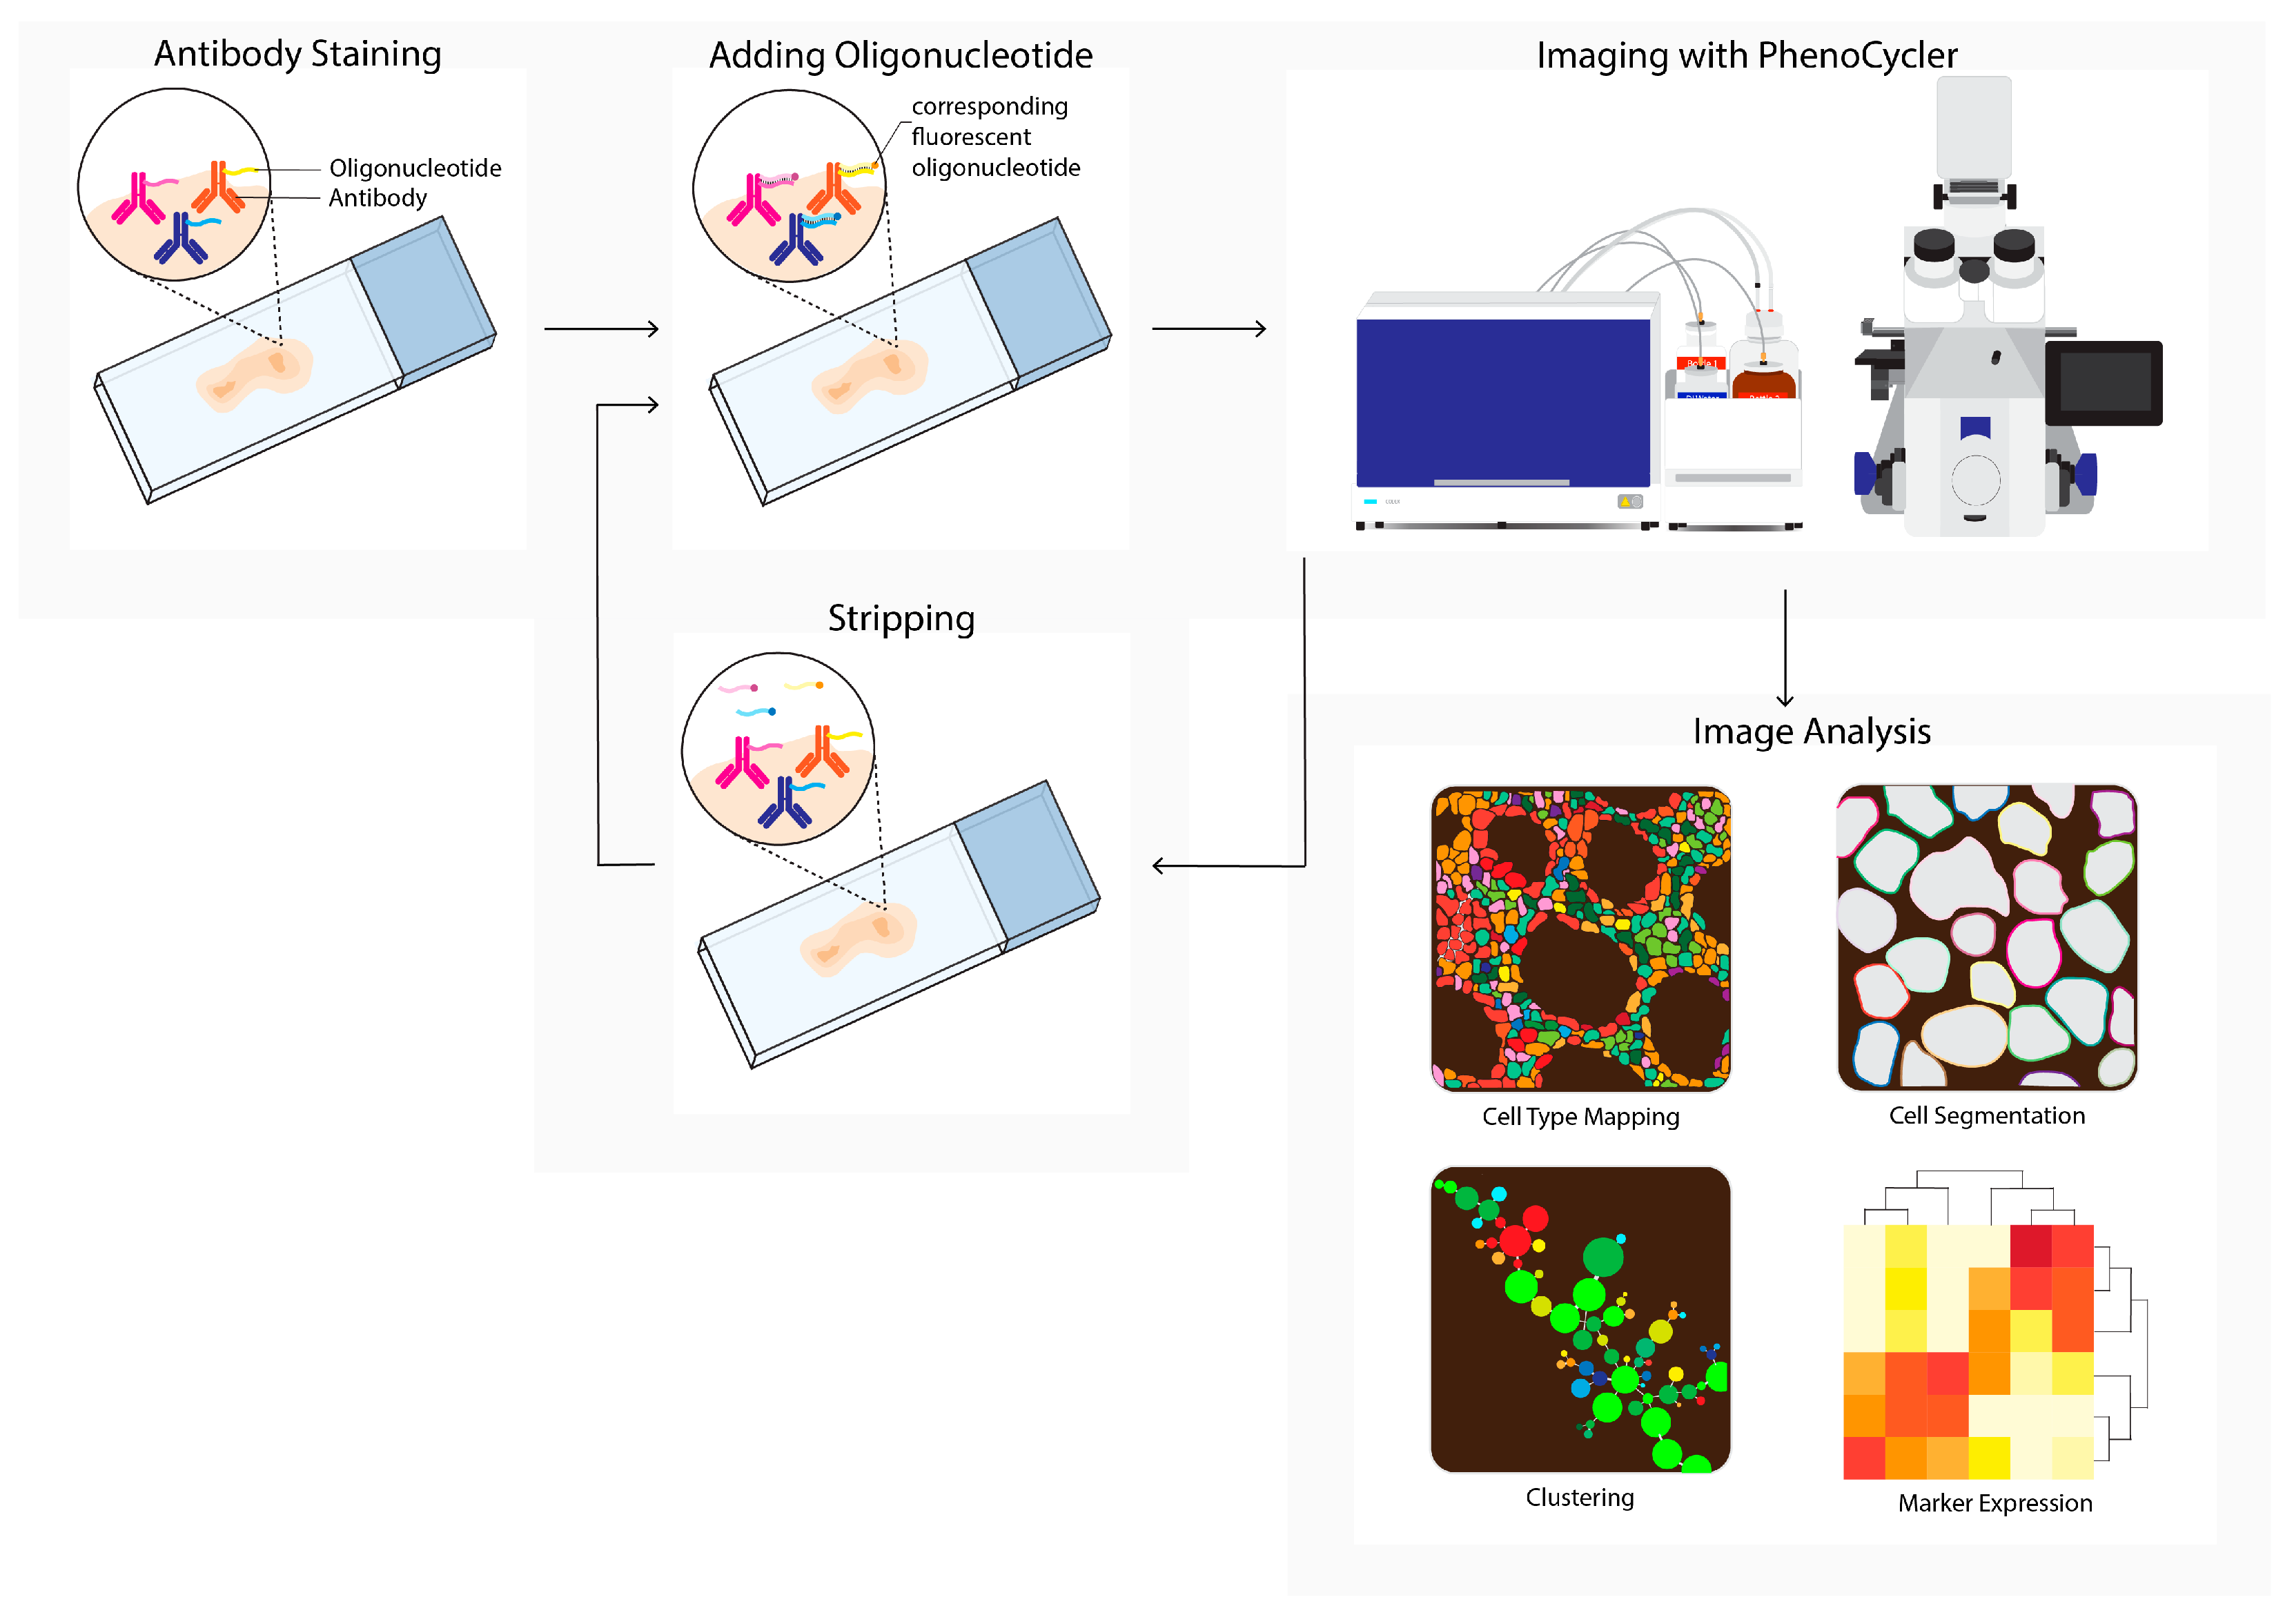
Figure 3. PhenoCycler (CODEX) workflow. Tissue is labeled using oligonucleotide-conjugated antibodies to detect up to one hundred markers simultaneously. Initial antibody staining is followed by hybridization cycles with three reporter oligonucleotides containing spectrum-separable fluorophores, which hybridize with the unique antisense oligonucleotide conjugated to the primary antibody (left). After each cycle, a microscopy image is acquired (imaging with PhenoCycler). Next, reporters are removed; this is followed by the next reporter hybridization cycle. Images from all cycles are compiled and registered to generate multiplex data images. During imaging analysis, these images can be processed into single-cell expression data and downstream analysis is performed (e.g., cell type mapping, clustering, marker expression).
Characterization and Spatial Exploration of the TME
One of the first studies to explore the spatial characterizations of the TME using PhenoCycler was performed in a stage III-IV CRC cohort. This study employed a fifty-six-marker panel to investigate differences between thirty-five colorectal tumors with de novo TLS at the invasive front, compared to tumors that lacked TLSs but contained a diffuse tumor infiltrate [29]. The single-cell data were visualized as cellular neighborhoods and revealed certain differences. For example, cellular neighborhoods enriched for granulocytes and PD-1+CD4+ T cells were positively correlated with overall survival for patients with colorectal tumors that displayed diffuse infiltrates. Moreover, overall survival in these patients was associated with cellular neighborhoods containing high CD4+ T cells frequencies and CD4+/CD8+ T cell ratios. In contrast, frequencies outside these cellular neighborhoods did not influence the overall survival rate.
More recently, PhenoCycler has also been used to elucidate the role of the S100A7/cytosolic phospholipase A2 (cPLA2)/Prostaglandin E2 (PGE2) signaling pathway in breast cancer; it was found that S100A7 is associated with tumor growth and metastasis [28]. Breast cancer-bearing mice that overexpressed S100A7 were treated with the cPLA2 inhibitor, and the analysis revealed changes in T cell composition and cellular interactions. Cluster analysis revealed that cPLA2 inhibitor treatment promoted infiltration of activated CD4+ T cells and CD8+ T cells within the tumor. Furthermore, the highest degree of interaction among CD4+ and CD8+ T subsets was observed after cPLA2 inhibitor treatment. Studying these anti-tumor responses in relation to tumor-infiltrated T cells during treatment is essential for establishing whether the number of infiltrating immune cells is correlated with the anti-tumor response. Additionally, studies that focus on immunological changes within the TME will help to uncover biological mechanisms induced by the treatment, and enable biomarker discovery to predict clinical responses.
2.4. Multiplexed Ion Beam Imaging by Time-of-Flight
Multiplexed ion beam imaging by time-of-flight (MIBI-TOF, Figure 4) can theoretically utilize up to 100 primary antibodies, each of which can be coupled to unique metal isotopes. A multiplex antibody panel is incubated on a tissue section, and a primary oxygen duoplasmatron ion beam applies a raster to the sample surface. Next, the beam ionizes the metal-conjugated antibody-containing rasters, which are subsequently detected as secondary ions separated by mass and charge by time-of-flight mass spectrometry. The mass spectrometry data are integrated with the single-cell images to generate a tabular chart that contains single-cell data, which can be used to generate spatial profiles [12]. MIBI-TOF is used to study tumor spatial heterogeneity [30][31][32] and tumor progression [33].
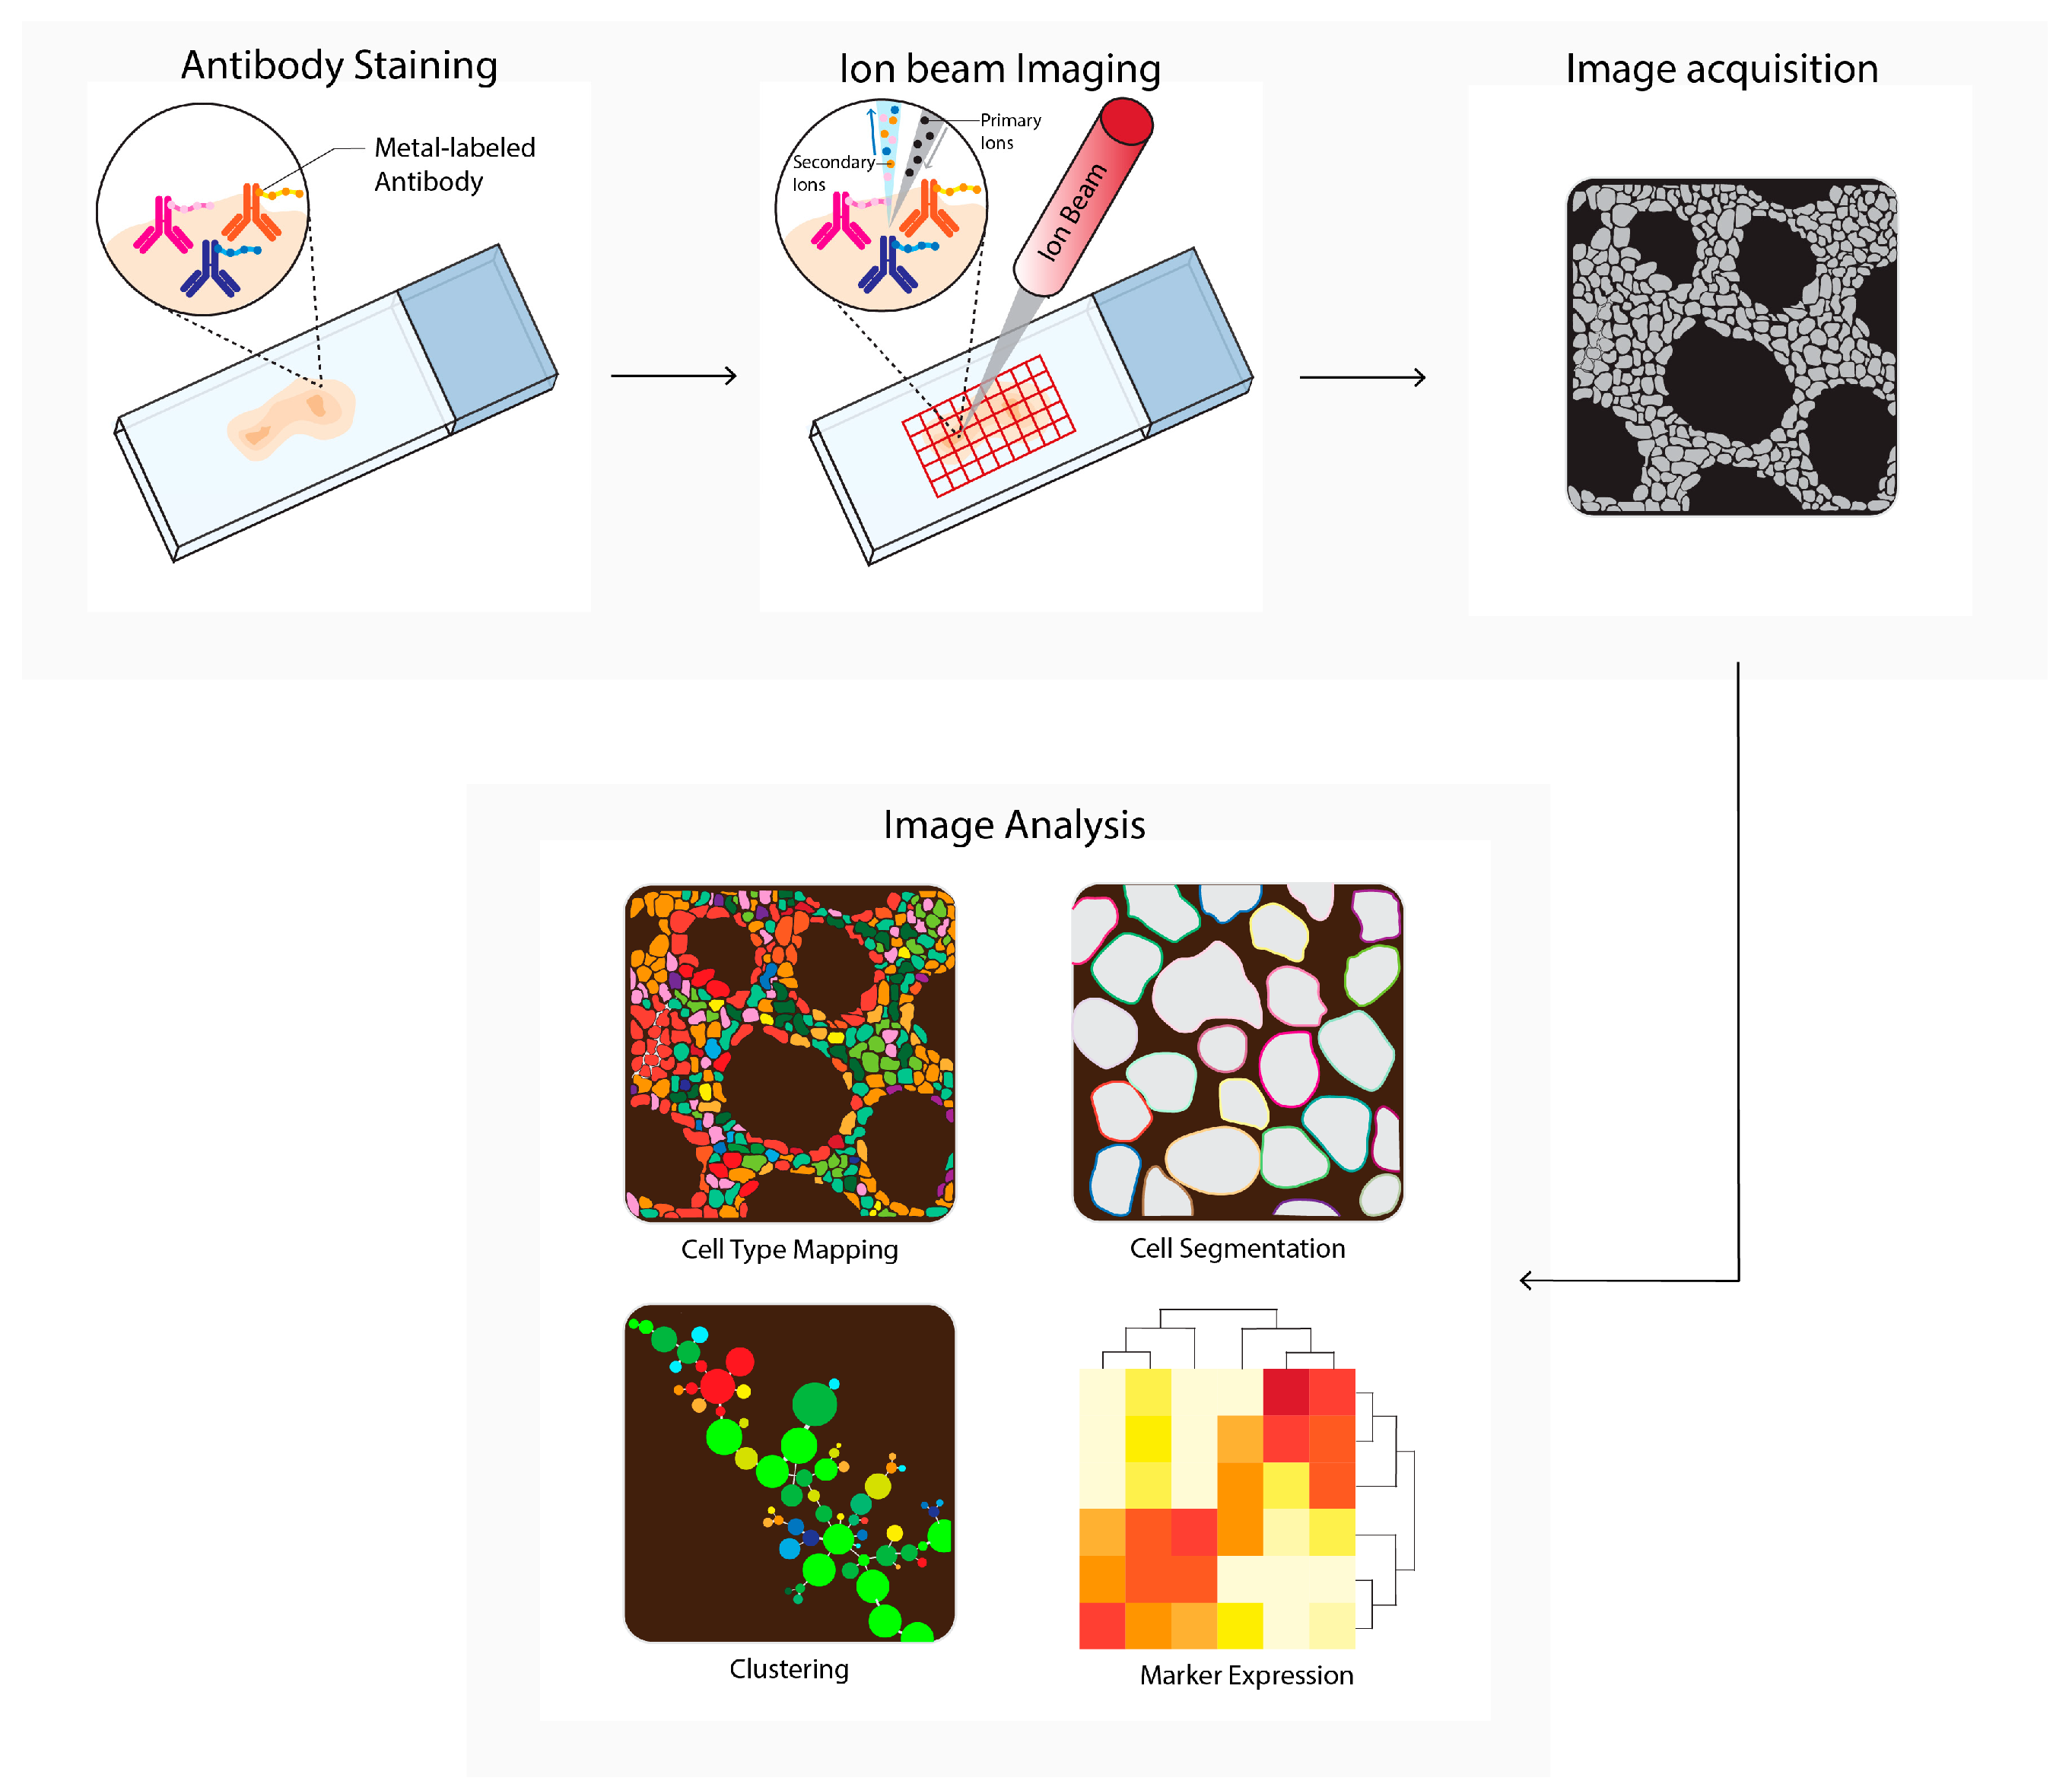
Figure 4. Multiplexed ion beam imaging by time-of-flight (MIBI-TOF) workflow. Tissues are first labeled with a multiplex panel of antibodies conjugated with heavy metals containing polymers. Next, these are directly ionized to generate secondary ions. Ions are filtered and detected by time-of flight mass spectrometry. Next, multiplex images are generated, containing images depicting expressions for each separate antibody–metal conjugate. These images can be processed into single-cell expression data. During imaging analysis, these images can be processed into single-cell expression data and downstream analysis is performed (e.g., cell type mapping, clustering, marker expression).
2.5. Imaging Mass Cytometry
Imaging mass cytometry (IMC, Figure 5) uses a pulsed ultraviolet laser to ablate tissue labeled with metal-labeled antibodies from a glass slide [13]. The ablated tissue is taken up into an argon gas flow and ionized by the plasma, forming ion clouds. These ion clouds pass a filter to enrich the reporter ions and remove common biological elements, after which the signal is quantified by time-of-flight mass spectrometry. The data table integrates single ion signals per pixel, after which image and single cell segmentation can be converted to single-cell data for downstream analysis. In cancer research, IMC is used to discover novel phenotypes and biomarkers, or to study TME heterogeneity [34][35][36][37][38][39][40][41][42][43][44]. IMC is also used to predict prognosis and therapy responses in humans or in mice [35][38][45][46][47][48][49][50][51][52].
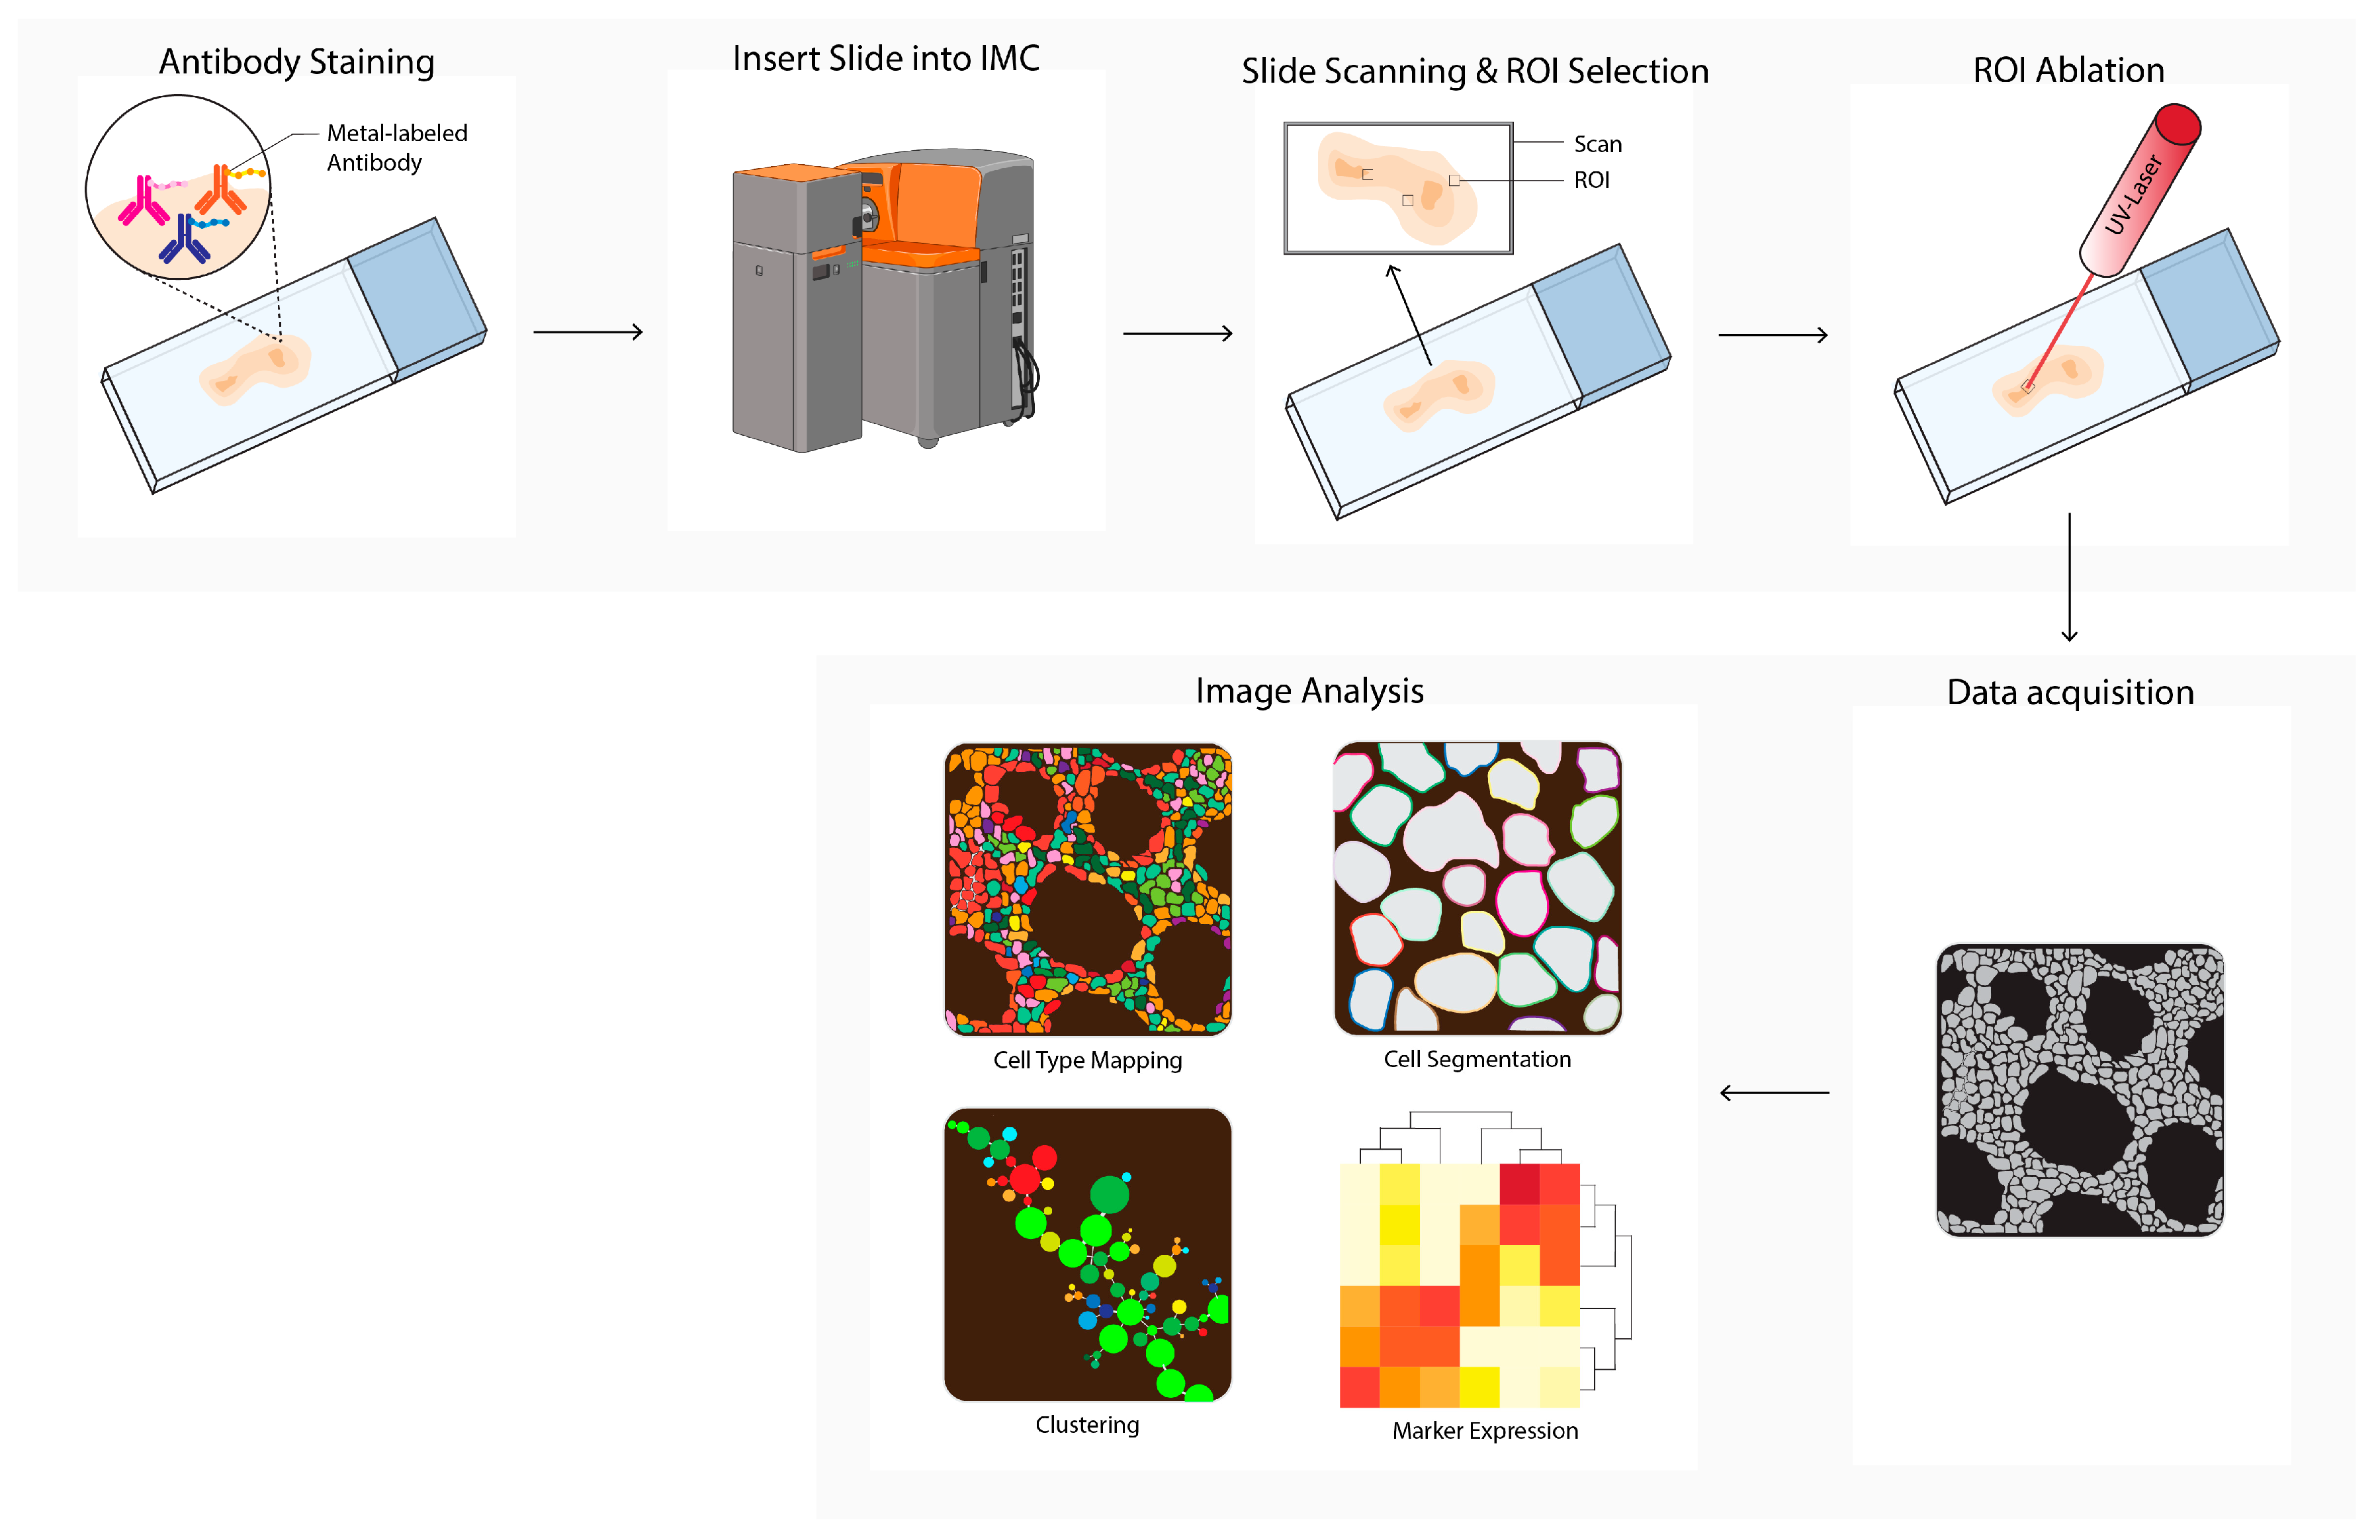
Figure 5. Imaging mass cytometry (IMC) workflow. Tissues are first labeled with a multiplex panel of antibodies conjugated with heavy metal containing polymers. Next, the slide is inserted into the imaging mass cytometer (IMC) and regions of interest (ROI) are selected. Small pieces of 1 uM2 of labeled tissue are consecutively ablated with a UV-laser and ionized. Ions are filtered and detected by time-of flight mass spectrometry. Next, multiplex images are generated, containing images depicting expressions for each separate antibody–metal conjugate. During imaging analysis, these images can be processed into single-cell expression data and downstream analysis is performed (e.g., cell type mapping, clustering, marker expression). The Hyperion cartoon was acquired from BioRender.
2.6. Matrix-Assisted Laser Desorption Ionization Mass Spectrometry Imaging
Matrix-assisted laser desorption ionization mass spectrometry imaging (MALDI-MSI, Figure 6) is a labeling-free method for two-dimensional and three-dimensional quantitative spatial analysis of the molecular distribution of molecules, such as proteins, lipids, metabolites, and glycans in tissue [53]. The microscope slide containing either formalin-fixed paraffin-embedded (FFPE) or fresh frozen (FF) tissue sections is processed, and a matrix is applied. After matrix deposition, the slide is inserted into the MALDI-MSI, and a laser creates a 10–150 micrometer raster. The laser beam ionizes a spot in each raster, and the ionized analytes from the raster are transferred into the mass spectrometer for compound identification. In parallel, an image is created by combining the data of the spot location with the corresponding measured mass spectrum. In the field of cancer research, MALDI-MSI has been used to analyze drug (metabolite) distribution in the TME, tumor subtyping, tumor grading, or biomarker discovery [54][55][56][57][58][59]. MALDI-MSI is also used to predict tumor progression and clinical outcomes [60][61].
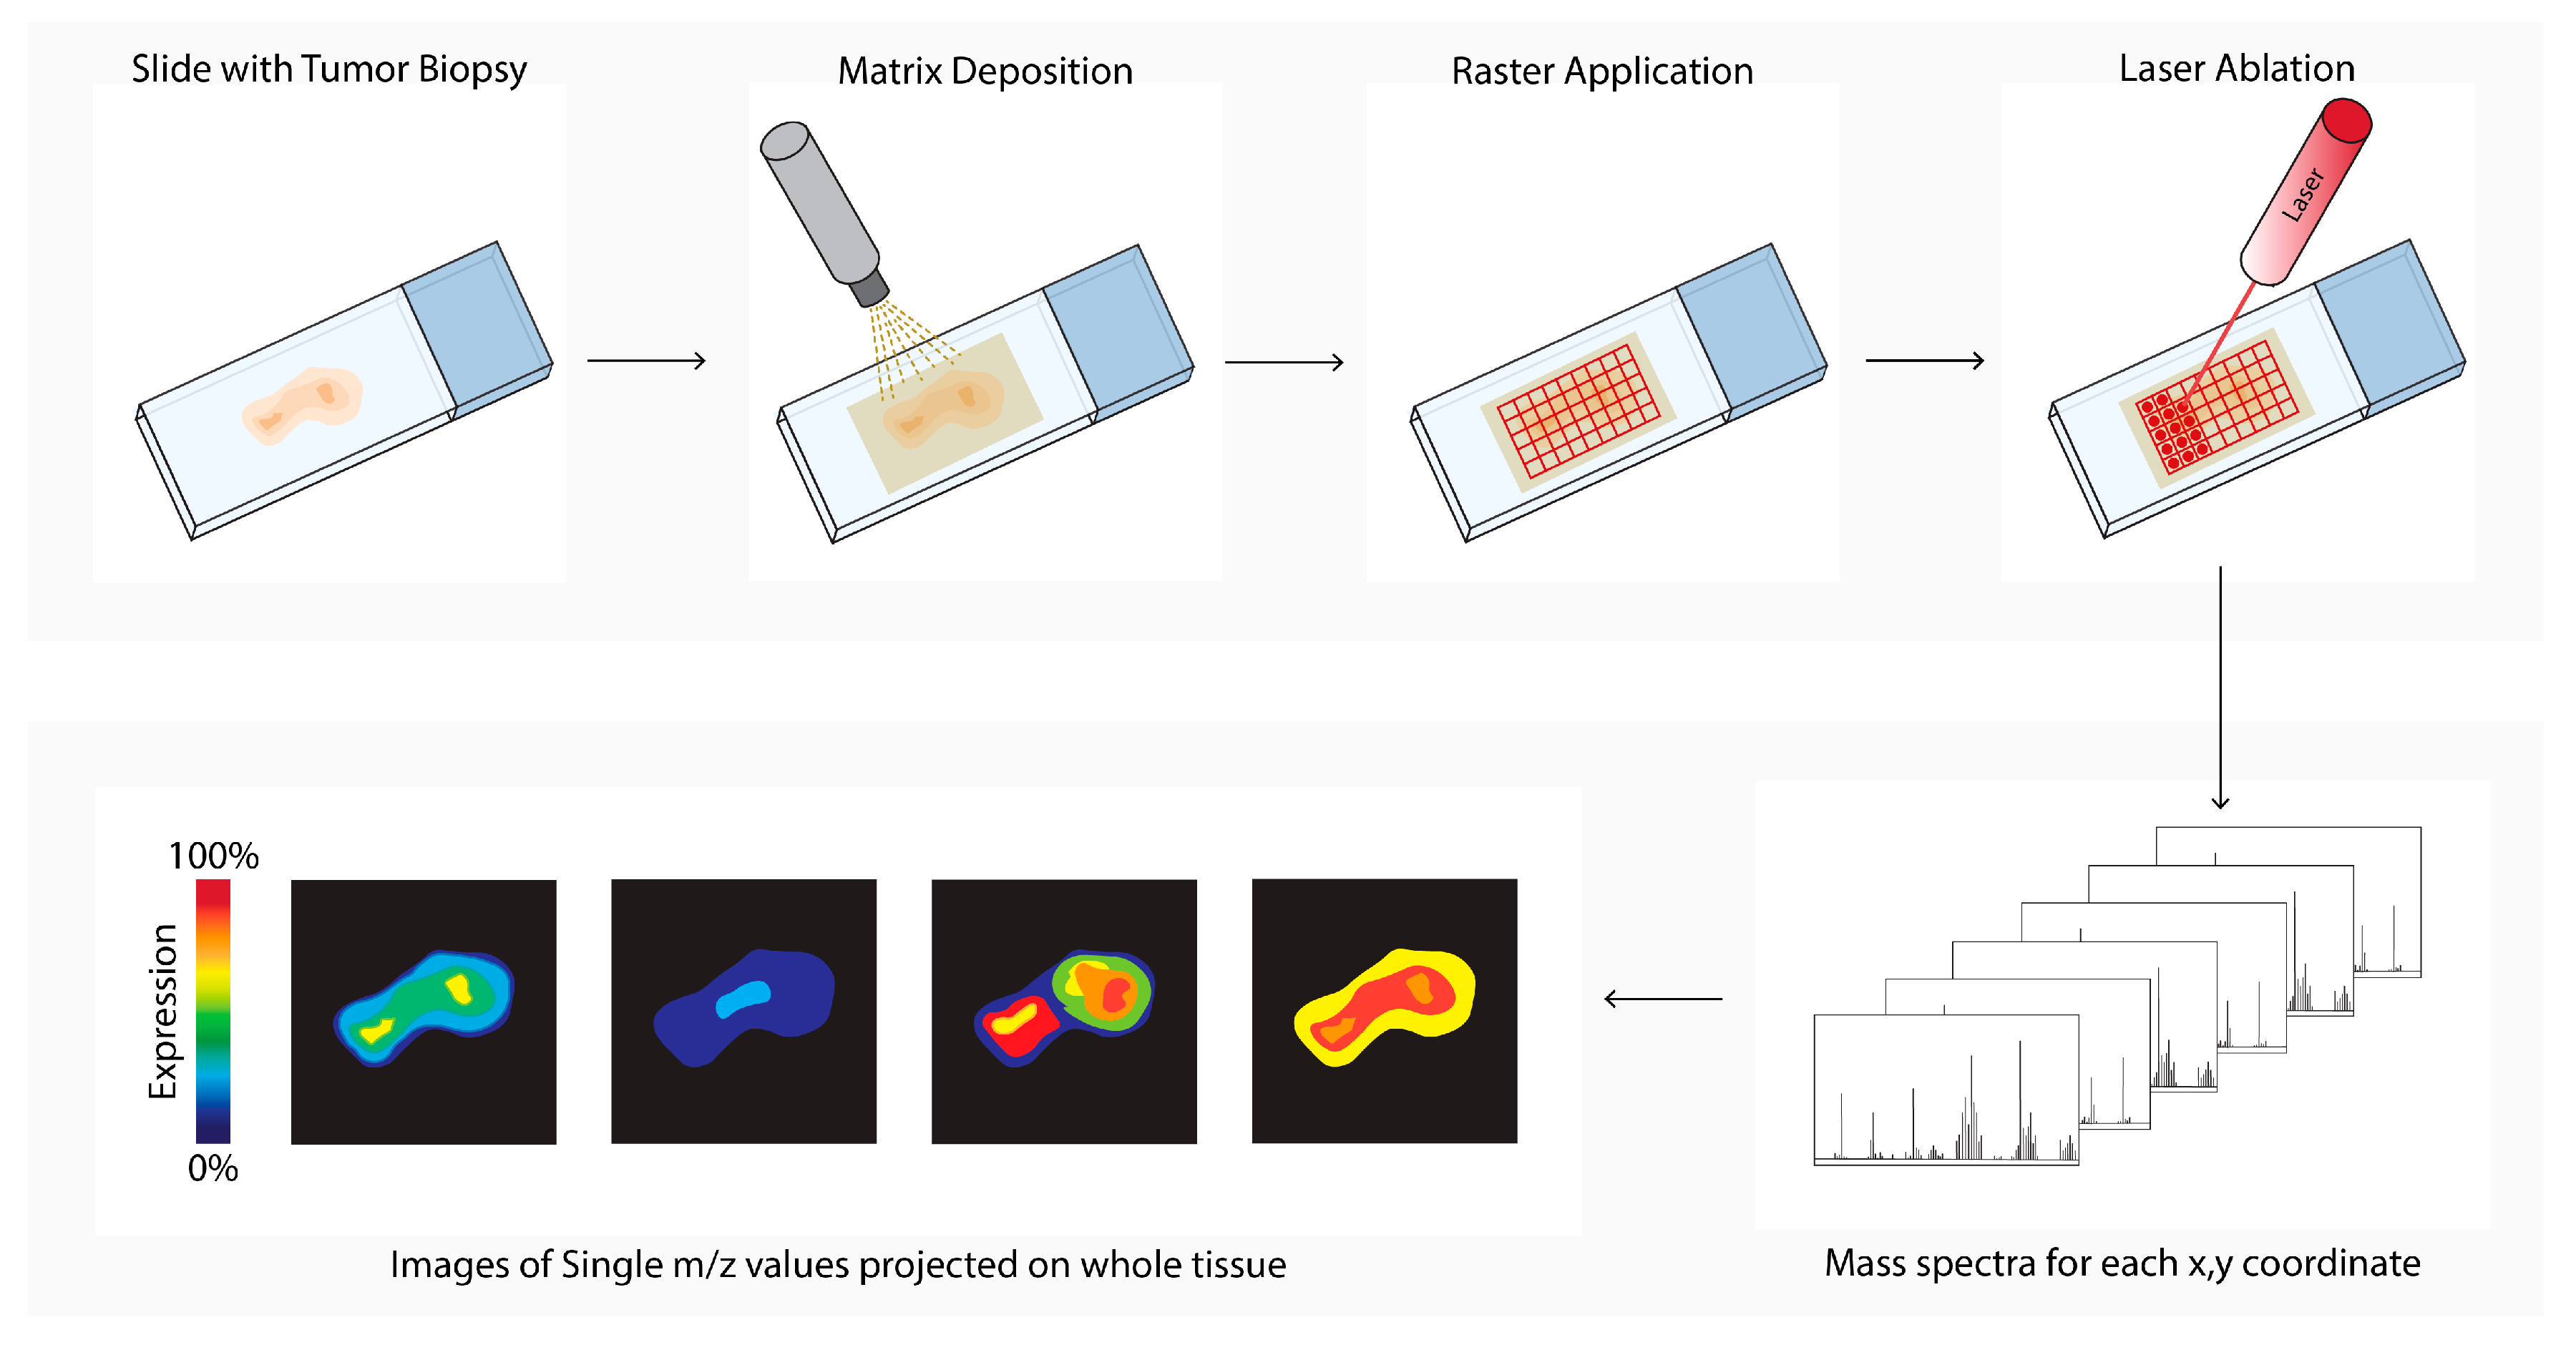
Figure 6. Matrix-assisted laser desorption ionization mass spectrometry imaging (MALDI-MSI) workflow. Tissue sections are processed, and a matrix is applied (matrix deposition). Next, a laser in the MALDI-MSI creates a 10–150 micrometer raster (Raster Application). The laser beam ionizes a spot in each raster (laser ablation), and the ionized analytes from the raster are transferred into the mass spectrometer for compound identification (mass spectra). In parallel, an image is created by combining the data of the spot location with the corresponding measured mass spectrum (images of single m/z values).
2.7. Digital Spatial Analysis
Digital spatial analysis (DSP, Figure 7) is a commercially available technique that enables RNA or protein quantification from FFPE or FF tissue by counting targets that are linked to unique indexing oligonucleotides [10]. These indexing oligonucleotides are covalently bound with a UV-photocleavable (PC) linker to a mRNA hybridization probe or to a primary antibody. Tissue slides are first hybridized with mRNA probes or stained with PC-linked primary antibodies. After this first staining, the same slide can be stained with one to four fluorescent labeled antibodies, which allows for the identification of specific tissue structures or cellular subsets of interest. The tissue slide is inserted into the DSP and an image is produced, based on the signal from the fluorescent labeled antibodies. These overview images enable the selection of a region of interest (ROI) of any shape. After the ROI is selected, the digital micromirror device illuminates the ROI, which causes the PC-linked mRNA or primary antibody to be released from the tissue. The photocleaved indexing oligonucleotides are aspirated with a microcapillary and collected in a 96-well plate. The collected photocleaved indexing oligonucleotides are analyzed either by next generation sequencing or by an nCounter system.
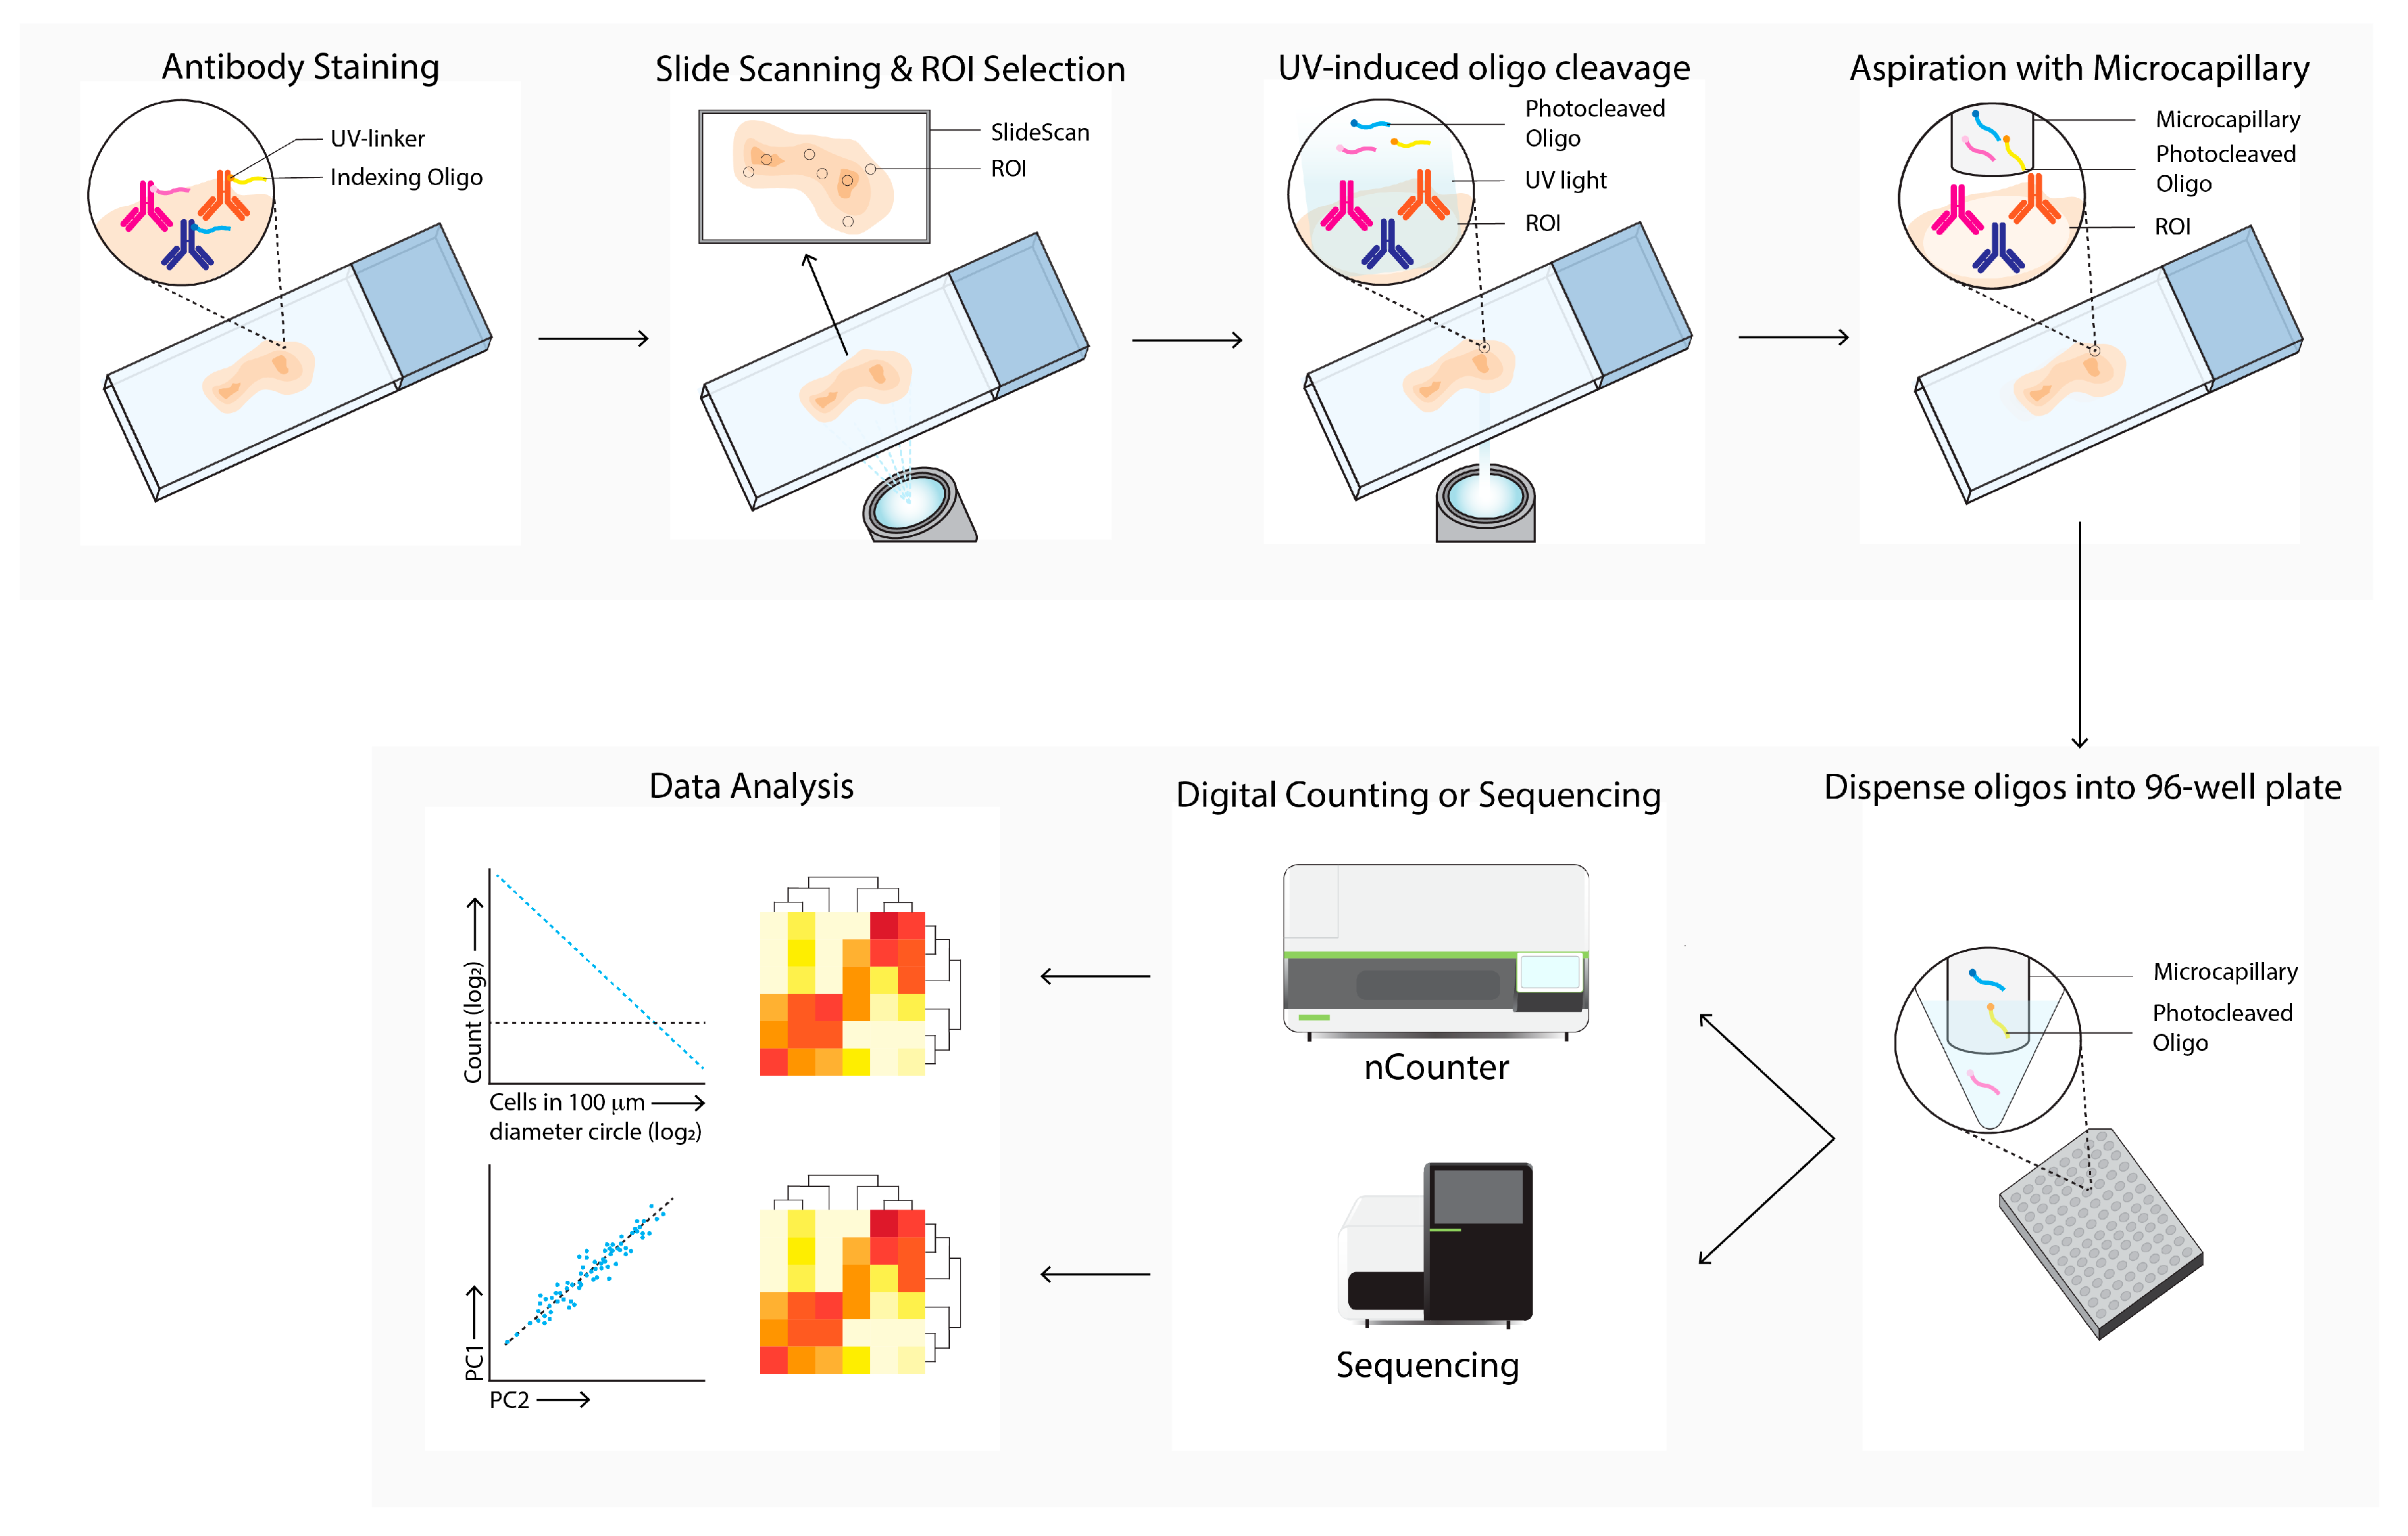
Figure 7. Digital Spatial Profiling (DSP) workflow. Tissue sections are labeled with antibodies and/or in situ hybridization with mRNA probes, which are linked with UV-cleavable oligo-tags. Slides are labeled with fluorescence-conjugated antibodies to determine cell subsets and select regions of interests and masks for bulk cell subsets for directed UV-cleavage of the oligo-tags. The cleaved oligos are collected with a microcapillary and transferred to a 96-well plate. Next, the oligos are quantified by digital counting (nCounter) or next-generation sequencing. Differential expression of specific mRNA or proteins between ROIs and cell subsets are next analyzed (data analysis).
DSP has been used in the field of cancer research to search for TME transcriptional profiling, and to identify predictive markers for prognosis, therapy response prediction, or clinical outcomes [62][63][64][65][66][67][68][69][70][71]. Furthermore, DSP has been utilized to investigate TME heterogeneity [72][73][74][75][76][77][78][79].
Immunotherapy Response Prediction
DSP has been widely used to predict immunotherapy responses or to identify prognostic markers. Three different studies have investigated which markers are related to ICPI treatment response.
The first study examined seventeen resectable stage III melanoma baseline biopsies, which were treated with adjuvant or neoadjuvant ipilimumab and nivolumab, before or after complete regional lymph node dissection [70]. Samples were analyzed with twenty-nine oligo-conjugated antibodies directed to immune-related surface antigens. Low expression of CD3, B2M, and PD-L1, and a low IFNγ signature within the tumor were correlated with relapse after adjuvant or neoadjuvant ipilimumab and nivolumab. Meanwhile, tumors with an intermediate or high IFNγ signature did not relapse.
A second study included resectable Melanoma stage III or oligometastatic stage IV tumors that were treated with neoadjuvant nivolumab monotherapy or a combination of nivolumab and ipilimumab [62]. Immunohistochemistry showed that the tumors of responding patients expressed elevated PD-L1 expression in tumor cells, increased lymphocyte marker expression (granzyme B, CD4, FoxP3, CD20, and PD-1), and elevated proportions of CD8+ TILs. Furthermore, higher expression of CD45RO, B2M, CD3, CD8, CD19, CD20, and Ki67 in the CD45+ immune cell infiltrate correlated with ICPI response. Meanwhile, the T cell receptor sequencing showed that tumors of responders had a larger T cell clone diversity than tumors of non-responders.
The third study investigated which immune cell makers were correlated with ICPI treatment outcomes. Seven samples, taken from patients with metastatic head and neck squamous cell carcinoma that had been treated with nivolumab and pembrolizumab, were analyzed with a 44-marker panel [67]. The immune cell profiling panel revealed that expression of CD4, CD45RO, CD68, IDO-1, P-ERK, Ki67, PD-L1 PD-1, Granzyme B, CD45, OX40, STAT3, P-STAT3, CD44, STING, CD66b, P-AKT, and PTEN was associated with progressive disease. Additionally, in contrast to the second study of melanoma, CD8 expression was not predictive for the ICPI treatment outcome here.
Two studies used immunofluorescent antibodies to identify specific compartments within the TME. The first study included immunotherapy-treated melanoma samples. These samples were stained with a 44-plex antibody cocktail that was mainly directed towards the immune-related surface antigens of leukocytes and macrophages [65]. Additionally, some markers to identify the tumor cells were included. These markers were used to identify three compartments: melanocytes (S100+ and HMB45+), macrophage (CD68+), and leukocyte (CD45+) compartments. Analysis of these compartments revealed that high CD8+ counts within the macrophage compartment were associated with progression-free survival, as well as immunotherapy response and prolonged overall survival. CD8+ numbers within the tumor compartment were associated with favorable outcomes, whereas CD8+ numbers in the leukocyte compartment were not. In total, eleven markers and fifteen markers were found to correlate with progression-free survival and overall survival, respectively. However, in the multivariate analysis, only PD-L1 expression in the macrophage compartment was significantly associated with progression-free survival and overall survival.
The second study included eighty-one NSCLC patients (stage III-stage IV) who were treated with either nivolumab, pembrolizumab, or atezolizumab [66]. Three different compartments within these tumors were analyzed: tumor cells (pan keratin+), immune cells (CD45+), and macrophages (CD68+). Multivariate analysis showed that high levels of CD56 and CD4 in the immune cell compartment are predictive of longer progression-free survival, prolonged overall survival, and durable benefit, while high VISTA levels and CD127 levels in the tumor compartment were predictive of non-durable benefit and shorter progression-free survival.
References
- Elaldi, R.; Hemon, P.; Petti, L.; Cosson, E.; Desrues, B.; Sudaka, A.; Poissonnet, G.; Van Obberghen-Schilling, E.; Pers, J.-O.; Braud, V.M.; et al. High Dimensional Imaging Mass Cytometry Panel to Visualize the Tumor Immune Microenvironment Contexture. Front. Immunol. 2021, 12, 666233.
- Chappell, L.; Russell, A.J.; Voet, T. Single-Cell (Multi)omics Technologies. Annu. Rev. Genom. Hum. Genet. 2018, 19, 15–41.
- Ramazzotti, D.; Lal, A.; Wang, B.; Batzoglou, S.; Sidow, A. Multiomic tumor data reveal diversity of molecular mechanisms that correlate with survival. Nat. Commun. 2018, 9, 1–14.
- Tirosh, I.; Izar, B.; Prakadan, S.M.; Wadsworth, M.H.; Treacy, D.; Trombetta, J.J.; Rotem, A.; Rodman, C.; Lian, C.; Murphy, G.; et al. Dissecting the multicellular ecosystem of metastatic melanoma by single-cell RNA-seq. Science 2016, 352, 189–196.
- Li, H.; van der Leun, A.M.; Yofe, I.; Lubling, Y.; Gelbard-Solodkin, D.; van Akkooi, A.C.; van den Braber, M.; Rozeman, E.A.; Haanen, J.B.; Blank, C.U.; et al. Dysfunctional CD8 T Cells Form a Proliferative, Dynamically Regulated Compartment within Human Melanoma. Cell 2020, 181, 747.
- Wortman, J.C.; He, T.-F.; Solomon, S.; Zhang, R.Z.; Rosario, A.; Wang, R.; Tu, T.Y.; Schmolze, D.; Yuan, Y.; Yost, S.E.; et al. Spatial distribution of B cells and lymphocyte clusters as a predictor of triple-negative breast cancer outcome. NPJ Breast Cancer 2021, 7, 1–13.
- Goltsev, Y.; Samusik, N.; Kennedy-Darling, J.; Bhate, S.; Hale, M.; Vazquez, G.; Black, S.; Nolan, G.P. Deep Profiling of Mouse Splenic Architecture with CODEX Multiplexed Imaging. Cell 2018, 174, 968–981.e15.
- Chen, K.H.; Boettiger, A.N.; Moffitt, J.R.; Wang, S.; Zhuang, X. Spatially resolved, highly multiplexed RNA profiling in single cells. Science 2015, 348, aaa6090.
- Sandberg, T.P.; Stuart, M.P.M.E.; Oosting, J.; Tollenaar, R.A.E.M.; Sier, C.F.M.; Mesker, W.E. Increased expression of cancer-associated fibroblast markers at the invasive front and its association with tumor-stroma ratio in colorectal cancer. BMC Cancer 2019, 19, 284.
- Merritt, C.R.; Ong, G.T.; Church, S.E.; Barker, K.; Danaher, P.; Geiss, G.; Hoang, M.; Jung, J.; Liang, Y.; McKay-Fleisch, J.; et al. Multiplex digital spatial profiling of proteins and RNA in fixed tissue. Nat. Biotechnol. 2020, 38, 586–599.
- Stoeckli, M.; Chaurand, P.; Hallahan, D.E.; Caprioli, R.M. Imaging mass spectrometry: A new technology for the analysis of protein expression in mammalian tissues. Nat. Med. 2001, 7, 493–496.
- Angelo, M.; Bendall, S.C.; Finck, R.; Hale, M.B.; Hitzman, C.; Borowsky, A.D.; Levenson, R.M.; Lowe, J.B.; Liu, S.D.; Zhao, S.; et al. Multiplexed ion beam imaging of human breast tumors. Nat. Med. 2014, 20, 436–442.
- Giesen, C.; Wang, H.A.O.; Schapiro, D.; Zivanovic, N.; Jacobs, A.; Hattendorf, B.; Schüffler, P.J.; Grolimund, D.; Buhmann, J.M.; Brandt, S.; et al. Highly multiplexed imaging of tumor tissues with subcellular resolution by mass cytometry. Nat. Methods 2014, 11, 417–422.
- Galon, J.; Costes, A.; Sanchez-Cabo, F.; Kirilovsky, A.; Mlecnik, B.; Lagorce-Pagès, C.; Tosolini, M.; Camus, M.; Berger, A.; Wind, P.; et al. Type, Density, and Location of Immune Cells Within Human Colorectal Tumors Predict Clinical Outcome. Science 2006, 313, 1960–1964.
- Mori, H.; Bolen, J.; Schuetter, L.; Massion, P.; Hoyt, C.C.; VandenBerg, S.; Esserman, L.; Borowsky, A.D.; Campbell, M.J. Characterizing the Tumor Immune Microenvironment with Tyramide-Based Multiplex Immunofluorescence. J. Mammary Gland. Biol. Neoplasia 2020, 25, 417–432.
- Barua, S.; Fang, P.; Sharma, A.; Fujimoto, J.; Wistuba, I.; Rao, A.U.; Lin, S.H. Spatial interaction of tumor cells and regulatory T cells correlates with survival in non-small cell lung cancer. Lung Cancer 2018, 117, 73–79.
- Najem, H.; Marisetty, A.; Horbinski, C.; Long, J.; Huse, J.T.; Oliva, I.C.G.; Ferguson, S.D.; Kumthekar, P.U.; Wainwright, D.A.; Chen, P.; et al. CD11c+CD163+ Cells and Signal Transducer and Activator of Transcription 3 (STAT3) Expression Are Common in Melanoma Leptomeningeal Disease. Front. Immunol. 2021, 12, 4209.
- Krijgsman, D.; De Vries, N.L.; Andersen, M.N.; Skovbo, A.; Tollenaar, R.A.; Møller, H.J.; Hokland, M.; Kuppen, P.J. CD163 as a Biomarker in Colorectal Cancer: The Expression on Circulating Monocytes and Tumor-Associated Macrophages, and the Soluble Form in the Blood. Int. J. Mol. Sci. 2020, 21, 5925.
- Lee, S.-W.; Lee, H.-Y.; Kang, S.W.; Kim, M.J.; Lee, Y.-J.; Sung, C.O.; Kim, Y.-M. Application of Immunoprofiling Using Multiplexed Immunofluorescence Staining Identifies the Prognosis of Patients with High-Grade Serous Ovarian Cancer. Int. J. Mol. Sci. 2021, 22, 9638.
- Damodaran, S.; Damaschke, N.; Gawdzik, J.; Yang, B.; Shi, C.; Allen, G.O.; Huang, W.; Denu, J.; Jarrard, D. Dysregulation of Sirtuin 2 (SIRT2) and histone H3K18 acetylation pathways associates with adverse prostate cancer outcomes. BMC Cancer 2017, 17, 874.
- Lubin, D.J.; Mick, R.; Shroff, S.G.; Stashek, K.; Furth, E.E. The notch pathway is activated in neoplastic progression in esophageal squamous cell carcinoma. Hum. Pathol. 2018, 72, 66–70.
- Granier, C.; Dariane, C.; Combe, P.; Verkarre, V.; Urien, S.; Badoual, C.; Roussel, H.; Mandavit, M.; Ravel, P.; Sibony, M.; et al. Tim-3 Expression on Tumor-Infiltrating PD-1+CD8+ T Cells Correlates with Poor Clinical Outcome in Renal Cell Carcinoma. Cancer Res. 2017, 77, 1075–1082.
- Ansong, E.; Ying, Q.; Ekoue, D.N.; Deaton, R.; Hall, A.R.; Kajdacsy-Balla, A.; Yang, W.; Gann, P.H.; Diamond, A.M. Evidence That Selenium Binding Protein 1 Is a Tumor Suppressor in Prostate Cancer. PLoS ONE 2015, 10, e0127295.
- De Sousa, L.G.; Rajapakshe, K.; Canales, J.R.; Chin, R.L.; Feng, L.; Wang, Q.; Barrese, T.Z.; Massarelli, E.; William, W.; Johnson, F.M.; et al. ISA101 and nivolumab for HPV-16(+) cancer: Updated clinical efficacy and immune correlates of response. J. Immunother. Cancer 2022, 10, e004232.
- Vanguri, R.; Benhamida, J.; Young, J.H.; Li, Y.; Zivanovic, O.; Chi, D.; Snyder, A.; Hollmann, T.J.; Mager, K.L. Understanding the impact of chemotherapy on the immune landscape of high-grade serous ovarian cancer. Gynecol. Oncol. Rep. 2022, 39, 100926.
- Korpela, S.P.; Hinz, T.K.; Oweida, A.; Kim, J.; Calhoun, J.; Ferris, R.; Nemenoff, R.A.; Karam, S.D.; Clambey, E.T.; Heasley, L.E. Role of epidermal growth factor receptor inhibitor-induced interferon pathway signaling in the head and neck squamous cell carcinoma therapeutic response. J. Transl. Med. 2021, 19, 1–15.
- Park, I.J.; An, S.; Kim, S.-Y.; Lim, H.M.; Hong, S.-M.; Kim, M.-J.; Kim, Y.J.; Yu, C.S. Prediction of radio-responsiveness with immune-profiling in patients with rectal cancer. Oncotarget 2017, 8, 79793–79802.
- Mishra, S.; Charan, M.; Shukla, R.K.; Agarwal, P.; Misri, S.; Verma, A.K.; Ahirwar, D.K.; Siddiqui, J.; Kaul, K.; Sahu, N.; et al. cPLA2 blockade attenuates S100A7-mediated breast tumorigenicity by inhibiting the immunosuppressive tumor microenvironment. J. Exp. Clin. Cancer Res. 2022, 41, 1–19.
- Schürch, C.M.; Bhate, S.S.; Barlow, G.L.; Phillips, D.J.; Noti, L.; Zlobec, I.; Chu, P.; Black, S.; Demeter, J.; McIlwain, D.R.; et al. Coordinated Cellular Neighborhoods Orchestrate Antitumoral Immunity at the Colorectal Cancer Invasive Front. Cell 2020, 182, 1341–1359.e19.
- Keren, L.; Bosse, M.; Marquez, D.; Angoshtari, R.; Jain, S.; Varma, S.; Yang, S.-R.; Kurian, A.; Van Valen, D.; West, R.; et al. A Structured Tumor-Immune Microenvironment in Triple Negative Breast Cancer Revealed by Multiplexed Ion Beam Imaging. Cell 2018, 174, 1373–1387.e19.
- Keren, L.; Bosse, M.; Thompson, S.; Risom, T.; Vijayaragavan, K.; McCaffrey, E.; Marquez, D.; Angoshtari, R.; Greenwald, N.F.; Fienberg, H.; et al. MIBI-TOF: A multiplexed imaging platform relates cellular phenotypes and tissue structure. Sci. Adv. 2019, 5, eaax5851.
- Ji, A.L.; Rubin, A.J.; Thrane, K.; Jiang, S.; Reynolds, D.L.; Meyers, R.M.; Guo, M.G.; George, B.M.; Mollbrink, A.; Bergenstråhle, J.; et al. Multimodal Analysis of Composition and Spatial Architecture in Human Squamous Cell Carcinoma. Cell 2020, 182, 497–514.e22.
- Risom, T.; Glass, D.R.; Averbukh, I.; Liu, C.C.; Baranski, A.; Kagel, A.; McCaffrey, E.F.; Greenwald, N.F.; Rivero-Gutiérrez, B.; Strand, S.H.; et al. Transition to invasive breast cancer is associated with progressive changes in the structure and composition of tumor stroma. Cell 2022, 185, 299–310.e18.
- Martinez-Morilla, S.; Villarroel-Espindola, F.; Wong, P.F.; Toki, M.I.; Aung, T.N.; Pelekanou, V.; Bourke-Martin, B.; Schalper, K.A.; Kluger, H.M.; Rimm, D.L. Biomarker Discovery in Patients with Immunotherapy-Treated Melanoma with Imaging Mass Cytometry. Clin. Cancer Res. 2021, 27, 1987–1996.
- Jackson, H.; Fischer, J.R.; Zanotelli, V.R.T.; Ali, H.R.; Mechera, R.; Soysal, S.D.; Moch, H.; Muenst, S.; Varga, Z.; Weber, W.P.; et al. The single-cell pathology landscape of breast cancer. Nature 2020, 578, 615–620.
- Li, R.; Lin, Y.; Wang, Y.; Wang, S.; Yang, Y.; Mu, X.; Chen, Y.; Gao, Z. Characterization of the Tumor Immune Microenvironment in Lung Squamous Cell Carcinoma Using Imaging Mass Cytometry. Front. Oncol. 2021, 11, 620989.
- Xie, S.; Zhang, X.-Y.; Shan, X.-F.; Yau, V.; Zhang, J.-Y.; Wang, W.; Yan, Y.-P.; Cai, Z.-G. Hyperion Image Analysis Depicts a Preliminary Landscape of Tumor Immune Microenvironment in OSCC with Lymph Node Metastasis. J. Immunol. Res. 2021, 2021, 9975423.
- Feng, C.; Wang, X.; Tao, Y.; Xie, Y.; Lai, Z.; Li, Z.; Hu, J.; Tang, S.; Pan, L.; He, L.; et al. Single-Cell Proteomic Analysis Dissects the Complexity of Tumor Microenvironment in Muscle Invasive Bladder Cancer. Cancers 2021, 13, 5440.
- Zheng, Y.; Han, L.; Chen, Z.; Li, Y.; Zhou, B.; Hu, R.; Chen, S.; Xiao, H.; Ma, Y.; Xie, G.; et al. PD-L1(+)CD8(+) T cells enrichment in lung cancer exerted regulatory function and tumor-promoting tolerance. iScience 2022, 25, 103785.
- Guo, Q.; Bartish, M.; Gonçalves, C.; Huang, F.; Smith-Voudouris, J.; Krisna, S.S.; Preston, S.E.; Emond, A.; Li, V.Z.; Duerr, C.U.; et al. The MNK1/2-eIF4E Axis Supports Immune Suppression and Metastasis in Postpartum Breast Cancer. Cancer Res. 2021, 81, 3876–3889.
- Bortolomeazzi, M.; Keddar, M.R.; Montorsi, L.; Acha-Sagredo, A.; Benedetti, L.; Temelkovski, D.; Choi, S.; Petrov, N.; Todd, K.; Wai, P.; et al. Immunogenomics of Colorectal Cancer Response to Checkpoint Blockade: Analysis of the KEY-NOTE 177 Trial and Validation Cohorts. Gastroenterology 2021, 161, 1179–1193.
- Malihi, P.D.; Morikado, M.; Welter, L.; Liu, S.T.; Miller, E.T.; Cadaneanu, R.M.; Knudsen, B.S.; Lewis, M.S.; Carlsson, A.; Velasco, C.R.; et al. Clonal diversity revealed by morphoproteomic and copy number profiles of single prostate cancer cells at diagnosis. Converg. Sci. Phys. Oncol. 2018, 4, 015003.
- Aoki, T.; Chong, L.C.; Takata, K.; Milne, K.; Hav, M.; Colombo, A.; Chavez, E.A.; Nissen, M.; Wang, X.; Miyata-Takata, T.; et al. Single-Cell Transcriptome Analysis Reveals Disease-Defining T-cell Subsets in the Tumor Microenvironment of Classic Hodgkin Lymphoma. Cancer Discov. 2020, 10, 406–421.
- Zhang, T.; Lv, J.; Tan, Z.; Wang, B.; Warden, A.; Li, Y.; Jiang, H.; Li, H.; Ding, X. Immunocyte Profiling Using Single-Cell Mass Cytometry Reveals EpCAM+ CD4+ T Cells Abnormal in Colon Cancer. Front. Immunol. 2019, 10, 1571.
- Liu, H.-C.; Viswanath, D.I.; Pesaresi, F.; Xu, Y.; Zhang, L.; Di Trani, N.; Paez-Mayorga, J.; Hernandez, N.; Wang, Y.; Erm, D.R.; et al. Potentiating Antitumor Efficacy Through Radiation and Sustained Intratumoral Delivery of Anti-CD40 and Anti-PDL1. Int. J. Radiat. Oncol. 2020, 110, 492–506.
- Danenberg, E.; Bardwell, H.; Zanotelli, V.R.T.; Provenzano, E.; Chin, S.-F.; Rueda, O.M.; Green, A.; Rakha, E.; Aparicio, S.; Ellis, I.O.; et al. Breast tumor microenvironment structures are associated with genomic features and clinical outcome. Nat. Genet. 2022, 54, 660–669.
- Strittmatter, N.; Richards, F.M.; Race, A.M.; Ling, S.; Sutton, D.; Nilsson, A.; Wallez, Y.; Barnes, J.; Maglennon, G.; Gopinathan, A.; et al. Method to Visualize the Intratumor Distribution and Impact of Gemcitabine in Pancreatic Ductal Adenocarcinoma by Multimodal Imaging. Anal. Chem. 2022, 94, 1795–1803.
- Carvajal-Hausdorf, D.E.; Patsenker, J.; Stanton, K.P.; Villarroel-Espindola, F.; Esch, A.; Montgomery, R.R.; Psyrri, A.; Kalogeras, K.T.; Kotoula, V.; Foutzilas, G.; et al. Multiplexed (18-Plex) Measurement of Signaling Targets and Cytotoxic T Cells in Trastuzumab-Treated Patients using Imaging Mass Cytometry. Clin. Cancer Res. 2019, 25, 3054–3062.
- Yang, Y.; Tian, W.; Su, L.; Li, P.; Gong, X.; Shi, L.; Zhang, Q.; Zhao, B.; Zhao, H. Tumor-Infiltrating Cytotoxic T Cells and Tumor-Associated Macrophages Correlate With the Outcomes of Neoadjuvant Chemoradiotherapy for Locally Advanced Rectal Cancer. Front. Oncol. 2021, 11, 743540.
- Kankeu Fonkoua, L.A.; Chakrabarti, S.; Sonbol, M.B.; Kasi, P.M.; Starr, J.S.; Liu, A.J.; Nevala, W.K.; Maus, R.L.; Bois, M.C.; Pitot, H.C.; et al. Outcomes on anti-VEGFR-2/paclitaxel treatment after progression on immune checkpoint inhibition in patients with metastatic gastroesophageal adenocarcinoma. Int. J. Cancer 2021, 149, 378–386.
- Umemoto, K.; Togashi, Y.; Arai, Y.; Nakamura, H.; Takahashi, S.; Tanegashima, T.; Kato, M.; Nishikawa, T.; Sugiyama, D.; Kojima, M.; et al. The potential application of PD-1 blockade therapy for early-stage biliary tract cancer. Int. Immunol. 2019, 32, 273–281.
- van Maldegem, F.; Valand, K.; Cole, M.; Patel, H.; Angelova, M.; Rana, S.; Colliver, E.; Enfield, K.; Bah, N.; Kelly, G.; et al. Characterisation of tumour microenvironment remodelling following oncogene inhibition in pre-clinical studies with imaging mass cytometry. Nat. Commun. 2021, 12, 5906.
- Aichler, M.; Walch, A. MALDI Imaging mass spectrometry: Current frontiers and perspectives in pathology research and practice. Lab. Investig. 2015, 95, 422–431.
- Rauser, S.; Marquardt, C.; Balluff, B.; Deininger, S.-O.; Albers, C.; Belau, E.; Hartmer, R.; Suckau, D.; Specht, K.; Ebert, M.P.; et al. Classification of HER2 Receptor Status in Breast Cancer Tissues by MALDI Imaging Mass Spectrometry. J. Proteome Res. 2010, 9, 1854–1863.
- Angel, P.M.; Bruner, E.; Bethard, J.; Clift, C.L.; Ball, L.; Drake, R.R.; Feghali-Bostwick, C. Extracellular matrix alterations in low-grade lung adenocarcinoma compared with normal lung tissue by imaging mass spectrometry. Biol. Mass Spectrom. 2019, 55, e4450.
- Neumann, J.M.; Freitag, H.; Hartmann, J.S.; Niehaus, K.; Galanis, M.; Griesshammer, M.; Kellner, U.; Bednarz, H. Subtyping non-small cell lung cancer by histology-guided spatial metabolomics. J. Cancer Res. Clin. Oncol. 2021, 148, 351–360.
- Berghmans, E.; Van Raemdonck, G.; Schildermans, K.; Willems, H.; Boonen, K.; Maes, E.; Mertens, I.; Pauwels, P.; Baggerman, G. MALDI Mass Spectrometry Imaging Linked with Top-Down Proteomics as a Tool to Study the Non-Small-Cell Lung Cancer Tumor Microenvironment. Methods Protoc. 2019, 2, 44.
- Berghmans, E.; Jacobs, J.; Deben, C.; Hermans, C.; Broeckx, G.; Smits, E.; Maes, E.; Raskin, J.; Pauwels, P.; Baggerman, G. Mass Spectrometry Imaging Reveals Neutrophil Defensins as Additional Biomarkers for Anti-PD-(L)1 Immunotherapy Response in NSCLC Patients. Cancers 2020, 12, 863.
- Phillips, L.; Gill, A.J.; Baxter, R.C. Novel Prognostic Markers in Triple-Negative Breast Cancer Discovered by MALDI-Mass Spectrometry Imaging. Front. Oncol. 2019, 9, 379.
- Boyaval, F.; Van Zeijl, R.; Dalebout, H.; Holst, S.; van Pelt, G.; Fariña-Sarasqueta, A.; Mesker, W.; Tollenaar, R.; Morreau, H.; Wuhrer, M.; et al. N-Glycomic Signature of Stage II Colorectal Cancer and Its Association with the Tumor Microenvironment. Mol. Cell Proteom. 2021, 20, 100057.
- Everest-Dass, A.V.; Briggs, M.T.; Kaur, G.; Oehler, M.K.; Hoffmann, P.; Packer, N.H. N-glycan MALDI Imaging Mass Spectrometry on Formalin-Fixed Paraffin-Embedded Tissue Enables the Delineation of Ovarian Cancer Tissues. Mol. Cell Proteom. 2016, 15, 3003–3016.
- Amaria, R.N.; Reddy, S.; Tawbi, H.A.; Davies, M.A.; Ross, M.I.; Glitza, I.C.; Cormier, J.N.; Lewis, C.; Hwu, W.-J.; Hanna, E.; et al. Neoadjuvant immune checkpoint blockade in high-risk resectable melanoma. Nat. Med. 2018, 24, 1649–1654.
- Vadakekolathu, J.; Minden, M.D.; Hood, T.; Church, S.E.; Reeder, S.; Altmann, H.; Sullivan, A.H.; Viboch, E.J.; Patel, T.; Ibrahimova, N.; et al. Immune landscapes predict chemotherapy resistance and immunotherapy response in acute myeloid leukemia. Sci. Transl. Med. 2020, 12, eaaz0463.
- Stewart, R.L.; Matynia, A.P.; Factor, R.E.; Varley, K.E. Spatially-resolved quantification of proteins in triple negative breast cancers reveals differences in the immune microenvironment associated with prognosis. Sci. Rep. 2020, 10, 1–8.
- Toki, M.I.; Merritt, C.R.; Wong, P.F.; Smithy, J.W.; Kluger, H.M.; Syrigos, K.N.; Ong, G.T.; Warren, S.E.; Beechem, J.M.; Rimm, D.L. High-Plex Predictive Marker Discovery for Melanoma Immunotherapy-Treated Patients Using Digital Spatial Profiling. Clin. Cancer Res. 2019, 25, 5503–5512.
- Zugazagoitia, J.; Gupta, S.; Liu, Y.; Fuhrman, K.; Gettinger, S.; Herbst, R.S.; Schalper, K.A.; Rimm, D.L. Biomarkers Associated with Beneficial PD-1 Checkpoint Blockade in Non–Small Cell Lung Cancer (NSCLC) Identified Using High-Plex Digital Spatial Profiling. Clin. Cancer Res. 2020, 26, 4360–4368.
- Kulasinghe, A.; Taheri, T.; O’Byrne, K.; Hughes, B.G.M.; Kenny, L.; Punyadeera, C. Highly Multiplexed Digital Spatial Profiling of the Tumor Microenvironment of Head and Neck Squamous Cell Carcinoma Patients. Front. Oncol. 2021, 10, 607349.
- Monkman, J.; Taheri, T.; Warkiani, M.E.; O’Leary, C.; Ladwa, R.; Richard, D.; O’Byrne, K.; Kulasinghe, A. High-Plex and High-throughput Digital Spatial Profiling of Non-Small-Cell Lung Cancer (NSCLC). Cancers 2020, 12, 3551.
- Keane, C.; Law, S.C.; Gould, C.; Birch, S.; Sabdia, M.B.; de Long, L.M.; Thillaiyampalam, G.; Abro, E.; Tobin, J.W.; Tan, X.; et al. LAG3, a novel immune checkpoint expressed by multiple lymphocyte subsets in diffuse large B-cell lymphoma. Blood Adv. 2020, 4, 1367–1377.
- Blank, C.U.; Rozeman, E.A.; Fanchi, L.F.; Sikorska, K.; Van De Wiel, B.; Kvistborg, P.; Krijgsman, O.; Braber, M.V.D.; Philips, D.; Broeks, A.; et al. Neoadjuvant versus adjuvant ipilimumab plus nivolumab in macroscopic stage III melanoma. Nat. Med. 2018, 24, 1655–1661.
- Koldej, R.M.; Prabahran, A.; Tan, C.W.; Ng, A.P.; Davis, M.J.; Ritchie, D.S. Dissection of the bone marrow microenvironment in hairy cell leukaemia identifies prognostic tumour and immune related biomarkers. Sci. Rep. 2021, 11, 1–10.
- Barber, H.; Lander, B.; Daniels, A.; Tofias, A.; Gong, J.; Ren, Y.; Ren, X.; Liang, Y.; White, P.; Kurian, K.M. Advanced Molecular Characterization Using Digital Spatial Profiling Technology on Immunooncology Targets in Methylated Compared with Unmethylated IDH-Wildtype Glioblastoma. J. Oncol. 2021, 2021, 8819702.
- Ihle, C.; Provera, M.D.; Straign, D.M.; Smith, E.E.; Edgerton, S.M.; Van Bokhoven, A.; Lucia, M.S.; Owens, P. Distinct tumor microenvironments of lytic and blastic bone metastases in prostate cancer patients. J. Immunother. Cancer 2019, 7, 1–9.
- Cabrita, R.; Lauss, M.; Sanna, A.; Donia, M.; Larsen, M.S.; Mitra, S.; Johansson, I.; Phung, B.; Harbst, K.; Vallon-Christersson, J.; et al. Tertiary lymphoid structures improve immunotherapy and survival in melanoma. Nature 2020, 577, 561–565.
- Roper, N.; Velez, M.J.; Chiappori, A.; Kim, Y.S.; Wei, J.S.; Sindiri, S.; Takahashi, N.; Mulford, D.; Kumar, S.; Ylaya, K.; et al. Notch signaling and efficacy of PD-1/PD-L1 blockade in relapsed small cell lung cancer. Nat. Commun. 2021, 12, 3880.
- Walens, A.; Olsson, L.T.; Gao, X.; Hamilton, A.M.; Kirk, E.L.; Cohen, S.M.; Midkiff, B.R.; Xia, Y.; Sherman, M.E.; Nikolaishvili-Feinberg, N.; et al. Protein-based immune profiles of basal-like vs. luminal breast cancers. Lab. Investig. 2021, 101, 785–793.
- Busse, A.; Mochmann, L.H.; Spenke, C.; Arsenic, R.; Briest, F.; Jöhrens, K.; Lammert, H.; Sipos, B.; Kühl, A.A.; Wirtz, R.; et al. Immunoprofiling in Neuroendocrine Neoplasms Unveil Immunosuppressive Microenvironment. Cancers 2020, 12, 3448.
- Brady, L.; Kriner, M.; Coleman, I.; Morrissey, C.; Roudier, M.; True, L.D.; Gulati, R.; Plymate, S.R.; Zhou, Z.; Birditt, B.; et al. Inter- and intra-tumor heterogeneity of metastatic prostate cancer determined by digital spatial gene ex-pression profiling. Nat. Commun. 2021, 12, 1426.
- Wang, N.; Wang, R.; Li, X.; Song, Z.; Xia, L.; Wang, J.; Zhang, L.; Wu, A.; Ding, Z. Tumor Microenvironment Profiles Reveal Distinct Therapy-Oriented Proteogenomic Characteristics in Colorectal Cancer. Front. Bioeng. Biotechnol. 2021, 9, 757378.
More