There is increasing focus on the difficult challenge of realizing coordinated development of production, living and ecological spaces within the regional development process. An ecological–production–living space (EPLSs)evaluation index system was established in this study based on the concept of EPLSs and the relationship between land use function, land use type and the national standard of land use classification, to reveal the driving forces and patterns of variation in EPLSs in Inner Mongolia.
- ecological space, production space, living space
- ,land use
- ,driving force
1. Characteristics of EPLS in Inner Mongolia from 1990 to 2015
Figure 1 There has been a gradual increase in tenshiows the sn between people and land as spatial distribution of ecological, living andstructure has become increasingly unbalanced, production spaces of Inner Mongolia for six different periods from 1990 to 2015. Grassla has become inefficient and living spaces and the ecological environment have gradually deteriorated. Land is the dominant land usbasis of human civilization, and at a macro scale, there are three general categories of residential space typ[1]. Since havin Inner Mongolia due to the prevailing climate, topography and other natural conditiong undergone reform and joining the global community, China has achieved widely recognized industrialization and urbanization achievements. However, this progress has also resulted in a series of sustainable development challenges. The proporre have been increasing conflicts and contradictions ofbetween production, living and ecological and living spaces in Inner Mongolia in 2015 were approximately 10.18%, 88.79% and 1.03%, respectively and. The 18th National Congress of the Communist Party of China proposed the concept of construction of three categories of living spaces, namely ecological space was the priority. The, production and living spaces (EPLSs), defined as ecological space of Inner Mongolia is mainly distributed in the grassland and hilly areasthat is left unspoiled, space reserved for intensive and efficient production, and living space that is sufficient in size and conducive to human well-being, respectively.
to the north The concept of the Greater Hinggan–Yinshan–Helan mountains, with a spatial distribution rose three categories of living spaces has become increasingly prevalent in related academic research and practice since being proposed (Figure 1). Althoughly inverse to that of living and production spaces. The production space of Inner Mongolia is mainly distributhis concept is rarely used internationally, there have been related studies on regional or urban functional space, including the Linear City Theory proposed by Arturo Soria, a Spanish engineer and urban planner [2][3], thed to the south of the Greater Hingg Garden City Theory proposed by Ebenezer Howard in the United Kingdom [4] an–Yinsd than–Helan mountains, with that of the Hulunbeier Caoyuan and Alxa Desert aree Organic Decentralization Theory proposed by Eliel Saarinen, a Finnish–American architect [5]. Global being relatively small and basically consistent witurban development began to face new challenges after the mid-20th century, during which the boundary zone of animal husbandrconstruction of large cities expanded significantly and agriculture in Inner Mongolia. The main reason for the relatively small production space in Inner Mongolia is due to its location to the north of the three mountains in an area in which soil, precipitation and temperature conditions are not suitable for large-scale production activities. The living spaces of the Hubaoe urban agglomeration in the central parturban problems have become more prominent. Consequently, there has been increasing research on urban growth borders, regulation of green belts and other related fields. At the same time, there has been an increasing focus on ecological and environmental problems encountered during the process of urban development and the realization that protection of the Inner Mongolia, Chifeng and Tongliao areas in the east are relatively concentratedecological environmental plays an important role in urban construction and development.
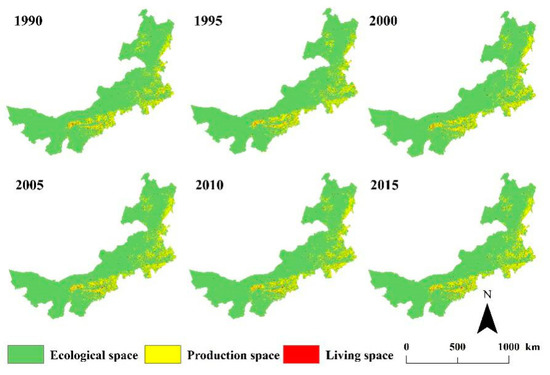
Figure 1. Spatial distributions of production, living and ecological spaces in Inner Mongolia from 1990 to 2015.
2. Spatial Patterns of EPLS in Inner Mongolia from 1990 to 2015
2.1. Changes to Spatial Extent of EPLS
In Figure 2 shosummary, ws the changes in coverage of production, living and ecological spaces in Inner Mongolia from 1990 to 2015. It is evident that there was a dramatic decline in ecologicile studies on urban functional spaces and multifunctional land use outside of China have rarely used the three living spaces categorization to define regional or urban functional spaces in Inner Mongolia from 103.14 × 10⁴ km2 , these studies have many similarin 1990 to 101.74 × 10⁴ km2 ies winth 2015, declining by 1.36% over the study period, whereasstudies in China that have utilized the three living and production spaces categorization. Studies on living spaces increased by 12.27% and 12.59% over the study period, respectively.
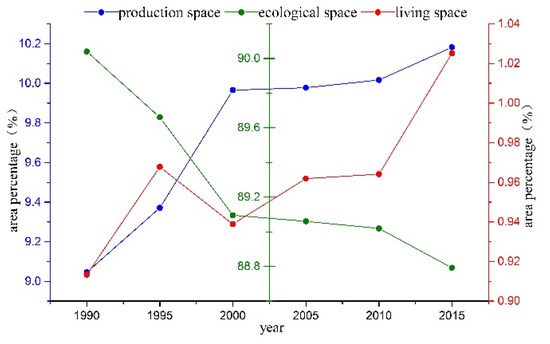
Figure 2. Percentage changes to the areas of production, living and ecological spaces in Inner Mongolia from 1990 to 2015.
China started relatively late compared to international studies, and Figure 3 swithowsin the spatial changes in EPLS for the 12 leagues of Inner Mongolia over the period 1990 to 2015, in which there are obvious regional differences. Amocontext of a planned economy, there was an excessive emphasis in China on production space, whereas other spatial functions in the region were largely ignored. Subsequent to China rejoining the 12 league cities in Inner Mongolia, only Ulanqab and Bayannur showed global community, reform of the economic system resulted in increases to the extent ofing attention on ecological space, whereas decreasing trends were evident ifunctions. Thus, relevant studies based on the remainder. Among them, the citcognition of three categories of Chifeng and Hulunbeier showed the largest declines, reaching 6636 and 6436 km2,living spaces have become popular within geography. Chinese scholars have since conducted a lot of respectively. Hohhot, Ordos and Ulanqab showed the greatest increases inarch related to ecological, production and living spaces (EPLSs), and have achieved considerable research insights.
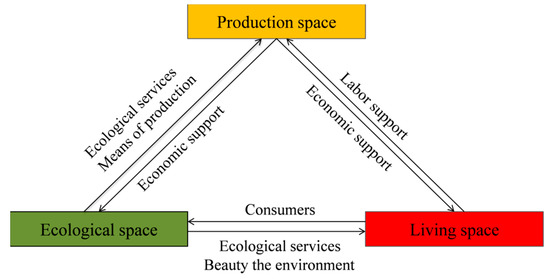
Figure 1. Conceptual diagram representing the relationships between ecological, production and living spaces (EPLSs).
Recological space at 672, 531 and 474 km2,search on EPLS has mainly focused on two reaspectively, whereass. The first is research on the city of Wuhai had the smallest onnotation and definition of EPLS. Although the increase at 96 km2. Pring fodcuction space in Bayannur and Ulanqab decreased by 400 and 383 km2 s on land use/land cover change (LUCC) respectively, whereas increases were evident in the city of Hulunbeier, the league of Hinggan and the cities of Tongliao and Chifeng of 3297, 2247, 2766 and 3297 km2,arch has resulted in varying interpretations of EPLS among different scholars, they have all proposed theoretical frameworks based on the spatial structure and the function of land use. While therespectively. In general, living spaces in the central and western regions increased, ecological spaces decr has been a large amount of empirical research, there remains no unified definition and classification standard for EPLS [6]. Thea sed and production spaces incond aspect of EPLS research relates to the eastern region increased.
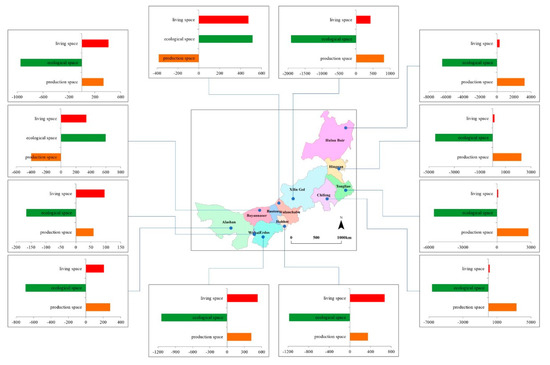
Figure 3. Spatial changes to ecological, production and living spaces (EPLSs) in Inner Mongolia from 1990 to 2015. The unit in the bar charts is km2.
2.2. Shifts in the Spatial Center of Gravity of EPLS in Inner Mongolia
volution and drivers of The center-of-gravity transfer trajectoryEPLS. While there have been many studies on the spatial patterns of EPLS in Inner Mongolia from 1990 to 2015 was calculated using the center transfer formula, the majority of these studied the evolution and drivers of EPLS vertically, with the results shown iinsufficient attention Figure 4. It ifocus evident that the center of gravity of EPLS in Inner Mongolia changed from 1990 to 2015. The center of d on the core elements during the EPLS development process. There is clearly a need for research to characterize the evolution and drivers of EPLSs [7].
Ecological, pravity ofoduction and living space showed the greatest migration, whereas that of ps are not isolated and are clearly closely related and influence each other. Production space showed the smallest. The trajectory of the center of gravity ofis a fundamental driving force which provides economic support for living and ecological space in Inner Mongolia showed an “S” shape from 1990 to 2015, and the center of gravitys. Efficient use of production space optimizes industrial structure, promotes social and economic development and ultimately facilitates quality of life and the maintenance of ecological space moved 104.228 km to the southwest,for humans as well as for other organisms [8][9][10]. witTh the migration not obvious from 1990 to 2010, but accelerating subsequently. Over the same period, the center of gravity of productione ultimate goal of coordinated and optimized development of EPLSs is to maintain the well-being of residents, and the realization of this goal is mainly reflected in living space in Inner Mongolia moved 52.932 km to the northeast, whereas tha. Ecological space is the foundation of EPLS, and the support of living space moved 190.509 km to the southwest.
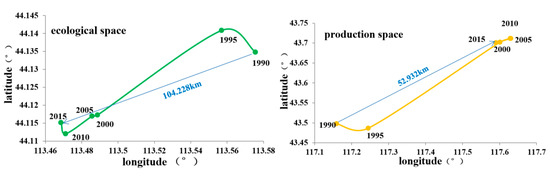
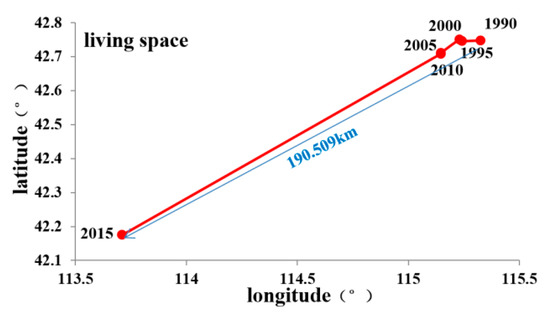
Figure 4. Migrations of production, living and ecological space in Inner Mongolia from 1990 to 2015 as calculated using the Barycenter migration model. Blue arrows indicate the moving distances.
2.3. Characteristics of Mutual Transformation of EPLS in Inner Mongolia
and production space for the realization of their own functions is the key Figure 5 shtows that the interactioncoordinating the relationship between ecological space and production space was the most obvious, with a clear, consistent relationship betwehuman development and land, and even to realizing regional sustainable development [11]. Then ecological space and production space, which was concentrated in the cities of Hulunbuir and Chifeng, indicating poor stabiprovides ecosystem goods and services, for example, natural water purification, and ensures stable development of the region. At the same time, the quality of ethe ecological and space is directly affected by living spaces in this region. In general, changand production spaces to[12].
EPLS in Inner Mongolia from 1990 to 2015 were mainly concentrated in the area south of the Xingan Ling–Yinshan–Helan mountains, where the main production mode was agriculture. In other words, the relative stability of thes a paradigm under which people can protect and utilize nature to realize their own development and reflects the ability of humans to transform nature and their own development level. The division of space within EPLS area was consistent with that of areas in which animal husbandry is practiced. There were obvious impacts of agricultural-based production methods on changes to EPLS.
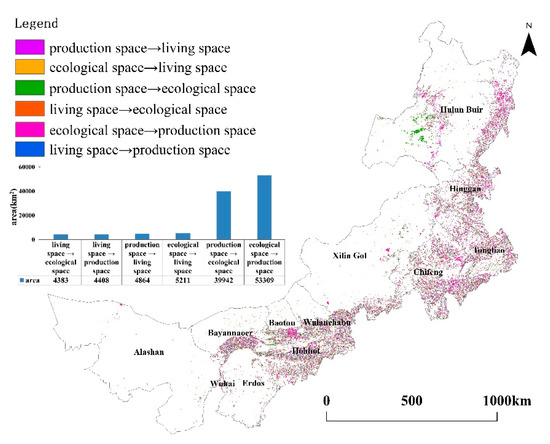
Figure 5. Transformation in ecological, production and living spaces (EPLSs) in Inner Mongolia from 1990 to 2015.
is intuitive and easy to identify. The identification and description of the internal drivers of spatial development is of great significance. An imbalance within EPLS is an important driver of environmental pollution, frequent disasters, over exploitation of energy resources and degradation of ecosystem functions. The bottom-up implementation of a Several features were noted withspatial development strategy is needed to maintain the spatial patternscoordinated development of EPLS in Inner Mongolia. The changes in EPLS indicate that there have been rapid increases in produ, with measures adjusted for local conditions and based on science and the coordination of the contradiction between protection and ldevelopment.
EPLS ivn Ching spaces, whereas ea currently faces many challenges. The ecological spaces hav has undergone continuously decreased. Within structural EPLS change, livingal erosion, resulting in an imbalance between ecological and urban spaces have always been focused within towns, with a strong path dependence characteristic, whereas production spaces are mainly distributed bordering. The extensive use and poor management of production space has resulted in serious environmental pollution. There is currently an imbalance in the supply structure of living spaces, and even appear to be an expansion of the “enclave”-type space in which living and producdevelopment remains insufficient and unbalanced. The current study focused on the Inner Mongolia Autonomous Region that is characterized by a fragile and sensitive ecological environment. A classification spaces are nested and distributed within an ecological space, withystem was established for EPLS in Inner Mongolia based on land use data for 1990 to 2015. Spatiotemporal variations in EPLS were analyzed and driving forces of the ecological space constantly fragmented by living and production spaces, and the degree of fragmentation becoming increasingly severevolution of EPLS were identified. It is hoped that the results of the present study can provide a reference for rational utilization of land and coordinated development of EPLSs to facilitate sustainable development within Inner Mongolia.
References
- Shi, Z.Q.; Deng, W.; Zhang, S.Y. Spatial pattern and spatio-temporal change of territory space in Hengduan Mountains region in recent 25 years. Geogr. Res. 2018, 37, 607–621.
- Huang, J.C.; Lin, H.X.; Qi, X.X. A literature review on optimization of spatial development pattern based on ecological-production-living space. Prog. Geogr. 2017, 36, 378–391.
- Collins, G.R. Linear planning throughout the world. J. Soc. Archit. Historians 1959, 18, 74–93.
- Howard, G. Civitas by Design Building Better Bommunities, from the Garden City to the New Urbanism; The Penguin Press: London, UK, 2010.
- Zhu, N.; Ren, Y.Y. Western architectural context and rational thinking. Archit. Cult. 2016, 10, 112–113.
- Li, G.D.; Fang, C.L. Quantitative function identification and analysis of urban ecological-production-living spaces. Acta Geogr. Sin. 2016, 71, 49–65.
- Zhang, H.Q.; Xu, E.Q.; Zhu, H.Y. An ecological-living-industrial land classification system and its spatial distribution in China. Resour. Sci. 2015, 37, 1332–1338.
- Smeraldo, S.; Bosso, L.; Fraissinet, M.; Bordignon, L.; Brunelli, M.; Ancillotto, L.; Russo, D. Modelling risks posed by wind turbines and power lines to soaring birds: The black stork (Ciconia nigra) in Italy as a case study. Biodivers. Conserv. 2020, 29, 1959–1976.
- Alkishe, A.; Cobos, M.E.; Peterson, A.T.; Samy, A. Recognizing sources of uncertainty in disease vector ecological niche models: An example with the tick Rhipicephalus sanguineus sensu lato. Perspect. Ecol. Conserv. 2020, 18, 91–102, doi:10.1016/j.pecon.2020.03.002.
- Johnson, E.; Escobar, L.E.; Zambrana-Torrelio, C. An Ecological Framework for Modeling the Geography of Disease Transmission. Trends Ecol. Evol. 2019, 34, 655–668, doi:10.1016/j.tree.2019.03.004.
- Kates, R.W.; Clark, W.C.; Corell, R. Sustainability science. Science 2001, 292, 641–642.
- Zhu, Y.Y.; Yu, B.; Zeng, J.X.; Han, Y. Spatial optimization from three spaces of production, living and ecology in national restricted zones–a case study of Wufeng county in Hubei province. Econ. Geogr. 2015, 35, 26–32.