Kinetic productivity analysis is critical to the characterization of enzyme catalytic performance and capacity. Enzymatic productivity is a measure of product formation or substrate disappearance over time, at a prescribed temperature under specified reaction conditions. It is the only measure which reliably summarizes the durability and reaction yield (a measure of the conversion of substrate) of an enzymatic process. Kinetic productivity analysis can be employed to assess the catalytic capacity of genetically and chemically modified variants, whole cells, the effect of immobilization carriers on productivity, difference between isoforms isolated from a range of organisms or tissues, and the effect of reaction solution additives.
- industrial biotechnology
- enzyme
- productivity
- stability
- kinetics
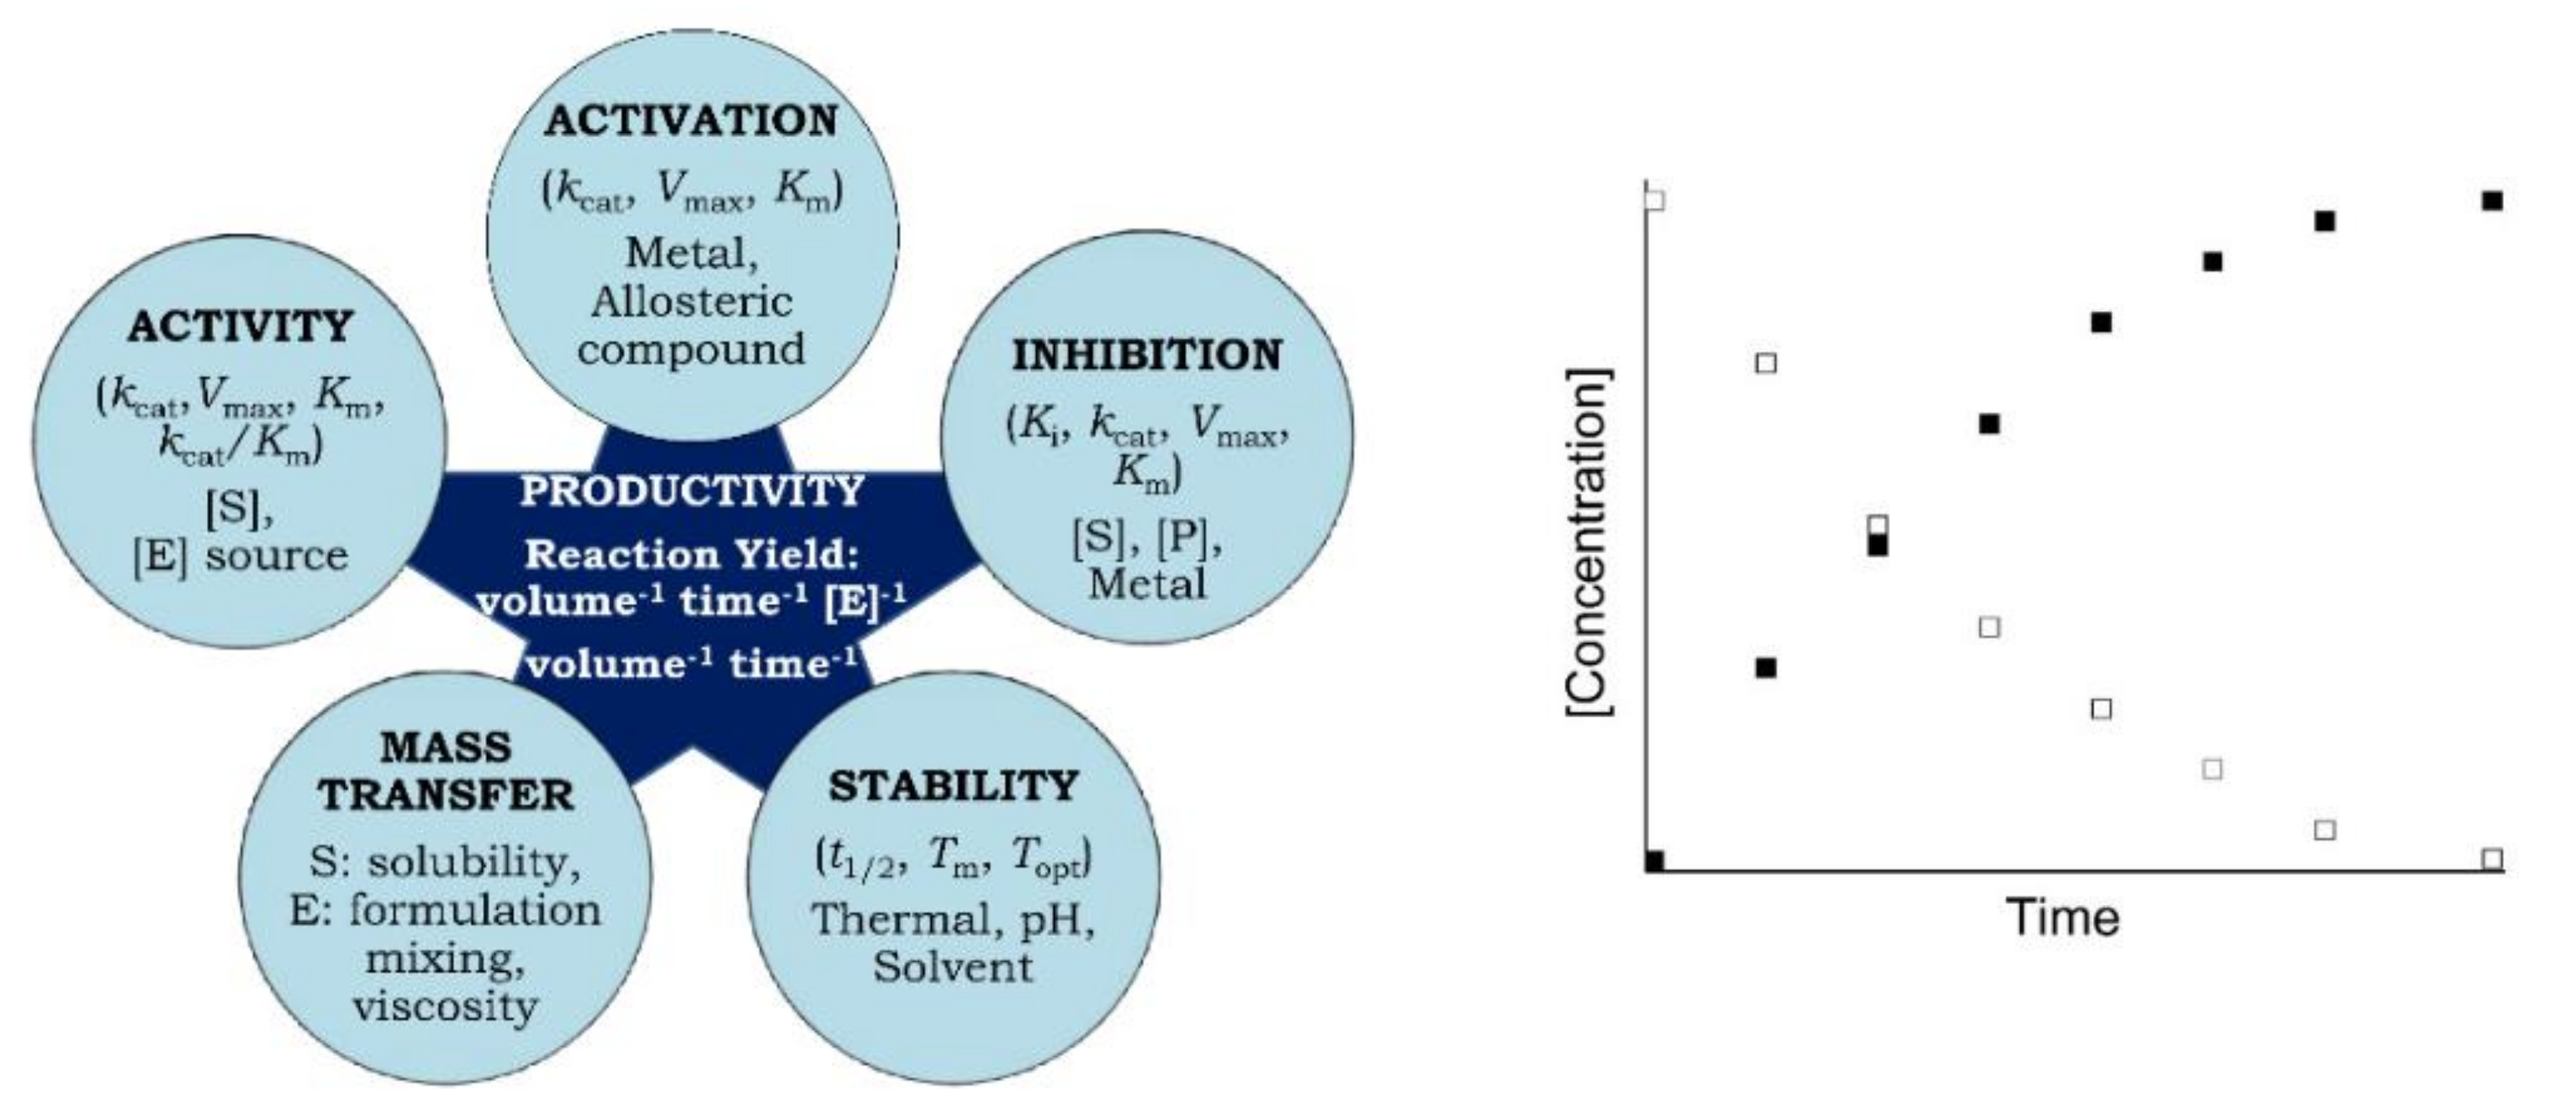
1. Typical Enzyme Characterization Methods and Factors That Influence Enzymatic Productivity
| Activity-based parameters:Vmax: Maximal velocity of enzyme catalyzed reaction; kcat (turnover number, Vmax/[E]): Number of substrate molecules converted to product by each catalytic site per unit time; Km: Enzyme-substrate affinity; kcat/Km (specificity) constant or catalytic efficiency: How efficient an enzyme can be on two different substrates; Ki: Enzyme-inhibitor affinity depicting extent and types of inhibition (competitive, non-competitive). Stability-based parameters: Topt: Optimum temperature of activity; t1/2: Half-life of irreversible thermal inactivation; Tm: Melting temperature at which 50% of protein structure and/or activity is lost. |
2. How Productivity Curves Can Be Prepared
Productivity curves can be readily generated by incubating equal or known amounts of enzymes (from two or more different organisms, isoforms or wild-type and genetically and chemically modified, immobilized enzymes or whole cells containing enzyme/s) with substrate/s in the presence or absence of additives at a specific temperature under optimum reaction conditions. Aliquots are withdrawn at regular intervals throughout the reaction, which is eventually quenched by any method that denatures or inactivates the enzyme. The formation of product or the disappearance of substrate (no matter which is more convenient) is then plotted as a function of time after correcting for any non-enzymatic reaction (Figure 1, right) [2]. The quantification of product or substrate can be followed by any suitable measure, such as change in absorbance, fluorescence or viscosity, radiometric, manometric, polarimetric, chromatographic, electrophoretic, electrochemical or mass spectrometric methods depending on the availability of equipment and consumables, convenience, simplicity, speed, safety, and cost [4]. Productivity is generally expressed as volumetric productivity (amount of product formed per reaction volume per unit time) or specific volumetric productivity (volumetric productivity per mg or g of enzyme) [5]. Whereas enzyme assays are based on the initial rate of substrate utilization in the absence of product formation and are usually completed within minutes, the duration of productivity analysis can extend to hours with significant depletion in substrate concentration and accumulation of product.
3. Significance and Applications of Productivity Analysis
Productivity curves monitor yields throughout a reaction process under specific conditions (pH, temperature, ionic strength, substrate and enzyme concentrations). Therefore, the amount of reaction product at the end of an extended period of time is dependent upon the irreversible inactivation of enzyme due to thermal unfolding and/or substrate/product inhibition. In this way, different forms of an enzyme, such as native vs. modified, soluble vs. immobilized [2][6][7][8] can be evaluated and more efficient enzymes can be identified and compared across studies. Moreover, productivity can be maximized in the presence of an additive [9] or by varying other reaction conditions, such as ionic strength, pH, and [S] and [E] concentrations [6].
Higher productivities of cold-adapted and mesophilic lipases have been achieved by chemical modification of enzymes using benzoic anhydride, Ficoll, and 5 kDa of PEG. Higher productivities of all lipases were due to their higher protein stability and resistance to thermal unfolding at higher temperature. Moreover, the modified lipases retained better activity in paint emulsions after 20 weeks of incubation at 25 °C, indicating that they may have a potentially superior value for industrial applications [10].
4. Basis for Higher Productivity
Although the productivity analysis will reveal which form of enzyme (native vs. modified, soluble vs. immobilized) or enzyme source provides the higher yield under optimal reaction conditions, the analysis does not inform us on the basis of its higher productivity. Higher productivity can be due to many factors, such as enhanced thermal stability, higher intrinsic activity, reduced inhibition of the enzyme or mass transfer. To dissect the basis for the higher yield of an enzyme, its Michaelis–Menten kinetics (Vmax/kcat, Ki, kcat/Km), and thermostability assays (t1/2, Topt, Tm) should be carried out. Table 1 lists the variables that can affect enhanced productivity.| Enzyme | Modification/ Additive |
Activity | Stability | [Substrate] | Inhibition | Reference |
|---|---|---|---|---|---|---|
| α-amylase | Native vs. CM | Dec. | Incr. | NA | NA | [8] |
| Lipase Lipase |
Native vs. CM Im |
Dec. Nd |
Incr. Nd |
NA 5–25% |
NA Nd |
[10] [19] |
| Savinase | Native vs. CM | Incr. | Dec. | NA | Dec. | [7] |
| β-galactosidase | Native vs. Im | Dec. | Incr. | NA | Dec. | [20] |
| Metalloprotease | Native vs. +Ca2+ | Incr. | Incr. | NA | NA | [9] |
| Penicillin acylase | Im vs. Im | NA | NA | Incr. 30–200 mM | NA | [6] |
| *GGT (Bl) GGT (Bl) GGT (E.coli) |
Native vs. Im ±Additives Native |
Dec. Incr. Nd |
Incr. Incr. Nd |
NA NA [donor:acceptor] |
NA NA NA |
[16] [12] [21] |
| Cellulase Cellulosome |
Native vs. Im @ GM: Meso- vs. thermophilic |
Incr. Var. |
Incr. Incr. |
NA NA |
Dec. NA |
[14] [22] |
5. Optimization of Parameters for Enhancing Productivity
Once the most efficient form of an enzyme has been identified, the reaction conditions (temperature, pH, substrate and enzyme concentrations, additives, etc.) should be optimized to maximize the reaction yield in the shortest time. If the basis of the effect of increased productivity is related to kinetic or stability improvements, then genetic or chemical modification can be considered for improving kcat, Km, t1/2 of inactivation and/or Topt. If the substrate and product are unfavorably impacting productivity, their concentrations can be controlled via substrate feeding or product removal. Problems related to mass transfer can be overcome by reactor design and configuration (substrate introduction and transport, cosolvent selection). Another key factor that impacts productivity is enzyme formulation and choice between whole cell biocatalysts, crude or purified enzyme, soluble or immobilized enzyme [19].
6. Conclusions
Due to the practical significance of enzyme catalyzed reactions in biochemical manufacturing, productivity curves are suggested to be generated under various conditions (pH, temperature, [S] and [E] concentrations) to assist in the optimization of reaction yields (Figure 1, left; Table 1) and minimize operational costs. Productivity maximization of enzyme catalyzed manufacturing process also requires optimization of other key reaction parameters [1]. These involve the selection of appropriate enzyme sources and formulations, yield improving enzyme modifications, choice of reaction solvents and additives, and enzyme reactor designs and modes of operation. This should all be considered in the initial planning of the process, with subsequent optimizations prioritized in the following hierarchy: enzyme activity and form, reaction conditions, and reactor design (Figure 2).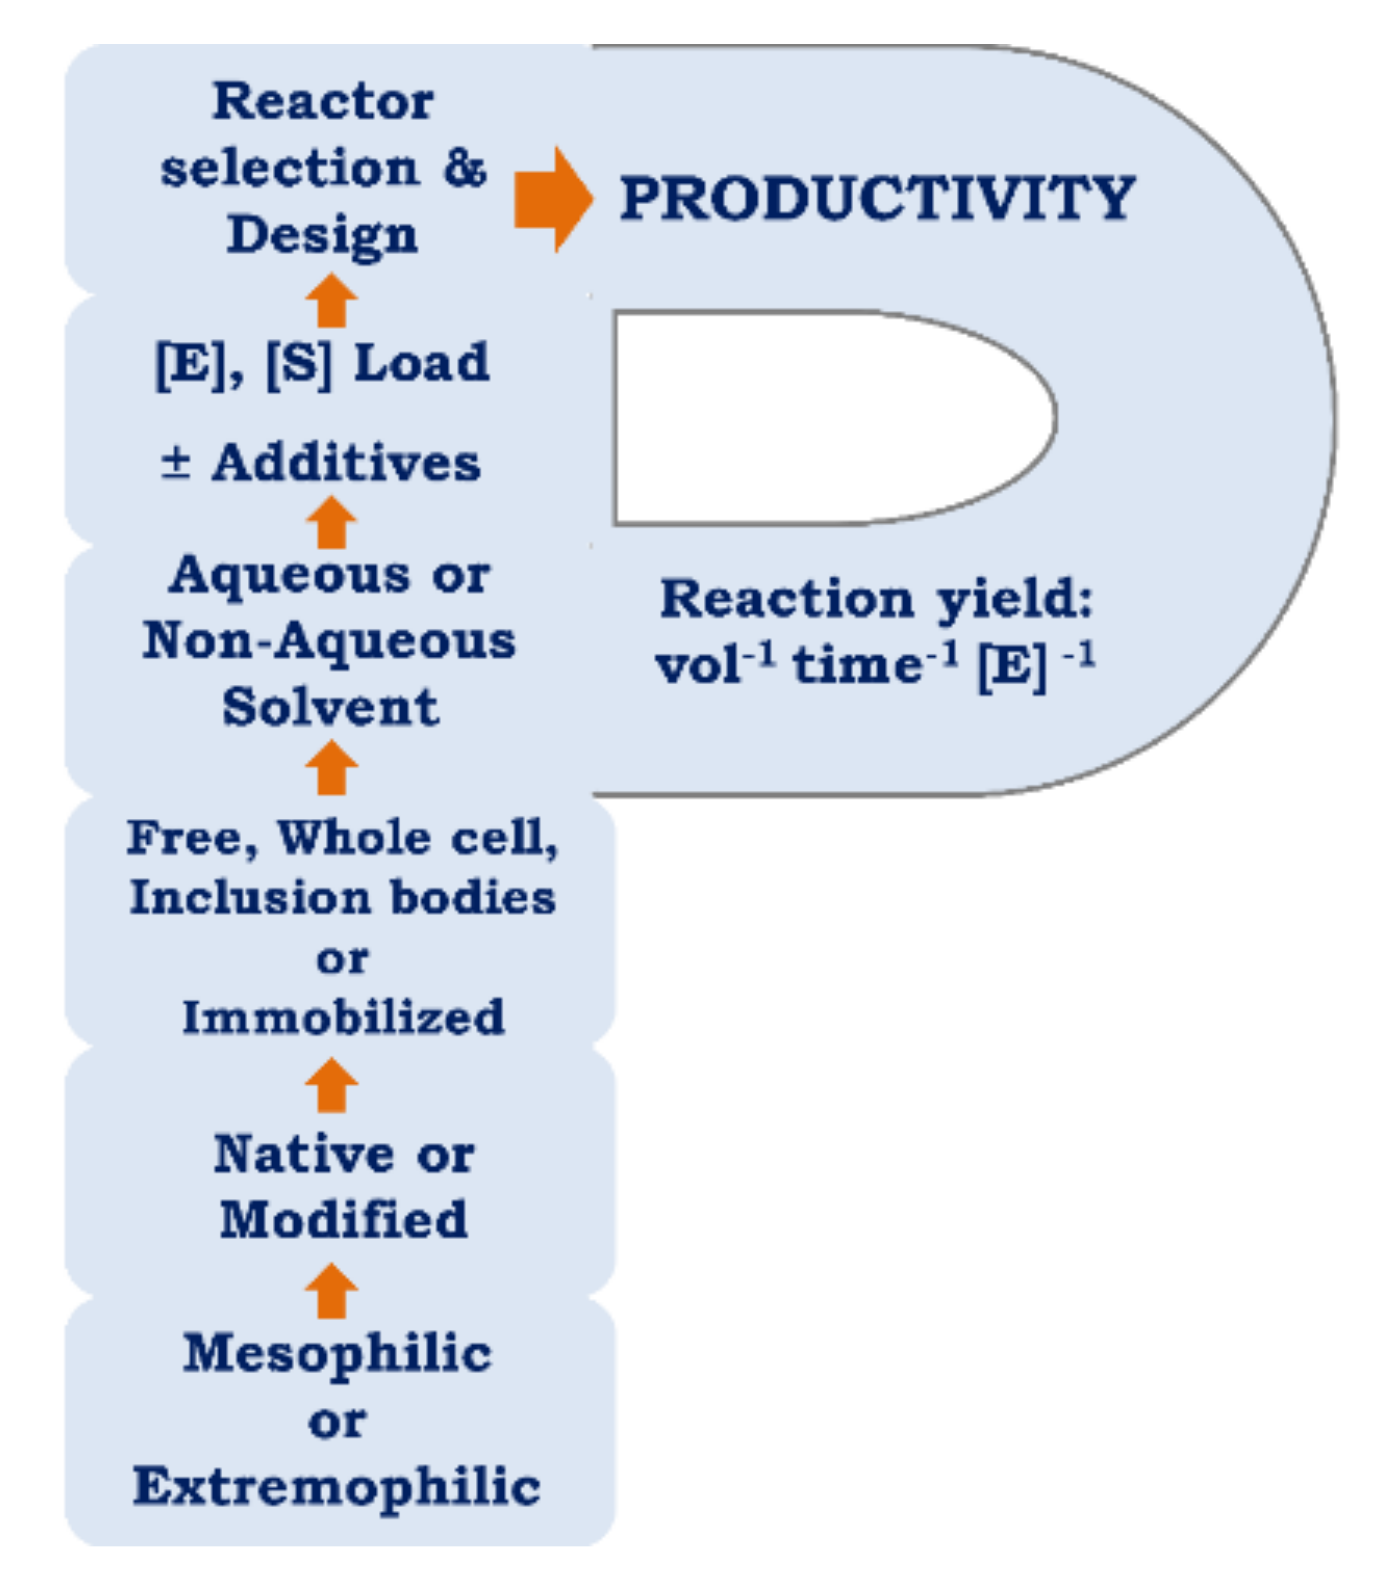
References
- Burton, S.; Cowan, D.; Woodley, J. The search for the ideal biocatalyst. Nat. Biotechnol. 2002, 20, 37–45.
- Fox, R.J.; Davis, S.C.; Mundorff, E.C.; Newman, L.M.; Gavrilovic, V.; Ma, S.K.; Chung, L.M.; Ching, C.; Tam, S.; Muley, S.; et al. Improving catalytic function by ProSAR-driven enzyme evolution. Nat. Biotechnol. 2007, 25, 338–344.
- Miłek, J. Estimation of the kinetic parameters for H2O2 enzymatic decomposition and for catalase deactivation. Braz. J. Chem. Eng. 2018, 35, 995–1004.
- Eisenthal, R.; Danson, M. (Eds.) Enzyme Assays: A Practical Approach, 2nd ed.; Oxford University Press: Oxford, UK, 2002.
- Küsters, K.; Pohl, M.; Krauss, U.; Ölçücü, G.; Albert, S.; Jaeger, K.E.; Wiechert, W.; Oldiges, M. Construction and comprehensive characterization of an EcLDCc-CatIB set-varying linkers and aggregation inducing tags. Microb. Cell Factories 2021, 20, 49.
- Illanes, A.; Wilson, L.; Altamirano, C.; Cabrera, Z.; Alvarez, L.; Aguirre-Cespedes, C.-A. Production of cephalexin in organic medium at high substrate concentrations with CLEA of penicillin acylase and PGA-450. Enzym. Microb. Technol. 2007, 40, 195–203.
- Siddiqui, K.S.; Parkin, D.M.; Curmi, P.M.; Francisci, D.D.; Poljak, A.; Barrow, K.; Noble, M.H.; Trewhella, J.; Cavicchioli, R. A novel approach for enhancing the catalytic efficiency of a protease at low temperature: Reduction in substrate inhibition by chemical modification. Biotechnol. Bioeng. 2009, 103, 676–686.
- Siddiqui, K.S.; Poljak, A.; De Francisci, D.; Guerriero, G.; Pilak, O.; Burg, D.; Raftery, M.J.; Parkin, D.M.; Trewhella, J.; Cavicchioli, R. A chemically modified α-amylase with a molten-globule state has entropically driven enhanced thermal stability. Protein Eng. Des. Sel. 2010, 23, 769–780.
- Ertan, H.; Cassel, C.; Verma, A.; Poljak, A.; Charlton, T.; Aldrich-Wright, J.; Omar, S.M.; Siddiqui, K.S.; Cavicchioli, R. A new broad specificity alkaline metalloprotease from a Pseudomonas sp. isolated from refrigerated milk: Role of calcium in improving enzyme productivity. J. Mol. Catal. B Enzym. 2015, 113, 1–8.
- Jayawardena, M.B.; Yee, L.H.; Poljak, A.; Cavicchioli, R.; Kjelleberg, S.J.; Siddiqui, K.S. Enhancement of lipase stability and productivity through chemical modification and its application to latex-based polymer emulsions. Process Biochem. 2017, 57, 131–140.
- Yan, K.; Tian, R.; Zhang, L.; Lv, X.; Liu, L.; Liu, Y. Biosynthesis of Guanidinoacetate by Bacillus subtilis Whole-Cell Catalysis. Fermentation 2022, 8, 116.
- Lin, L.-L.; Lu, B.-Y.; Chi, M.-C.; Huang, Y.-F.; Lin, M.-G.; Wang, T.-F. Activation and thermal stabilization of a recombinant γ-glutamyltranspeptidase from Bacillus licheniformis ATCC 27811 by monovalent cations. Appl. Microbiol. Biotechnol. 2022, 106, 1991–2006.
- Shemsi, A.M.; Khanday, F.A.; Qurashi, A.; Khalil, A.; Guerriero, G.; Siddiqui, K.S. Site-directed chemically-modified magnetic enzymes: Fabrication, improvements, biotechnological applications and future prospects. Biotechnol. Adv. 2019, 37, 357–381.
- Qi, B.; Luo, J.; Wan, Y. Immobilization of cellulase on a core-shell structured metal-organic framework composites: Better in-hibitors tolerance and easier recycling. Bioresour. Technol. 2018, 268, 577–582.
- Davidi, L.; Moraïs, S.; Artzi, L.; Knop, D.; Hadar, Y.; Arfi, Y.; Bayer, E.A. Toward combined delignification and saccharification of wheat straw by a laccase-containing designer cellulosome. Proc. Natl. Acad. Sci. USA 2016, 113, 10854–10859.
- Bindal, S.; Gupta, R. Theanine synthesis using γ-Glutamyl Transpeptidase from Bacillus licheniformis ER-15. J. Agric. Food Chem. 2014, 62, 9151–9159.
- Zarka, M.H.; Bridge, W.J. Oral administration of γ-glutamylcysteine increases intracellular glutathione levels above homeostasis in a randomised human trial pilot study. Redox Biol. 2017, 11, 631–636.
- Horowitz, R.I.; Freeman, P.R.; Bruzzese, J. Efficacy of glutathione therapy in relieving dyspnea associated with COVID-19 pneumonia: A report of 2 cases. Respir. Med. Case Rep. 2020, 30, 101063.
- Nordblad, M.; Gomes, M.D.; Meissner, M.P.; Ramesh, H.; Woodley, J.M. Scoping Biocatalyst Performance Using Reaction Trajectory Analysis. Org. Process Res. Dev. 2018, 22, 1101–1114.
- Mateo, C.; Monti, R.; Pessela, B.C.; Fuentes, M.; Torres, R.; Manuel Guisán, J.; Fernández-Lafuente, R. Immobilization of lactase from Kluyveromyces lactis greatly reduces the inhibition promoted by glucose. Full hydrolysis of lactose in milk. Biotechnol. Prog. 2004, 20, 1259–1262.
- Fukao, T.; Suzuki, H. Enzymatic Synthesis of γ-Glutamylvalylglycine Using Bacterial γ-Glutamyltranspeptidase. J. Agric. Food Chem. 2021, 69, 7675–7679.
- Moraïs, S.; Stern, J.; Kahn, A.; Galanopoulou, A.P.; Yoav, S.; Shamshoum, M.; Smith, M.A.; Hatzinikolaou, D.G.; Arnold, F.H.; Bayer, E.A. Enhancement of cellulosome-mediated deconstruction of cellulose by improving enzyme thermostability. Biotechnol. Biofuels 2016, 9, 164.
- Siddiqui, K.S.; Thomas, T. Protein Adaptations in Extremophiles; Nova Science Publishers Inc.: Hauppauge, NY, USA, 2008; p. 250.
- Klaewkla, M.; Pichyangkura, R.; Charoenwongpaiboon, T.; Wangpaiboon, K.; Chunsrivirot, S. Computational design of oligosaccharide producing levansucrase from Bacillus licheniformis RN-01 to improve its thermostability for production of levan-type fructooligosaccharides from sucrose. Int. J. Biol. Macromol. 2020, 160, 252–263.
- Kao, M.-R.; Kuo, H.-W.; Lee, C.-C.; Huang, K.-Y.; Huang, T.-Y.; Li, C.-W.; Chen, C.W.; Wang, A.H.-J.; Yu, S.-M.; Ho, T.-H.D. Chaetomella raphigera β-glucosidase D2-BGL has intriguing structural features and a high substrate affinity that renders it an efficient cellulase supplement for lignocellulosic biomass hydrolysis. Biotechnol. Biofuels 2019, 12, 258.
- Siddiqui, K.S.; Shemsi, A.M.; Guerriero, G.; Najnin, T.; Taha; Ertan, H. Biotechnological Improvements of Cold-Adapted Enzymes: Commercialization via an Integrated Approach. In Psychrophiles: From Biodiversity to Biotechnology; Margesin, R., Ed.; Springer: Berlin/Heidelberg, Germany, 2017; pp. 477–512.
- Poznansky, B.; Cleary, S.E.; Thompson, L.A.; Reeve, H.A.; Vincent, K.A. Boosting the productivity of H2-driven biocatalysis in a commercial hydrogenation flow reactor using H2 from water electrolysis. Front. Chem. Eng. 2021, 3, 718257.