Covid-19 has caused a huge impact on all aspects of the world, and the urban transport systems have experienced a severe challenge during the epidemic. Taxies play an important role in ensuring basic travel and show their unique advantages in epidemic prevention and control while the large volume of public transport modes are limited during the epidemic period. It is necessary to reevaluate the occupancy and consumption of resources and benefits of similar taxi transport modes, consider the relationship between similar taxi transport modes and other public transport modes, and establish a harmonious and symbiotic urban travel system. In the future, we aim to contribute to the establishment of an innovative, healthy, and safe urban transport system, restore the confidence in the public transport, and promote the development of sustainable transport systems after the epidemic through more research on the relationship between the epidemic and urban transport. After all, Urban mobility is not the main cause of the spread of the virus.
- COVID-19
- urban mobility
- taxi travel
- FCD
- trajectory data
- passenger
- spatial econometrics
- Points of Interest(POI); sustainable transport
- healthy city
- livable city
- public transport promotion
- new public transport system
- social activities
- social vitality
The abrupt COVID-19 epidemic has disrupted the normal economic and social development in China and throughout the world, especially for megacities because of their large populations [1][2]. Strict epidemic control measures have been adopted in many cities such as lockdown and work suspension because of the necessity of epidemic prevention and control, which have played an important role in controlling the rapid and large-scale spread of COVID-19 [3][4][5][6]. Undoubtedly, those epidemic control policies reduced the number of social and economic activities and had significant impacts on urban transport systems such as the sudden decrease of trips and the change of travel mode. Recently, the epidemic situation has been gradually alleviated and the economic and social recovery plan has been put on the agenda by the government during the post epidemic period. Under this circumstance, urban transport system plays a crucial role in the process of social recovery and economic recovery as the basic guarantee of the city. Therefore, more attentions should be paid on the impacts of the epidemic on urban transport system as well as the travel behavior.
Human beings have taken the most extensive and strict control measures to face the unprecedented epidemic. Infectious diseases are a major problem in public health prevention because of its high contagiousness. Therefore, it is essential to control or block the spread of virus from person-to-person and treat the infected person with entire efforts [7][8][9]. Based on the experiences from another epidemic in 2002 called SARS (Severe Acute Respiratory Syndrome), many similar measures were applied at the beginning of the prevention and control of COVID-19, such as active case screening, contact tracing, isolation of infected people and all associated contacts, social distancing, and community containment [10]. In fact, countries or regions that have been seriously affected by SARS are more experienced in coping with COVID-19. Control measures adopted by China have quickly alleviated the spread of the virus [11]. Some other studies have demonstrated the significance of the control measures applied during the first 50 days and suggested that Hubei Province and other megacities in China should extend their control periods [12][13]. Many traditional public health control measures such as isolation and quarantine, social distancing, and community containment could be applied for the prevention and control of large-scale spread of COVID-19 [14]. At the same time, it is also effective to strengthen hospital surveillance and infection control [15], reduce the contact rate of susceptible and infected residents, and isolate the infected people [16]. An extension of the traffic control bundling has been proved to be able to interrupt the community-hospital-community transmission cycle and thus reduce the impact of COVID-19 [17]. Research on epidemic specific containment measures and death rates in European countries showed that the speed of response along with the decision to suspend international flights might determine the impact of epidemic outbreak on fatality [18].
The essence of epidemic control measures is to restrict the movement and gathering of people which can normally be conducted by travel restrain. Statistical data have indicated that the number of national railway, highway, waterway, and civil aviation passengers in China during the Spring Festival in 2020 is only 49.7% of that number in 2019 [19]. Meanwhile, the operation of urban public transport travels were significantly affected by the epidemic. For example, bus and urban rail transit have taken certain measures which includes the reduction of frequency, extension of departure interval, and adjustment of operation time based on the travel demand. Therefore, the total passenger traffic in central cities across China in February 2020 was 50.3% of the same period in 2019, which continuously decreased to 43.4% in March 2020 [20]. Public transport users have dropped by more than 90% in some European cities [4][21]. Interestingly, some studies have demonstrated that the interventions to control the COVID-19 outbreak led to an improvement of air quality which could bring health benefits for non-COVID-19 deaths and potentially outnumber the confirmed deaths caused by COVID-19 in China [22].
Several concerns about the impacts of the epidemic on transport system and travel behavior are emerged after the outbreak of COVID-19. For example, many scholars are interested in the differences in the travel behavior of residents compared to the normal period and what factors may affect the travel behavior of residents as well as the level of economic and social recovery in the post epidemic period. Huang et al. quantified the impact of COVID-19 on transportation-related behaviors of the public based on the navigation record, indicating that the COVID-19 epidemic did cause a great impact on transportation-related behaviors of the public in Mainland China [23]. Wilbur et al. founded that there was a significant difference in ridership decline between the highest-income areas and lowest-income areas (77% vs. 58%) in Nashville, and they believed that the epidemic has a greater impact on low-income groups [24]. Arellana et al. used official and secondary data from the top seven most populated cities in Colombia to analyze the impacts on air transport, freight transport, and urban transport. The results showed that national policies and local decisions have reduced the demand for the transport system [25].
The travel mode choice behavior was also influenced by the epidemic. During the epidemic period, people try to avoid crowded places because they are required to keep a social distance. However, since it is difficult to satisfy the requirement of a social distance of more than 2 meters on most public transport vehicles, many people treat public transport as an unsafe transport mode during the epidemic period [24]. It is obvious to all that the trips of public transport decreased dramatically during the epidemic period, and many researchers believe that the trips of public transport will maintain a low level for a long time, which will be replaced by the increase of other transport modes such as private vehicles, non-motorized vehicles, and walking [26]. Public transport must change the impression of insecurity for attracting more passengers, and it is necessary for the government to strengthen the policy support for public transport in the post epidemic period because public transport has a great impact on many social issues, such as social equity and sustainable development [27].
The assessment of the impact of the epidemic on public transport and social economy is very important for the reconstruction work in the post epidemic period. The economic development has been slowed down and the transport industry has been seriously impacted due to the epidemic [28]. It is difficult to predict what the city will look like after the epidemic, but it is assured that the economic recovery will not be achieved overnight [29]. Meanwhile, it is necessary to assess the extent of socio-economic and transport impacts caused by the epidemic for the better guidance of the economic recovery. Tang et al. proposed a Bayesian Network Model based on a function-oriented resilience framework and ontological interdependence among 10 system qualities to probabilistically assess the general resilience of the road transport system in Beijing from 1997 to 2016 [30]. A resilient transport system will enhance its ability to resist risks and ensure that it can continue to play a role under the influence of emergencies. Resilient and sustainable infrastructure will continue to be critical to addressing evolving natural and man-made hazards in the 21st Century [31]. Wang et al. applied the complex network theory to establish a model of air sector network in China and examined a series of characteristic parameters with an empirical analysis on its vulnerability and resilience [32]. From the perspective of mobility, Huang et al. proposed two new economic indicators as the complementary measures to domestic investments and consumption activities by using data from Baidu Maps [33]. Gössling et al. analyzed the long-term impact of the epidemic on tourism and discusses the recovery assessment of tourism in the future [34]. Dang et al. evaluated the economic recovery of Vietnam in the post epidemic period. A web-based rapid assessment survey was implemented and analyzed in Vietnam to investigate household finance and future economic expectations in developing countries [35].
As an important supplement of public transport in most megacities, taxies can record the exact time and location of departure and arrival, and the boarding and alighting locations of taxi passengers are closer to the origin and destination of trips compared to other public transport modes [36]. The 24-h continuous operation of taxies can reflect the demand and dynamic change of urban traffic [37]. Therefore, it is more suitable to use data of taxi travel to conduct the travel temporal-spatial analysis based on the several reasons mentioned above. Point of interest (POI) is the precise positioning of urban function points, which has been proved to have a strong correlation with travel behaviors [38]. Taxi trajectory data combined with POI data is usually used to analyze the relationship between travel behavior and urban land use in many studies [39][40].
Most recent research which studied the interaction between COVID-19 and mobility mainly focused on the impact of the epidemic on the travel trips by analyzing the changes of number of trips between the normal period and the epidemic period. However, fewer studies were conducted on the changes in the temporal and spatial dimension of travel. Meanwhile, it is widely believed that the travel behavior of residents is strongly related to social activities and epidemic control policies during the epidemic period. In this case, we hope to explore the impacts of different control policies on travel behavior during the epidemic period in this study. Moreover, the main driving factors of travel and the changes occurred with the impact of urban land use are also investigated. The answers to these questions are of great importance to the improvement of epidemic prevention and control as well as the planning and construction of sustainable cities and sustainable transport in the future. Current transport related research during the epidemic period mainly focused on the changes of trips such as bus, rail transit, and aviation. However, there are still many restrictions on these modes of transport, such as the limitations on travel time and travel area. For example, most public transport vehicles usually stop operating at night and cannot reach anywhere in the city. Therefore, it is novel and creative to study the impact of COVID-19 on travel behavior and transport system from the perspective of taxi trips.
In addition, the epidemic has had a serious impact on the economy that the average income of people have dropped sharply and many people even lost their jobs [41][42][43]. Under this circumstance, economic recovery is treated as the primary task for the post epidemic period. Compared to the assessment based on investigation or statistics which is usually expensive and time-costing, it is important to formulate the economic policies by evaluating the social vitality in a relatively short time.
2. Taxi Travel Characteristics before and during the Epidemic
TheBy overall characteristics of the taxi trips in Chongqing are estimated in this section. The numbers of daily taxi trips are compared during the study period and temporal distribution of taxi trips areconsidering several research gaps mentioned above, this paper analyzed among 14 characteristic days. Meanwhile, the distribution of basic information such as trip length, trip time, and trip speed are also discussed in this section. Moreover, taxi mileage utilization ratio is calculated which is the ratio of occupied mileage to total operating mileage, and taxi time utilization ratio is determined which is the ratio of occupied time to total operating time.
2.1. Number of Daily Trips
The number s the impact of COVID-19 on travel of people from the perspective of taxi travel and epidemic control pof daily trips during the study period is generated from the datasets as shown in Figure 1.icies. First, changes in Tthe sample size collected from this particular taxi company accounted for about 35% of the total number of taxies and taxi trips in Chongqing.
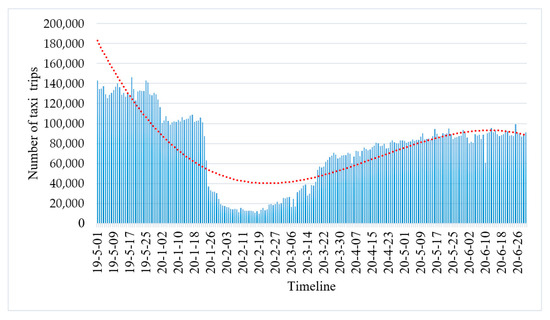
Figure 1. Total number of taxi trips per day.
As shown in Figure 3, the number ocharacteristics of daily taxi trips clearly fluctuated during the study at each period. During the normal period without any e of the epidemic, the average number of daily taxi trips in Chongqing was 132,756 in May 2019. Due to the outbreak of COVID-19 in January 2020, the number of taxi trips in Chongqing slumped to 63,152 on 24 January with the enforcement of “First-Level Public Health Emergency Response (PHER),” and further dropped to 36,798 on 25 January. During the early stage of the epidemic, the number of daily taxi trips stayed at a low level and reached the lowest value of 12,517 on 14 February. Compared to the normal period without epidemic, the average number of daily taxi trips in February 2020 is 14,975, which is only 11.3% of the average daily taxi trips in May 2019. The number of daily taxi trips start were analyzed. Next, the relationship between POIs and taxi travels was established by the GIS method, and the spatial lag model (SLM) was introduced to rise in 11 March because the level of PHER was downgraded by the central government from first level to second level. The dailyexplore the changes in taxi trips rose gradually from March to June and reached 99,177 on 25 June. Although the daily number of taxi trips kept rising during the post epidemic period, there was still a 30% difference in the number of taxi trips on 25 June compared to the normal period in May 2019.
2.2. Temporal Distribution of Trips in a Day
In ordavel driving force. Finally, a social activities recovery ler to vexplore the temporal distribution of daily trips, a workday and one day of the weekend were selected from the same week for each month. The weather condition is considered because abnormal weather may significantly affect the tl evaluation model was proposed based on the taxi travel characteristics of taxies [44]. Other disturbdatasets to evances sluch as holidays, major events, extreme weather conditions (high temperature, low temperature, heavy rainfall, and heavy pollution) were also eliminated during the selection. As a consequence, 14 characteristic days were selectedate the recovery level of social activities.
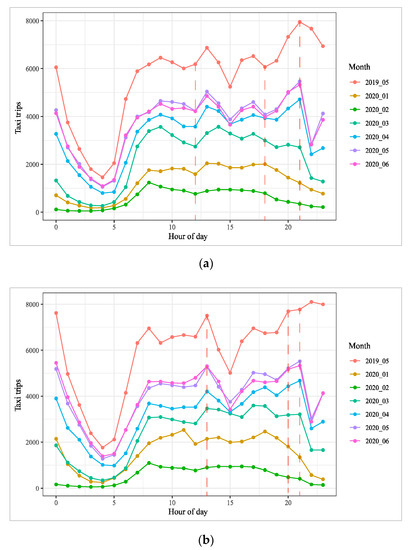
based on the principles mentioned above and the summary of characteristic days are shown in Table 1. The The implications and contemporal distriibution of taxi trips on weekdays and weekends are analyzed separately for these characteristic days, as presented in Figure 2.
| Index | Selected Days | Day of the Week | Weather Condition |
|---|---|---|---|
| 1 | 22 May 2019 | Wednesday | Cloudy |
| 2 | 25 May 2019 | Saturday | Overcast |
| 3 | 25 January 2020 | Saturday | Overcast |
| 4 | 29 January 2020 | Wednesday | Cloudy |
| 5 | 20 February 2020 | Thursday | Overcast |
| 6 | 22 February 2020 | Saturday | Overcast |
| 7 | 19 March 2020 | Thursday | Cloudy |
| 8 | 21 March 2020 | Saturday | Cloudy |
| 9 | 11 April 2020 | Saturday | Cloudy |
| 10 | 15 April 2020 | Wednesday | Cloudy |
| 11 | 20 May 2020 | Wednesday | Overcast |
| 12 | 23 May 2020 | Saturday | Cloudy |
| 13 | 13 June 2020 | Saturday | Overcast |
| 14 | 18 June 2020 | Thursday | Cloudy |
No significs of this study are summarized ant difference is found between the number of trips on workdaysllows:
and weekends among the 14 selected characteristic days, while the temporal distribution of taxi trips is slightly different between weekdays and weekends. The differences in temporal distribution between workdays and weekends can be analyzed from the perspective of morning peak, night peak, and epidemic effects.
This paper supplements the lack of research on the impact The morning peak differences are obvious as presented in Figure 2. A relaf COVID-19 on tively gradual rise of taxi trips can be observed during morning peak on weekdays, while a rapid growth occurred on the weekends. Meanwhile, the largest number of taxi trips during the morning peak occurred at 9:00 AM on weekdays but 8:00 AM on weekends.
Morxi travel and enriches the research on the impact of the epideover, the dmifferences in night trips between the two days in May 2019 are examined. The number of trips began to gradually decrease after 9:00 PM on weekdays and the decreasing amplitude was obvious. However, the number of trips began to gradually decrease after 10:00 PM on weekends while the decreasing amplitude was not obvious, indicating that the vitality of night activities on weekends was higher during normal periods.
Significc on urban traffic. Due to the fact that the taxi has the advantages of 24-h operation and can operant differences in temporal distribution of taxi trips can be recognized before and during the epidemic. Firste in any area of the city, the number of trips dropped sharply during the epidemic period, which has slumped from January, dropped to a minimum in February, gradually recovered from March to May, and maintained at a relatively stable state in June. Secondly, in terms of temporal distribution, the number of trips during the outbreak period is relatively balanced throughout the day,scope of time and space for this research is expanded and the overall fluctuation is significantly smaller than the normal period. The most obvious difference before and during the epidemic is at night, where the number of trips gradually rises from around 7:00 PM to around 9:00–10:00 PM during the normal period, and slightly declined until the early morning after reaching the peak with an overall high number of night trips. The number of trips began to decline from around 6:00 PM and reached the lowest point in the early morning during the outbreak period. Thirdly, the characteristics of temporal distribution from March to June after the outbreak period are relatively similar. The number of trips has increased significantly from March especially for night trips, and the trips normally reach a peak point at 9:00 PM and followed by a sharp decrease.
2.3. Basic Characteristics of the Trips
As shown ravel characteristics of residents are captured in the whole day and the whole city to study the spatial and temporal changes of taxi trips. Moreover, operation information included in Figure 3, the basic characteristics of taxi trips such as trip length, trip speed, and trip time among 14 characteristic daytaxi datasets are summarized by box diagrams. As presented in part (a) and part (b) of Figure 5, littlused to study the differences can be recognized between workdays and weekends of each month from the perspective of these basic characteristics, indicating similar characteristics of taxi trips between workdays and weekends.
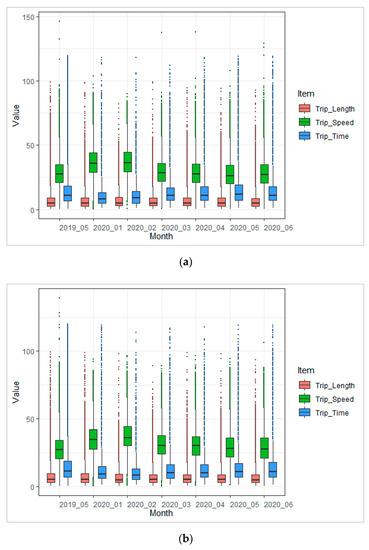
Figure 3. Box diagram of trip length, trip speed and trip time. (a) Weekdays; (b) Weekends. Note: the ordinate represents the value of trip length (km), trip speed (km/h), and trip time (minute).
hange of taxi operation and analyze the degree and trend In order to investigate tf the impacts of epidemic on taxi trips, the distinct characteristics of taxi trips during pre-epi of the epidemic period, the outbreak period, and the post-epidemic period were identified and compared. The average trip length during the outbreak period ison the income of drivers.
slightly lower than pre-epidemic period and slightly higher than the post-epidemic period. As expected In this study, the trip speed during the outbreak period is significantly higher than pre-epidemic and post-epidemic periods because of the lower number of vehicles on the streets. As a result, the average trip time during outbreak period is also significantly lower than other periodsinformation and travel behavior are related to POI by the GIS method.
2.4. Analysis of Utilization Ratio
The taxi mileage utilization ratio refers to the ratio of occupied mileage to total operating mileage, and taxi time utilization ratio refers to the ratio of occupied time to total operating time. The dailyspatial econometric model is introduced to evaluate the changes of taxi mileage utilization ratio MURi and ttravel drivime utilization ratio TURi ag fore calculated and shown in Figure 4.
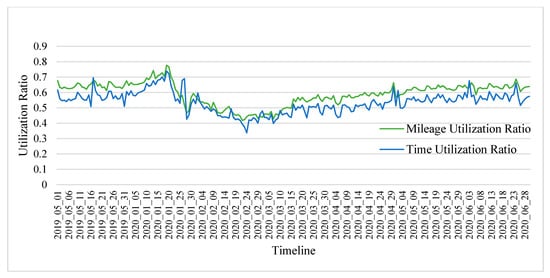
Figure 4. Graph of mileage utilization ratio and time utilization ratio.
The and the milreage utilization ratio and time utilization ratio of taxi in Chongqing are significantly influenced by COVID-19. As presented in Figure 6, the lationship between the spatial-temileage utilizatipon ratio and time utilization ratio slightly increased due to the regular Spring Festival travel rush in January 2020, followed by a sharp decline because of the outbreak of the epidemic in February 2020, and then rose gradually over the post ral evolution of travel and urban functional structure during the epidemic period from March to June 2020.
2.5. Monthly Operating Income
The mon. A previous sthludy operating income was calculated based on the actual order fare both for drivers and taxies. The kernel density curves are used to reflect the monthly operating income of drivers and taxies armentioned that POIs have numerous attribute information which are related to the types of land use shown in Figure 5[44].
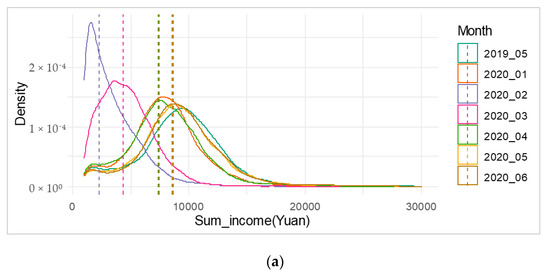
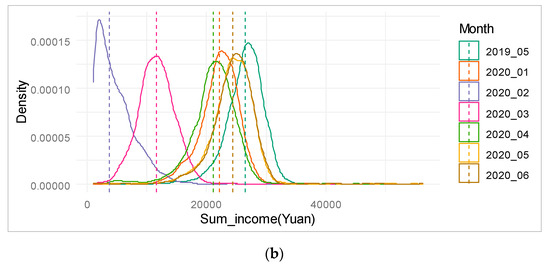
Figure 5. The kernel density curve of the monthly operating income, (a) Drivers; (b) Taxies. Note: the vertical dotted line is the average value of operating income for each month (unit: CNY).
During tThe study period, the driver operating income varies significantly from month to month. The driver operating income fell sharply in February, with an average income of about 2200 CNY (China Yuan), which is only about a quarter of the income during normal period (8600 CNY). The average driver operating income in March rose to about 4500 CNY, and rebounded further in the following months. Over the several months of post epidemic period, the driver operating income in May and June are almost the same as the normal period. Interestingly, the driver operating income in January 2020 was marginally affected by the epidemic because the epidemic broke out in late January and the passengerrefore, POIs can accurately represent the distribution characteristics of urban function points and have a strong correlation with travel purpose [45]. flMow during the Spring Festival holiday was relatively larger than normal. The influences caused by the epidemic on taxi monthly operating income are similar to the operating income for drivers, which is also significantly affected breover, this study is able to study the outbreak of COVID-19.
2.6. Spatial Distribution of Origins and Destinations
Kerrelationel density estimation are conducted for the comparison of spatial hip between the distribution by using data from characteristic days selected in May 2019 and February 2020. The spatial distributiof POI and origin and destination of taxi trips on weekdays are shown by four Kernel density diagrams in Figure 6.
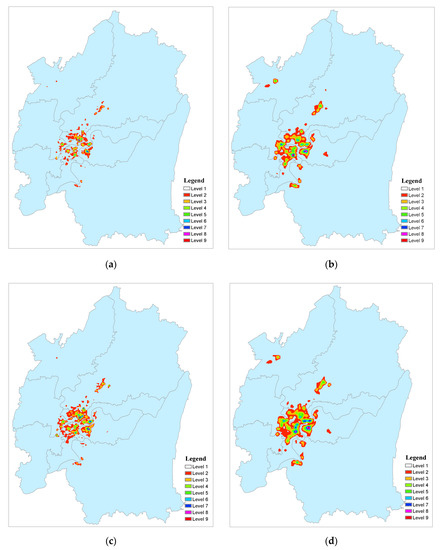
Figure 6. Kernel density of spatial distribution of taxi trips on characteristic days, (a) Trip origins (22 May 2019); (b) Trip origins (20 February 2020); (c) Trip destinations (22 May 2019) (d) Trip destinations (20 February 2020).
As presbecausented in part (a) and (b) of Figure 8, tthe spatial distribunformation of trip origin during the epidemic period and the normal period are significantly different. The range of distribution is larger for the epidemic period than the normal period. Meanwhile, the spatial aggregation is weakened and the differences in travel density within the region are also reduced compared to the normal period. Moreover, changes in the quantity and distribution of travel hot spots can be recognized from the figure.
As presented axi travel is also included in taxi datasets. Since the construction of the social activity recovery level evaluation model during part (c) and (d) of Figure 8, tthe differences in the spatial distribution of trip destination between the eost epidemic period and the normal period is also obvious. The distribution range of trip destination isis only relied on the travel data of taxi, this study also larger for the epidemic period than the normal period and the differences between regions are reduced and relatively balanced for the epidemic period. Meanwhile, some new travel hot spots emerged in the epidemic period in February 2020.
In summary, taxi trips were reproposed an alternative model which can evaluate the recovery level with relatively scmattered in spatial distribution during the epidemic period and many concentrated residential areas were transformed from low-travel areas to new travel hotspots due to the epidemicll data sample.
References
- Leung, K.; Wu, J.T.; Liu, D.; Leung, G.M. First-wave COVID-19 transmissibility and severity in China outside Hubei after control measures, and second-wave scenario planning: A modelling impact assessment. Lancet 2020, 395, 1382–1393.
- Chakraborty, I.; Maity, P. COVID-19 outbreak: Migration, effects on society, global environment and prevention. Sci. Total Environ. 2020, 728, 138882.
- Lau, H.; Khosrawipour, V.; Kocbach, P.; Mikolajczyk, A.; Schubert, J.; Bania, J.; Khosrawipour, T. The positive impact of lockdown in Wuhan on containing the COVID-19 outbreak in China. J. Travel Med. 2020, 27, 1–7.
- Hadjidemetriou, G.M.; Sasidharan, M.; Kouyialis, G.; Parlikad, A.K. The impact of government measures and human mobility trend on COVID-19 related deaths in the UK. Transp. Res. Interdiscip. Perspect. 2020, 6, 100167.
- Verheyden, B.; Askitas, N.; Tatsiramos, K. Lockdown Strategies, Mobility Patterns and COVID-19. Available online: https://arxiv.org/abs/2006.00531 (accessed on 31 May 2020).
- Baker, S.R.; Farrokhnia, R.A.; Meyer, S.; Pagel, M.; Yannelis, C. How Does Household Spending Respond to an Epidemic? Consumption during the 2020 COVID-19 Pandemic. Available online: https://www.nber.org/papers/w26949 (accessed on Apr 2020).
- World Health Organization. Coronavirus Disease 2019 (COVID-19) Situation Report-72 HIGHLIGHTS; WHO: Geneva, Switzerland, 2020.
- Lipsitch, M.; Cohen, T.; Cooper, B.; Robins, J.M.; Ma, S.; James, L.; Gopalakrishna, G.; Chew, S.K.; Tan, C.C.; Samore, M.H.; et al. Transmission dynamics and control of severe acute respiratory syndrome. Science. 2003, 300, 1966–1970.
- Chinazzi, M.; Davis, J.T.; Ajelli, M.; Gioannini, C.; Litvinova, M.; Merler, S.; Pastore y Piontti, A.; Mu, K.; Rossi, L.; Sun, K.; et al. The effect of travel restrictions on the spread of the 2019 novel coronavirus (COVID-19) outbreak. Science. 2020, 368, 395–400.
- Wilder-Smith, A.; Chiew, C.J.; Lee, V.J. Can we contain the COVID-19 outbreak with the same measures as for SARS? Lancet Infect. Dis. 2020, 20, e102–e107.
- Gössling, S.; Scott, D.; Hall, C.M. Pandemics, tourism and global change: A rapid assessment of COVID-19. J. Sustain. Tour. 2020, 1–20.Aloi, A.; Alonso, B.; Benavente, J.; Cordera, R.; Echániz, E.; González, F.; Ladisa, C.; Lezama-Romanelli, R.; López-Parra, Á.; Mazzei, V.; et al. Effects of the COVID-19 lockdown on urban mobility: Empirical evidence from the city of Santander (Spain). Sustainability. 2020, 12, 3870.
- Zeng, W.; Fu, C.; Müller Arisona, S.; Schubiger, S.; Burkhard, R.; Ma, K. Visualizing the Relationship Between Human Mobility and Points of Interest. IEEE Trans. Intell. Transp. Syst. 2017, 18, 2271–2284.Gössling, S.; Scott, D.; Hall, C.M. Pandemics, tourism and global change: A rapid assessment of COVID-19. J. Sustain. Tour. 2020, 1–20.
- Zeng, W.; Fu, C.; Müller Arisona, S.; Schubiger, S.; Burkhard, R.; Ma, K. Visualizing the Relationship Between Human Mobility and Points of Interest. IEEE Trans. Intell. Transp. Syst. 2017, 18, 2271–2284.Gössling, S.; Scott, D.; Hall, C.M. Pandemics, tourism and global change: A rapid assessment of COVID-19. J. Sustain. Tour. 2020, 1–20.
- Chen, F., Yin, Z., Ye, Y., Sun, D.J. Taxi Hailing Choice Behavior and Economic Benefit Analysis of Emission Reduction Based on Multi-mode Travel Big Data, Transport Policy, 2020, 97, 738–4.
- Liu, X.; Sun, L.; Sun, Q.; Gao, G. Spatial Variation of Taxi Demand Using GPS Trajectories and POI Data. J. Adv. Transp. 2020, 2020, 7621576.
- Chen, F., Yin, Z., Ye, Y., Sun, D.J. Taxi Hailing Choice Behavior and Economic Benefit Analysis of Emission Reduction Based on Multi-mode Travel Big Data, Transport Policy, 2020, 97, 738–4.
- Sun, D.J., Zhang, C., Zhang, L., Chen, F., Peng, Z.-R. Urban travel behavior analyses and route prediction based on floating car data, Transportation Letters: The International Journal of Transportation Research, 2020, 6(3), 1181–25.
- Martin, A.; Markhvida, M.; Hallegatte, S.; Walsh, B. Socio-Economic Impacts of COVID-19 on Household Consumption and Poverty. Available online: https://link.springer.com/article/10.1007/s41885-020-00070-3#citeas (accessed on 23 July 2020).
- Karpman, M.; Acs, G. Employment, Income, and Unemployment Insurance during the COVID-19 Pandemic. Available online: https://www.urban.org/sites/default/files/publication/102485/employment-income-and-unemployment-insurance-during-the-covid-19-pandemic.pdf (accessed on 30 Jun 2020).
- Farber, H.S. Why you can’t find a taxi in the rain and other labor supply lessons from cab drivers. Q. J. Econ. 2015, 130, 1975–2026.Andrade, R.; Alves, A.; Bento, C. POI Mining for Land Use Classification: A Case Study. ISPRS Int. J. Geo-Inf. 2020, 9, 493.
- Zeng, W.; Fu, C.; Müller Arisona, S.; Schubiger, S.; Burkhard, R.; Ma, K. Visualizing the Relationship Between Human Mobility and Points of Interest. IEEE Trans. Intell. Transp. Syst. 2017, 18, 2271–2284.
- Dang, H.A.; Giang, L. Turning Vietnam’s COVID-19 Success into Economic Recovery: A Job-Focused Analysis of Individual Assessments on Their Finance and the Economy. Available online: https://papers.ssrn.com/sol3/papers.cfm?abstract_id=3620630 (accessed on 9 June 2020)
- Sun, D.; Ding, X. Spatiotemporal evolution of ridesourcing markets under the new restriction policy: A case study in Shanghai. Transp. Res. Part A Policy Pract. 2019, 130, 227–239.
- Sun, D.; Zhang, K.; Shen, S. Analyzing spatiotemporal traffic line source emissions based on massive didi online car-hailing service data. Transp. Res. Part D Transp. Environ. 2018, 62, 699–714.
- Gong, L.; Liu, X.; Wu, L.; Liu, Y. Inferring trip purposes and uncovering travel patterns from taxi trajectory data. Cartogr. Geogr. Inf. Sci. 2016, 43, 103–114.
- Liu, X.; Sun, L.; Sun, Q.; Gao, G. Spatial Variation of Taxi Demand Using GPS Trajectories and POI Data. J. Adv. Transp. 2020, 2020, 7621576.
- Chen, F., Yin, Z., Ye, Y., Sun, D.J. Taxi Hailing Choice Behavior and Economic Benefit Analysis of Emission Reduction Based on Multi-mode Travel Big Data, Transport Policy, 2020, 97, 738–4.
- Fernandes, Nuno, Economic Effects of Coronavirus Outbreak (COVID-19) on the World Economy. Available online: https://ssrn.com/abstract=3557504 (accessed on 13 Apr 2020).
- Batty, M. The Coronavirus crisis: What will the post-pandemic city look like? Environ. Plan. B Urban Anal. City Sci. 2020, 47, 547–552.
- Tang, J.; Heinimann, H.R.; Han, K. A Bayesian network approach for assessing the general resilience of road transportation systems: A systems perspective. In Proceedings of the CICTP 2019: Transportation in China—Connecting the World, Jiangsu, China, 6–8 June 2019.
- Amekudzi-Kennedy, A.; Labi, S.; Woodall, B.; Chester, M.; Singh, P. Reflections on Pandemics, Civil Infrastructure and Sustainable Development: Five Lessons from COVID-19 through the Lens of Transportation. Available online: https://www.preprints.org/manuscript/202004.0047/v1 (accessed on 6 Apr 2020).
- Wang, X.; Miao, S.; Tang, J. Vulnerability and resilience analysis of the air traffic control sector network in China. Sustainability 2020, 12, 3749.
- Huang, J.; Wang, H.; Xiong, H.; Fan, M.; Zhuo, A.; Li, Y.; Dou, D. Quantifying the Economic Impact of COVID-19 in Mainland China Using Human Mobility Data. Available online: https://arxiv.org/abs/2005.03010 (accessed on 6 May 2020).
- Gössling, S.; Scott, D.; Hall, C.M. Pandemics, tourism and global change: A rapid assessment of COVID-19. J. Sustain. Tour. 2020, 1–20.
- Dang, H.A.; Giang, L. Turning Vietnam’s COVID-19 Success into Economic Recovery: A Job-Focused Analysis of Individual Assessments on Their Finance and the Economy. Available online: https://papers.ssrn.com/sol3/papers.cfm?abstract_id=3620630 (accessed on 9 June 2020)
- Sun, D.; Ding, X. Spatiotemporal evolution of ridesourcing markets under the new restriction policy: A case study in Shanghai. Transp. Res. Part A Policy Pract. 2019, 130, 227–239.
- Sun, D.; Zhang, K.; Shen, S. Analyzing spatiotemporal traffic line source emissions based on massive didi online car-hailing service data. Transp. Res. Part D Transp. Environ. 2018, 62, 699–714.
- Gong, L.; Liu, X.; Wu, L.; Liu, Y. Inferring trip purposes and uncovering travel patterns from taxi trajectory data. Cartogr. Geogr. Inf. Sci. 2016, 43, 103–114.
- Liu, X.; Sun, L.; Sun, Q.; Gao, G. Spatial Variation of Taxi Demand Using GPS Trajectories and POI Data. J. Adv. Transp. 2020, 2020, 7621576.
- Chen, F., Yin, Z., Ye, Y., Sun, D.J. Taxi Hailing Choice Behavior and Economic Benefit Analysis of Emission Reduction Based on Multi-mode Travel Big Data, Transport Policy, 2020, 97, 738–4.
- Sun, D.J., Zhang, C., Zhang, L., Chen, F., Peng, Z.-R. Urban travel behavior analyses and route prediction based on floating car data, Transportation Letters: The International Journal of Transportation Research, 2020, 6(3), 1181–25.
- Martin, A.; Markhvida, M.; Hallegatte, S.; Walsh, B. Socio-Economic Impacts of COVID-19 on Household Consumption and Poverty. Available online: https://link.springer.com/article/10.1007/s41885-020-00070-3#citeas (accessed on 23 July 2020).
- Karpman, M.; Acs, G. Employment, Income, and Unemployment Insurance during the COVID-19 Pandemic. Available online: https://www.urban.org/sites/default/files/publication/102485/employment-income-and-unemployment-insurance-during-the-covid-19-pandemic.pdf (accessed on 30 Jun 2020).
- Farber, H.S. Why you can’t find a taxi in the rain and other labor supply lessons from cab drivers. Q. J. Econ. 2015, 130, 1975–2026.Andrade, R.; Alves, A.; Bento, C. POI Mining for Land Use Classification: A Case Study. ISPRS Int. J. Geo-Inf. 2020, 9, 493.
- Zeng, W.; Fu, C.; Müller Arisona, S.; Schubiger, S.; Burkhard, R.; Ma, K. Visualizing the Relationship Between Human Mobility and Points of Interest. IEEE Trans. Intell. Transp. Syst. 2017, 18, 2271–2284.