Your browser does not fully support modern features. Please upgrade for a smoother experience.
Please note this is a comparison between Version 1 by Aurelia Rybak and Version 2 by Rita Xu.
The environmental tax is designed to motivate companies and citizens to seek solutions that limit the negative aspects of running a business. Environmental taxes or ecological taxes are defined in various ways. They can be defined as a non-returnable payment to the state that is levied on the object of taxation. The functions to be fulfilled by the environmental tax can be divided into three categories, i.e., redistributive, incentive, and fiscal. Redistribution consists of the division of the obtained funds and their allocation, for example, to environmental funds. The fiscal function allows the accumulation of funds for the state budget.
- environmental taxes
- greenhouse gas emissions
1. Introduction
Sustainable development is one of the most important issues shaping the policy of the European Union. It influences economic growth while ensuring the well-being of citizens and caring for the natural environment. Sustainable development is to be achieved through the achievement of 17 goals, which were characterized in the document The 2030 Agenda for Sustainable Development [1]. One of the incentives to accelerate the achievement of the goals in the field of environmental protection are environmental taxes, the idea of which was initiated at the beginning of the 20th century [2][3][4][2,3,4]. S. Ison, S. Peake, and S. Wall define them as taxes on environmentally harmful goods or services or on inputs used in the production of those goods or services [5][6]. EU countries carry out activities for the protection of the environment, including the use of tax tools, and Nordic countries were one of the first to apply environmental taxes [6][7][8][9][7,8,9,10]. The greatest challenge related to environmental taxes was to establish a methodology for their determination that would allow for the comparison of taxes paid in the individual Member States. This methodology was determined by Eurostat [10][11]. It defines which taxes can be classified as environmental categories and divides them into four basic categories: energy taxes, transport taxes, resources taxes, and pollution taxes. In order to be able to compare taxes between individual EU member states, a list of tax bases was created. Therefore, those of the taxes whose tax bases are listed below constitute environmental taxes:
-
Energy
- ➢
-
Energy products for transport purposes
- ▪
-
Unleaded petrol
- ▪
-
Leaded petrol
- ▪
-
Diesel
- ▪
-
Other energy products for transport purposes (e.g., LPG, natural gas, kerosene, or fuel oil)
- ➢
-
Energy products for stationary purposes
- ▪
On the other hand, the stimulus function consists of motivating entities to the rational and economic management of resources. Taxes also make it possible to analyze resource consumption in a given country. In the present research, environmental taxes selected by Eurostat were taken into account. The analysis was carried out for available observations, that is, 2011–2019. The authors of the publication examined the relationship between environmental taxes and the level of greenhouse gas emissions. The data used to perform the presented analyzes are presented in Table 1.
Table 1. Statistical data used during the analysis
| Year | Energy, m. EUR | Transport, m. EUR | Resources, m. EUR | Pollution, m. EUR | CO | 2 | Emission, Mg | CH | 4 | Emission, Mg |
|---|
- Light fuel oil
- ▪
- Heavy fuel oil
- ▪
- Natural gas
- ▪
-
Coal
- ▪
-
Coke
- ▪
-
Biofuels
- ▪
-
Electricity consumption and production
- ▪
-
District heat consumption and production
- ▪
-
Other energy products for stationary use
- ➢
-
Greenhouse gases
- ▪
-
Carbon content of fuels
- ▪
-
Emissions of greenhouse gases (including proceeds from emission permits recorded as taxes in the national accounts)
- ▪
-
Motor vehicles import or sale (one-off taxes)
- ▪
-
Registration or use of motor vehicles, recurrent (e.g., yearly taxes)
- Transport (excluding fuel for transport)
- ➢
-
Congestion charges and city tolls (if taxes in national accounts)
- ➢
| Poland |
- Other means of transport (ships, airplanes, railways, etc.
- ➢
- Flights and flight ticket
- ➢
-
Vehicle insurance (excludes general insurance taxes)
| 2011 | 8476 | 719 | 35 | 773 | 297,220,968 | 1,849,092 |
| 2012 | 8638 | 730 | 34 | 654 | 288,191,120 | 1,833,100 |
| 2013 | 8400 | 763 | 27 | 312 | 284,535,011 | 1,841,988 |
| 2014 | 9108 | 829 | 37 | 588 | 276,132,133 | 1,826,838 |
| 2015 | 9765 | 912 | 28 | 697 | 278,910,061 | 1,847,096 |
| 2016 | 9996 | 966 | 22 | 573 | 288,188,837 | 1,814,801 |
| 2017 | 10,889 | 1064 | 11 | 549 | 301,699,215 | 1,812,003 |
| 2018 | 11,789 | 1147 | 12 | 526 | 303,094,745 | 1,794,367 |
| 2019 | 12,312 | 1185 | 11 | 561 | 290,481,854 | 1,712,479 |
| Sweden | ||||||
| 2011 | 7734 | 1741 | 18 | 126 | 297,220,968 | 1,849,092 |
| 2012 | 8013 | 1793 | 19 | 114 | 288,191,120 | 1,833,100 |
| 2013 | 7944 | 1907 | 17 | 102 | 284,535,011 | 1,841,988 |
| 2014 | 7310 | 1847 | 15 | 105 | 276,132,133 | 1,826,838 |
| 2015 | 7426 | 2005 | 16 | 112 | 278,910,061 | 1,847,096 |
| 2016 | 7774 | 2080 | 17 | 111 | 288,188,837 | 1,814,801 |
| 2017 | 7604 | 2068 | 17 | 176 | 301,699,215 | 1,812,003 |
| 2018 | 7136 | 2057 | 14 | 234 | 303,094,745 | 1,794,367 |
| 2019 | 7163 | 2119 | 13 | 239 | 290,481,854 | 1,712,479 |
- Pollution
-
- ➢
-
Measured or estimated emissions to air
- ▪
-
Measured or estimated NOx emissions
- ▪
-
Measured or estimated SOx emissions
- ▪
-
Other measured or estimated emissions to air (excluding CO2)
- ➢
-
Ozone-depleting substances (e.g., CFCs or halons)
- ➢
-
Measured or estimated effluents to water
- ▪
-
Measured or estimated effluents of oxydizable matter (BOD, COD)
- ▪
-
Other measured or estimated effluents to water
- ▪
-
Effluent collection and treatment, fixed annual taxes
- ➢
-
Non-point sources of water pollution
- ▪
-
Pesticides (based on, e.g., chemical content, price, or volume)
- ▪
-
Manure
- ▪
-
Artificial fertilizers (based on, e.g., phosphorus or nitrogen content or price)
- ➢
-
Waste management
- ▪
-
Collection, treatment, or disposal
- ▪
-
Individual products (e.g., packaging, beverage containers, batteries, tires, lubricants)
- ▪
-
Noise (e.g., aircraft take-off and landings)
-
Resources
- ➢
-
Water abstraction
- ➢
-
Harvesting of biological resources (e.g., timber, hunted and fished species)
- ➢
-
Extraction of raw materials (e.g., minerals, oil, and gas)
- ➢
2. Environmental Taxes
Environmental taxes are fees for using the resources of the natural environment. Environmental taxes are those for which the tax base is a physical unit (or a substitute for a physical unit) of a good that has a proven, specific, negative impact on the environment [12][13]. They are an addition to the prices of products whose use has a negative impact on the environment. The fee in this form allows for a financial burden on products that are used on a large scale by citizens in a dispersed manner [13][14]. An example of an environmental tax is the carbon tax. It is applied to fuels in proportion to the greenhouse gas emissions produced by their combustion [
It was assumed that environmental taxes have a positive effect on the level of emissions. To verify the hypothesis, environmental taxes were introduced to the multiple regression model as explanatory variables. The dependent variable, on the other hand, was the amount of greenhouse gas emissions. The research was carried out for Poland and, for comparison, for Sweden (a representative of the Nordic countries, which has significantly reduced greenhouse gas emissions since 2000).
The group of taxes that bring the highest revenues to the state treasury, both in Poland and Sweden, are taxes placed in the energy category (Figure 1). For the energy category, due to the differences in the orders of magnitude, an auxiliary axis (in navy blue) was introduced. They constitute approximately 88% of all environmental taxes in Poland. However, in Sweden, it is about 75%. The amount of taxes in Poland grew, and in the analyzed period, it increased by 45%. In Sweden, on the other hand, it decreased by 8%. The second significant group are taxes from the transport category. In this case, no significant changes in the amount of taxes were observed in 2011–2019. In Poland, the share of taxes placed in the transport category is around 8% throughout the analyzed period, while in Sweden, it is twice as high (20%).
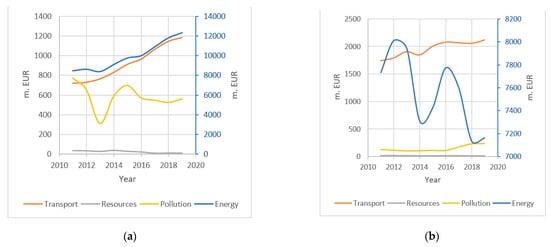
Figure 1. Environmental taxes in Poland (a) and Sweden (b) in 2011–2019 (right axis for the energy category). Source: own elaboration.
Greenhouse Gas Emissions
Greenhouse gases are gaseous components of the atmosphere, both natural and anthropogenic, which absorb and re-emit infrared radiation [18][19]. Greenhouse gases include carbon dioxide (CO2), methane (CH4), nitrous oxide (N2O), fluorocarbons (HFCs), perfluorocarbon compounds (PFCs), and sulfur hexafluoride (SF6). Excessive greenhouse gas emissions lead to the greenhouse effect. The NASA Earth Observatory definition says that global warming is an unusually rapid increase in the average surface temperature of the Earth over the past century. The temperature rises as a result of the release of greenhouse gases during the combustion of fossil fuels. The mean global surface temperature increased by 0.6–0.9 °C between 1906 and 2005, and the rate of increase in temperature has almost doubled in the last 50 years [19][20]. Individual gases have a different degree of influence on the greenhouse effect. Therefore, the presented research focuses on carbon dioxide and methane. CO2 is the most abundant greenhouse gas. On the other hand, the negative impact of methane on the natural environment is much greater than that of other greenhouse gases.
In 2019, CO2 emissions accounted for approximately 80% of total emissions [10][11]. Carbon dioxide is produced during the combustion of fossil fuels, mainly in the transport, energy, construction, and oil industries [20][21][21,22]. Figure 2 presents a choropleth map of the CO2 emissions of the 27 EU member states in 2019. The map was created with the use of the Quantum GIS 3.16.13 spatial information system [22][23]. It should be noted that the highest level of emissions occurs in Germany, amounting to 567 million Mg CO2. Poland was classified as the second separated group in terms of the amount of CO2 emissions, while Sweden was placed in category 1 because the amount of emissions in Sweden is 7 times lower than in Poland and 15 times lower than in Germany. The lowest emission level among the EU-27 countries has been observed in Malta.
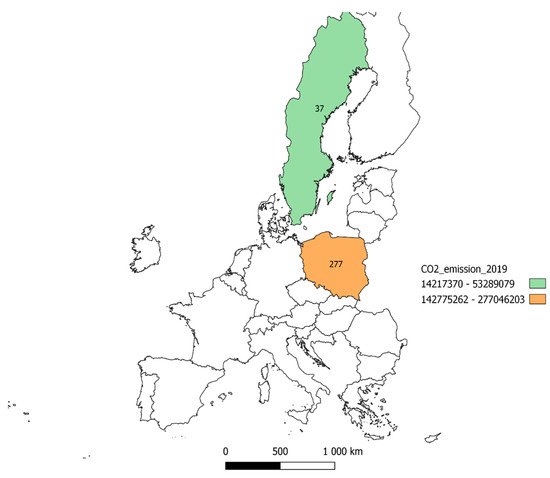
Figure 2. The 2019 CO2 emissions in Poland and Sweden (m. Mg). Source: own elaboration.
As previously mentioned, carbon dioxide is widely recognized as the main cause of global warming. The reason for this is the share of CO2 in total greenhouse gas emissions. However, the gas that is many times more harmful is methane [23][24]. Despite the fact that methane disappears relatively quickly from the atmosphere after about 15 years (especially compared to CO2, which can remain in the atmosphere even for thousands of years), it is several dozen times more harmful [24][25][26][25,26,27]. Methane pollutes the air and destroys the ozone layer. CH4 is the basic component of natural gas, as well as biomethane. It is also released into the atmosphere during the exploitation of crude oil and coal. In Poland, the country that is the largest coal producer in Europe, methane emissions during fuel exploitation accounted for 40% of the total CH4 emissions in 2019. Methane is also produced in landfills. However, it is produced most of all in agriculture, where the average share of the EU-27 is 56% of agriculture in total CH4 emissions. The highest share of agriculture in CH4 emissions occurs in Ireland, where it was 94% in 2019.
In the case of emissions generated in the mining industry or waste management, there are methods that allow for their reduction [27][28][28,29]. However, in agriculture, it is extremely difficult. Methane is produced by farm animals, and the only effective preventive measure, in this case, would be to eliminate meat consumption. This, in turn, is impossible due to the composition of the human diet, in which meat is a very important component.
The highest level of CH4 emissions occurs again in Germany, and it amounts to 14 million Mg. Malta has the lowest CH4 emissions. In Poland, CH4 emissions in 2019 amounted to 1.6 million Mg, which is almost 10 times higher than in Sweden (Figure 3).
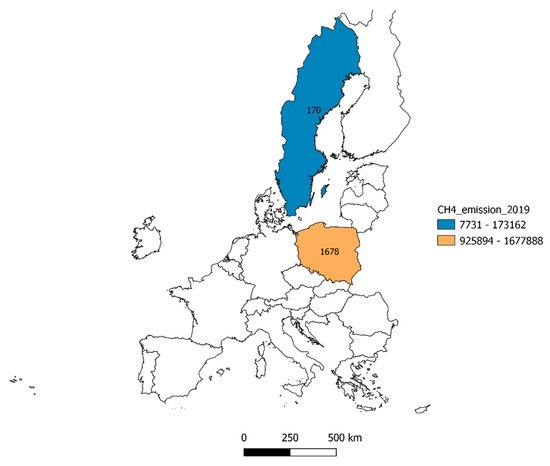
Figure 3. Methane emissions in Poland and Sweden, 2019 (1000 Mg). Source: own elaboration.
However, it should be noted that the level of greenhouse gas emissions is strongly related to the number of given country inhabitants. Taking this factor into account, an analysis of CO2 and CH4 emissions per capita was performed. In this case, CO2 emission is still one of the lowest in Sweden (about 4 Mg per capita), while the highest occurs in Luxembourg and amounts to about 12 Mg per capita. In Poland, it is about 7 Mg per capita. In turn, CH4 is emitted in the highest amounts in Ireland (0.11 Mg per capita) and the lowest in Bulgaria and Sweden (0.02 Mg per capita). In Poland, it is 0.05 Mg/capita (Figure 4).
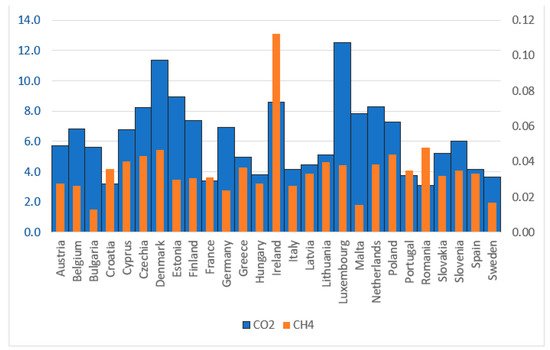
Figure 4. The volume of CO2 and CH4 emissions in Mg per capita in 2019. Source: own elaboration.
CH4 and CO2 emissions in Sweden are lower than in Poland, also taking into account the population in both countries. Sweden is one of the leaders among countries that effectively reduce greenhouse gas emissions and apply environmental taxes. Therefore, it was this country that was chosen as the benchmark for the results observed in Poland.