Your browser does not fully support modern features. Please upgrade for a smoother experience.
Please note this is a comparison between Version 1 by Rome-Ming Wu and Version 2 by Lindsay Dong.
The main pollutants in car wash wastewater are detergents, dirt, oil, and grease. Untreated wastewater released into rainwater sewer systems or other water bodies may pollute the water and generate excessive bubble foams, which negatively affects urban appearance. Car washes are divided into mechanical car washes and manual or self-service car washes. In general, car washes have a small operation and scale, occupy limited land, and cannot afford wastewater treatment costs. Therefore, most car washes are not equipped with wastewater treatment facilities. Consequently, the discharge of wastewater from car washes negatively affects the water quality in the surrounding environment and results in wasteful use of water resources.
- carwash
- wastewater
1. Introduction
The rapid growth in human population has resulted in increased car use, which has increased the demand for car wash services and thereby generated large amounts of car wash wastewater. In metropolitan areas, the foam in the wastewater produced during car washing overflows and spoils the appearance of the city. However, compared with industrial wastewater it is relatively easy to treat car wash wastewater and improve its water quality.
Car wash wastewater generally contains suspended particles that originate from the dirt on vehicles, the oil on vehicle exteriors, the oil and grease generated from car wax, and the anionic surfactants caused by detergent use [1][2][5,6]. This wastewater has a high COD.
A reasonable amount of water for washing a car is 100~200 L. Several studies have collected data on car wash wastewater for unique vehicles. The car wash water consumption for heavy vehicles and waste container washing vehicles was recorded as approximately 350~900 L and 5000 L, respectively [3][4][12,22].
2. Car Wash Wastewater Treatment Technique
2.1. Electrocoagulation (EC)
4.1. Electrocoagulation (EC)
Figure 12 depicts the general mechanism of the electrocoagulation process. EC uses metal hydroxides produced by electrolysis to remove pollutants in wastewater. During the electrolysis reaction, a sacrificial anode undergoes an oxidation reaction to release metal ions, while the cathode undergoes a reduction reaction to reduce the metal ions to metal and generate hydrogen. Commonly used metal anodes include aluminum and iron. The EC process has a turbidity removal rate of approximately 90% [5][6][7][8,9,25]. When coupled with adsorption treatment or electro-oxidation treatment, the turbidity removal rate of the EC process can be increased. Moreover, the EC process has a COD removal rate of approximately 80%. When combined with other treatments, the COD removal rate of the EC process can be increased (Table 12).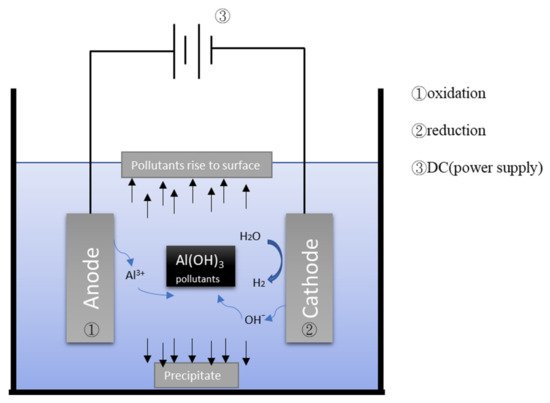
Figure 12.
Schematic illustration of electrocoagulation/flotation.
Table 12.
Removal rate of various water qualities by EC method.
| Country | Area | Ref. | Technique | SS (mg/L) |
Turbidity (NTU) |
COD (mg/L) |
O&G (mg/L) |
AS (mg/L) |
|
|---|---|---|---|---|---|---|---|---|---|
| Mexico | Toluca | [5] | [8] | EC + AD | — | 92~98% | 78~94% | — | — |
| Istanbul | |||||||||
| [ | |||||||||
| 13 | |||||||||
| ] | |||||||||
| [ | |||||||||
| 34 | |||||||||
| ] | EC | — | — | 88% | 82% | 99% | |||
| Turkey | Tekirdag | [14] | [33] | EC | — | 99% | 76% | — | — |
| China | Zhenjiang | [15] | [46] | EC + Ultrasound | — | 96% | 69% | — | — |
2.2. Flocculation–Flotation (FF)
4.2. Flocculation–Flotation (FF)
Figure 23 presents the mechanism and process of flocculation–flotation (FF). FF combines polymer flocculant addition and air bubble flotation to separate pollutants in carwash wastewater. The SS and turbidity removal rates of the FF process are approximately 85% and 90%, respectively [16][17][10,17]. When coupled with other treatments, the SS and turbidity removal rates of this process can reach as high as 96% [18][19][11,14]. The FF process has a COD removal rate of approximately 70~80%, which can be increased when this process is coupled with other treatments. Thus, the FF process exhibits a turbidity and COD removal performance comparable to that of the EC process (Table 23).
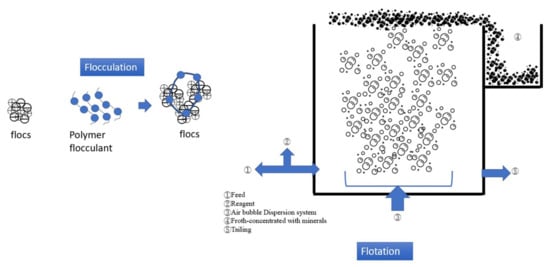
Figure 23.
Schematic illustration of flocculation–flotation.
Table 23.
Removal rate of various water qualities by flocculation–flotation method.
| Country | Area | Ref. | Technique | SS (mg/L) |
Turbidity (NTU) |
COD (mg/L) |
O&G (mg/L) |
AS (mg/L) |
|---|---|---|---|---|---|---|---|---|
| Brazil | Porto Alegre | [17] | FF + O | 83–99% | 89–95% 93–98% | 39–85% 81–99% | — | 78–89% 81–99% |
| Mexico | Toluca | [6] | [9] | EC + EO | — | 98~98.4% | ||
| Brazil | 76~96% | Porto Alegre | [16] | [10 | 92~100% | ] | FF | 81~92% |
| — | 91-96% | — |
2.3. Filtration (F)
4.3. Filtration (F)
In recent years, filtration has become an excellent method for solid–liquid separation [22][73], and membrane filtration has especially been used in many fields, for example mineral processing [23][74], removing surfactants [24][75], suspension filtration [25][76], and more. Figure 34 illustrates the mechanism of filtration
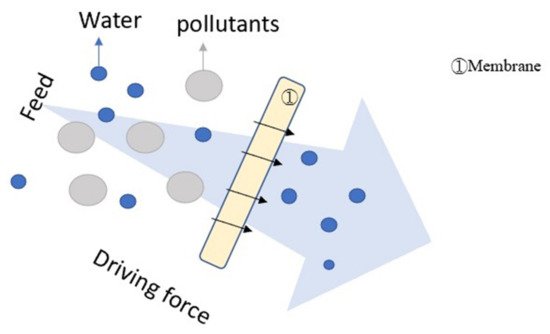
Figure 34.
Illustration of filtration.
When the filter element has sufficient selectivity, the flocculation–filtration process can achieve SS and turbidity removal rates over 99%, as presented in [26][27][51,55]. However, the filtrate flux of flocculation–ultrafiltration and flocculation–nanofiltration are only approximately 50 and 10 LMH (L/m2-h), respectively. To provide wastewater treatment for the medium-scale car wash factory discussed in [28][18], an ultrafiltration plant with a size of approximately 100 m2 would be required. Such a plant would occupy a large space, and would thus be unsuitable for highly developed urban areas. Despite being able to remove partial COD, the general COD removal rate of the flocculation–filtration process is approximately 60% (Table 23).
The coagulation–filtration process has turbidity and COD removal rates of approximately 90% and 60%, respectively (Table 34).
Table 34.
Removal rate of various water qualities by filtration.
| Country | Area | Ref. | Technique | SS |
|---|
2.4. Coagulation–Flocculation (CF)
4.4. Coagulation–Flocculation (CF)
Figure 45 depicts the processes of coagulation–flocculation (CF), which is a two-stage reaction system. In coagulation, a coagulant such as polyaluminum chloride (PAC) or ferric chloride is added to the wastewater to modify the surface charge of the particle pollutants, thereby eliminating the electrostatic repulsion between the particles was. The flocculant (i.e., polymer) is then added to the wastewater to aggregate the near-neutral electrostatic particles and form flocs for easier pollutant removal. Generally speaking, the turbidity removal rate of CF with car wash wastewater is good, generally over 90%; however, the removal rates of COD, O&G, and AS are not as good [4][39][22,41]. In addition, CF needs to add a suitable flocculant, which can easily cause cost increases and secondary pollution. Table 45 lists the effects of using CF and its combinations on car wash wastewater treatment as found in the literature.
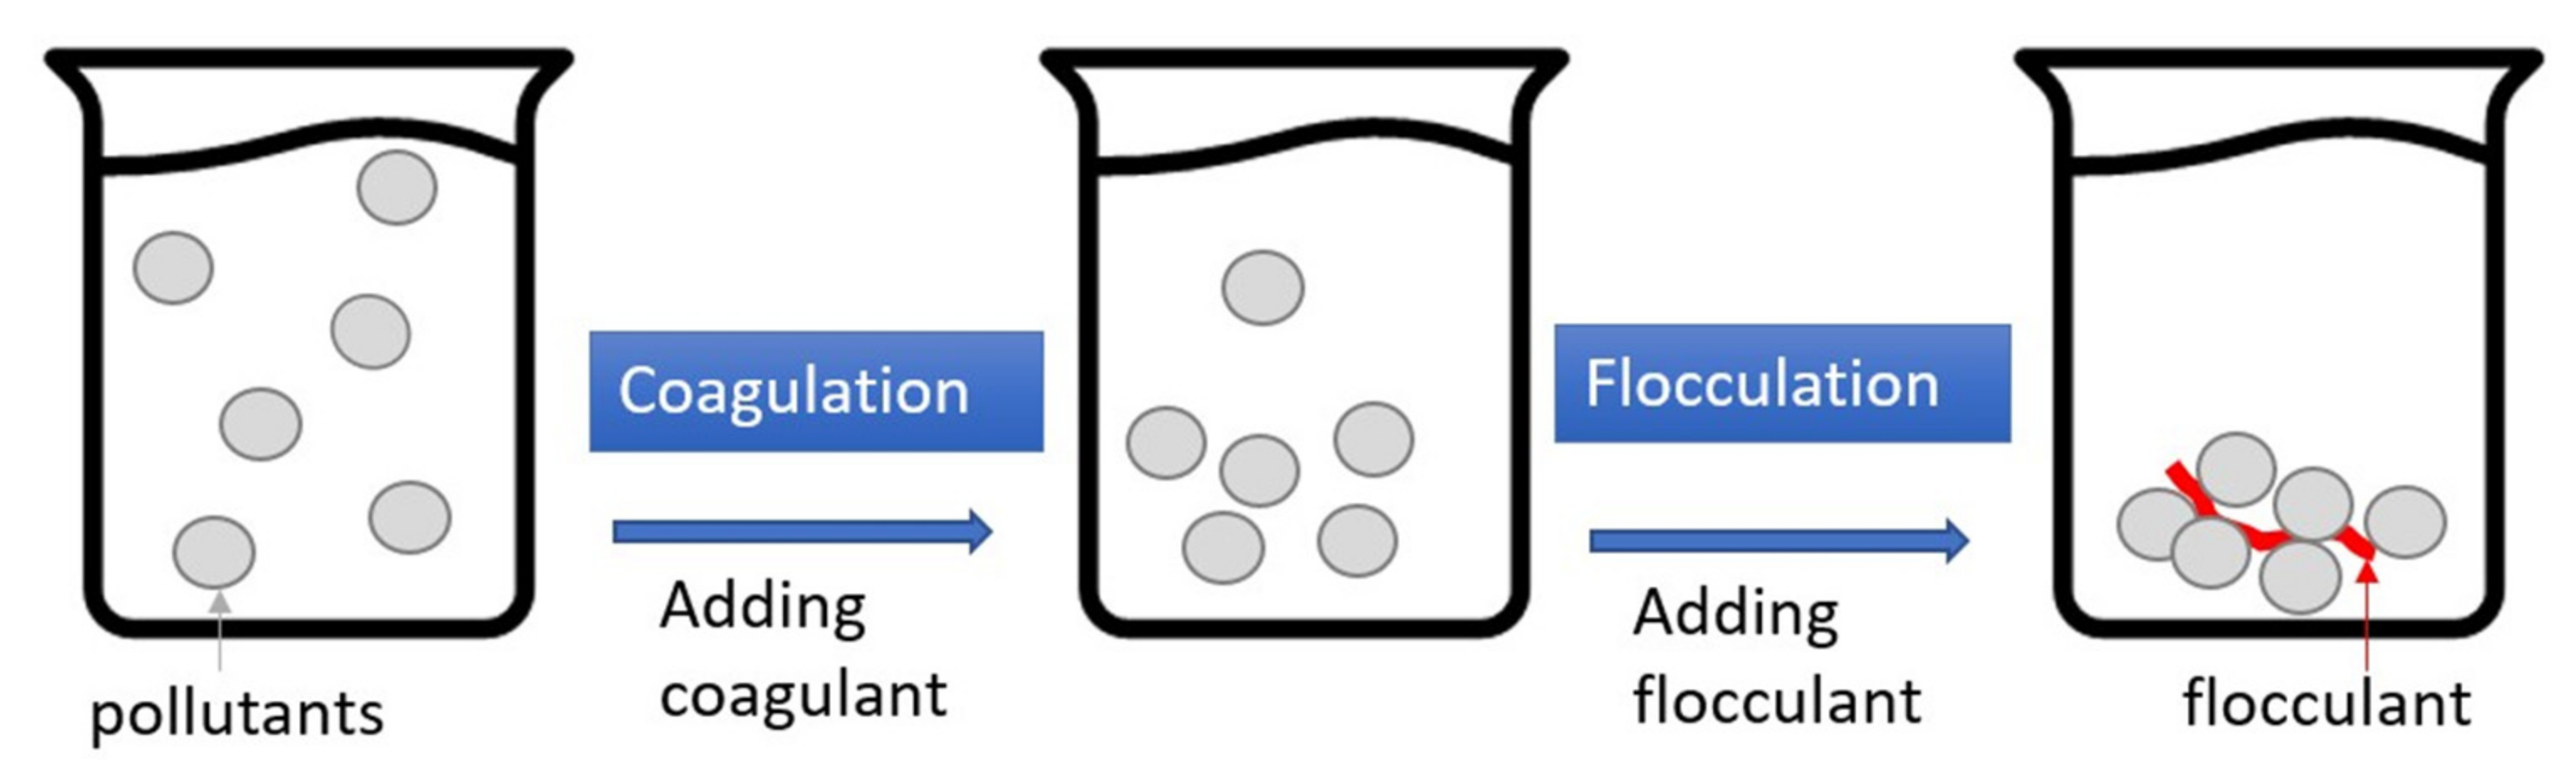
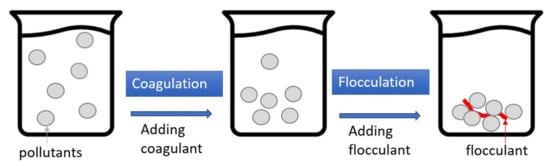
Figure 45.
Schematic illustration of coagulation–flocculation (CF).
Table 45.
Removal rate of various water qualities by coagulation–flocculation.
| Country | (mg/L) | Area | Turbidity | (NTU) | Ref. | Technique | SS (mg/L) |
Turbidity (NTU)COD (mg/L) |
O&G (mg/L) |
AS (mg/L) |
|||||||||||||
|---|---|---|---|---|---|---|---|---|---|---|---|---|---|---|---|---|---|---|---|---|---|---|---|
| COD | (mg/L) | O&G | (mg/L) | AS | (mg/L) | ||||||||||||||||||
| Belgium | Leuven | [28] | [18] | UF + NF | — | — | |||||||||||||||||
| Italy | Brescia | [4] | [22] | 60~95% | — | 88~95% | |||||||||||||||||
| CF | — | 98% | 74% | — | — | — | 40% | Sweden | — | [29] | [77] | ||||||||||||
| Italy | Genoa | [8] | |||||||||||||||||||||
| UF | — | — | 60% | — | — | Brazil[21] | EC + EO | — | Sao Paulo— | [18 | 75~97% | ] | [11— | ] | FF + SF— | ||||||||
| — | 87–91% | — | — | — | |||||||||||||||||||
| Turkey | Iran | ||||||||||||||||||||||
| Istanbul | [ | 13] | [34] | EC + NF | 99% | — | 88% | 90% | 91% | ||||||||||||||
| Malaysia | Johor, Skudai | [30] | [40 | ||||||||||||||||||||
| Iran | Zahedan | [40] | [35] | C | 37% | — | 44% | — | 76% | Brazil | |||||||||||||
| Egypt | Elminia | [41] | [26] | CF + SF + O + SF | — | 100% | 88%Tehran | Porto Alegre | [9] | [36] | EC | — | 85.5% | 80.8% | — | — | |||||||
| [ | 20 | ] | [13] | FF | 89% | 93% | 11% | — | ] | UF + NF— | — | — | 55~92% | Iran | Tehran | [10] | [38] | EC | — | — | 88% | — | — |
| — | — | Brazil | Porto Alegre | [19] | [14] | FF + SC | 91–93% | 91–96% | |||||||||||||||
| Brazil | Belo Horizonte | [31] | [16] | MF + UF | — | 96.2~99.3%97% | 93% | 96% | — |
Note: Chemical coagulation (C), membrane filtration (M).
2.5. Bio-Treatment
4.5. Bio-Treatment
Figure 56 illustrates the mechanism of bio-treatment. Aerobic microorganisms in the wastewater degrade the organics into H2O and CO2, while the dead biomass of microorganisms forms a sludge in the wastewater. Table 56 lists the effects of biological treatment combined with other technologies on car wash wastewater treatment. For biological treatment followed by filtration treatment, the removal rate of turbidity, COD, and AS can reach more than 95% [3][48][49][50][2,12,48,49].
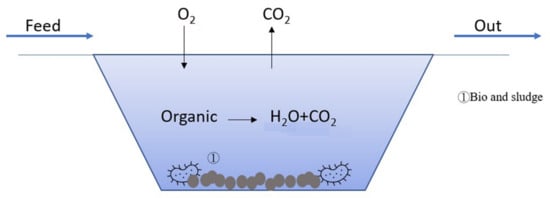
Figure 56.
Illustration of bio-treatment.
Table 56.
Removal rate of various water qualities by bio-treatment.
| Country | Area | Ref. | Technique | SS (mg/L) |
Turbidity (NTU) |
COD (mg/L) |
O&G (mg/L) |
AS (mg/L) |
|
|---|---|---|---|---|---|---|---|---|---|
| Brazil | Sao Paulo | [3] | [12] | RBC + F | — | 72~97% | 56~94% | — | — |
| USA | New Jersey | [48] | |||||||
| Hsinchu | [ | 51] | [53] | Bio + M | |||||
| 63–76% | |||||||||
| — | — | 81~85% | — |
2.6. Other Methods
4.6. Other Methods
A few other single treatment methods, such as the Photo-Fenton’s process [52][24], adsorption [53][30], electro-oxidation [54][15], etc., are listed in the table below (Table 67). Except for electro-oxidation, these single-unit processing technologies have a removal rate of less than 90%.
Table 67.
Removal rate of various water qualities by other single unit treatment techniques.
| Country | Area | Ref. | Technique | SS (mg/L) |
Turbidity (NTU) |
COD (mg/L) |
O&G (mg/L) |
AS (mg/L) |
|||||||||||||||||
|---|---|---|---|---|---|---|---|---|---|---|---|---|---|---|---|---|---|---|---|---|---|---|---|---|---|
| Egypt | South of Egypt | [52 | 24] | Photo-Fenton’s process | — | — | 82~93.4% | — | — | ||||||||||||||||
| [ | 2 | ] | four bioretention mesocosms | 84~95% | — | — | |||||||||||||||||||
| 95.7% | |||||||||||||||||||||||||
| Syria | — | 70.2% | — | — | |||||||||||||||||||||
| ] | [ | Aleppo | [53] | [30 | — | 89~96% | |||||||||||||||||||
| ] | AD | — | — | 81.6% | 86.8% | 88.3% | Taiwan | ||||||||||||||||||
| Brazil | Natal | [54] | [15] | EO | — | — | 96% | — | 83~96% | Malaysia | Parit Raja, Johor | [39] | [41] | CF | — | 97% | 35% | — | — | ||||||
| Australia | Geelong | [49] | [48] | C + MBR | 99.8% | 99.6% | — | — | — | — | Malaysia | Parit Raja | [42] | C | — | 94% | |||||||||
| Australia | Melbourne | [50] | [49 | 60% | — | — | |||||||||||||||||||
| ] | enhanced MBR (eMBR) | — | 99.9% | 99.8% | 5.9~6.7 LMH | — | Iran | Ahvaz | [11] | [37] | EC | — | — | ||||||||||||
| Pakistan | 90% | Hyderabad, Sindh | [21] | ||||||||||||||||||||||
| Turkey | [ | 52 | Istanbul | [32] | [31] | UF + NF | —— | ] | DAF + F— | ||||||||||||||||
| — | 97% | — | — | Negligible~97% | — | — | Malaysia | Taman University | [43] | C | — | 90% | 60% | — | — | USA | Texas | [12] | [7] | EC | — | — | 79% | — | — |
| 99% | — | ||||||||||||||||||||||||
| Indonesia | Semarang | [27] | [55] | UF | — | 100% | 91% | 83% | — | ||||||||||||||||
| China | Shenyang | [44] | C + UF | — | Egypt | Shatby | [7] | [25] | EC | — | ~87% | ~85% | — | — | |||||||||||
| Turkey |
Note: sand filtration (SF), ozonation (O), sand filtration and chlorination (SC), Filtration (F), Dissolved Air Flotation (DAF).
| 94% | ||||||||||||||||||||
| — | ||||||||||||||||||||
| >40% | ||||||||||||||||||||
| — | ||||||||||||||||||||
| Japan | Tokyo | [33] | [78] | |||||||||||||||||
| China | Shanghai | [45 | F + UF | — | — | |||||||||||||||
| — | — | ] | — | [79] | C + M75% | — | 70%50~90% | — | — | — | China | Shanghai | [34] | [45] | C + UF | — | 85% | 80% | — | |
| India | Bangalore | [46] | [56] | CF + F | — | — | 80–90% | 92–93% | — | Vietnam | Hanoi | [35] | [39] | |||||||
| Pakistan | MBR + F | — | — | Abbottabad | [47] | [50]90% | 88% | — | ||||||||||||
| C + H | 2 | O | 2 | — | Australia | Melbourne | [36] | [47] | UF + RO | 100% | 99.9% | 96% | — | — | ||||||
| Pakistan | Peshawar | [26] | [51] | SED + F | 80% | 99% | — | 49.2% | ||||||||||||
| India | Aligarh | [37] | [57] | SF | 89.2% | — | 83.5% | — | — | |||||||||||
| India | Trichy | [38] | [58] | UF | — | 82% | 47–60% | — | — |
Note: ultrafiltration (UF), nanofiltration (NF), microfiltration (MF), coagulation (C), sand filtration (SF), sedimentation (SED), reverse osmosis (RO), filtration (F).
Rotating Biological Contactor (RBC).