Galectin-16 Gene in Human Cells and Tissues: Comparison
Please note this is a comparison between Version 2 by Amina Yu and Version 1 by Alexander Timoshenko.

Galectins are soluble β-galactoside binding proteins, which are involved in regulation of multiple cellular processes including cell growth, differentiation, apoptosis, and immune responses. Sixteen galectin genes have been identified in animals, 12 of which are expressed in humans. Out of all galectins, galectin-16 is poorly characterized yet and current knowledge suggest that this is a tissue-specific gene with functions and expression limited to placenta and brain among others.

  • galectin
  • LGALS16
  • placenta
  • brain tissues
  • cell differentiation
  • transcription factor
  • miRNA

1. Molecular Characteristics of Galectin-16 Gene and Recombinant Protein

The LGALS16 gene structure and molecular details were described by Than and co-authors [1]. LGALS16 (4735 bp) is located on chromosomal band 19q13.2, spans from bases 39,655,913 to 39,660,647, and contains 4 exons (Figure 1a,b). LGALS16 is found only in primates and is part of the chromosome 19 gene cluster containing four protein-coding genes (LGALS10, LGALS13, LGALS14, LGALS16) [1][2][3][4]. The diversification and evolutionary origin of this cluster, including LGALS16, is thought to be related to placenta development and mediated by transposable long interspersed nuclear elements (LINEs), which are commonly found at the boundaries of large inversions and gene duplication units [1][5][6]. The relevant rearrangements and subsequent gains and losses of duplicated genes and pseudogenes are proposed to have enabled anthropoids to sustain highly invasive placentation and placental phenotypes, such as longer gestation for larger offspring and an increased body to brain size ratio [1].

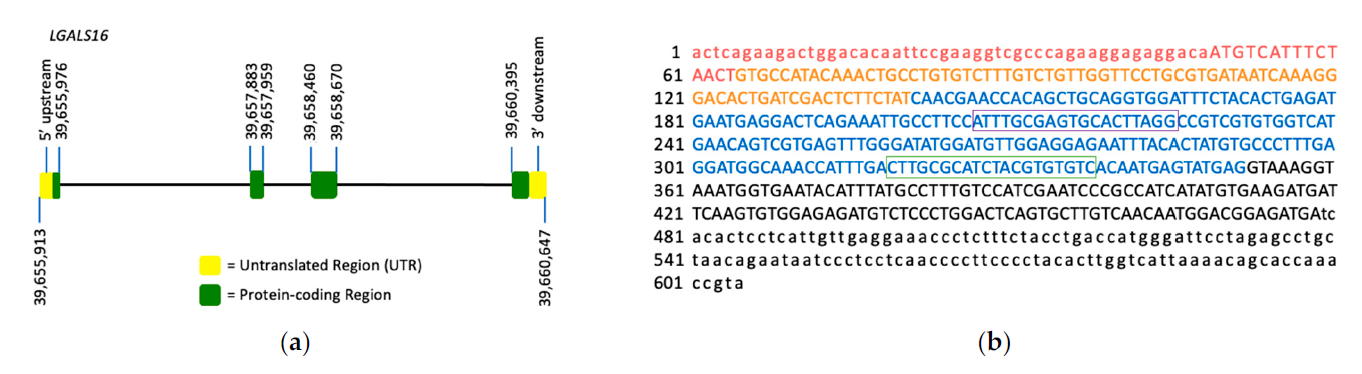
Figure 1. LGALS16 gene structure and the mRNA sequence. (a) LGALS16 (4,735 bp) is located on chromosomal band 19q13.2 and contains 4 exons (ENSG00000249861). (b) NCBI reference sequence of LGASL16 mRNA (NM_001190441.3). Each exon is highlighted with red, orange, blue, and black representing exons 1, 2, 3, and 4, respectively. The protein coding sequence (CDS) is indicated in capitals while UTRs in small characters. The oligonucleotide sequences for PCR amplification are boxed.

To the best of ourthe knowledge, no studiesone are available on native galectin-16 at the protein level whereas recombinant protein has been produced and tested. The crystal structure of recombinant galectin-16 and its mutants was solved by Si and co-authors [7]. Recombinant galectin-16 is a monomeric protein, which is composed of 142 amino acids and has a typical galectin structure of the CRD β-sandwich with two sheets formed by six β-strands on the concave side (S1–S6) and five β-strands on the convex side (F1–F5) (Figure 2). This group also showed that galectin-16 lacks lactose-binding ability unless arginine (Arg55) is replaced with asparagine in S4 β-strand. In comparison, an earlier roneport was showed that recombinant galectin-16 and two other human galectins (galectin-13 and galectin-14) can bind lactose–agarose beads and are efficiently and competitively eluted by lactose [1]. More insights into this discrepancy are required considering multiple interfering factors, mutations/replacements of amino acids within the CRD, and different study designs. Regardless, both glycan-dependent and glycan-independent interactions might be essential for galectin-16 similar to other galectins [8].
Figure 2. Protein sequence and structure of recombinant galectin-16. (a) The 142 amino acid sequence is 16.6 kDa for the galectin-16 protein. Each color corresponds to the exon from which the amino acids were encoded with red, orange, blue, and black representing exons 1, 2, 3, and 4, respectively. The anti-parallel β-sheets of F-face (F1–F5) and S-face (S1–S6) strands as well as a short α-helix are showed. (b) The crystal structure was extracted from Protein Data Bank (available online: rcsb.org, accessed on 6 September 2021), PDB ID: 6LJP.

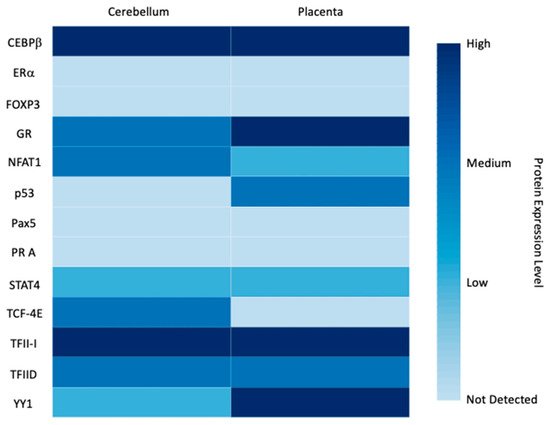
2. Expression Patterns and Functions of LGALS16 in Cells and Tissues

Experimental onestudie was focusing on LGALS16 are limited and an essential source of relevant information about this gene is Gene Expression Omnibus (GEO), a data repository for microarray and RNA-sequencing data [9]. Overall, 287 datasets are available on GEO (November 2021 search) reporting LGALS16 expression in 52 types of tissues and various cell lines based on the following platforms: Affymetrix Human Genome (n = 27), Affymetrix Human Gene (n = 151), Agilent (n = 31), Human Unigene (n = 1), Illumina Human (n = 82), MCI Human (n = 1), NuGO (n = 1), and Sentrix Human (n = 15). Quantification of differences in LGALS16 expression between different platforms is challenging. However, evaluation of gene expression values within the same GEO datasets demonstrates that LGALS16 can be classified as a gene with relatively low expression in comparison with LGALS1 (a widely expressed galectin with a low tissue specificity) and ACTB (a common housekeeping gene). Indeed, regardless of the platform, average GEO percentile rank of expression for LGALS16 measured with different arrays ranged 4–32% on a scale of 1–100% while the range was 63–100% for LGALS1 and 94–100% for ACTB. Available GEO profiles do not contain relevant datasets with LGALS16 for placenta for comparison, however, the Human Protein Atlas (HPA) reports tissue-specific overexpression of LGALS16 in placenta followed by brain tissues and retina (Figure 3a). The biological meaning and reasons of overexpression of LGALS16 in these diverse tissues is unknown and requires further investigations in the context of developmental biology. For instance, the complex mechanisms of the placenta–brain axis of cell development [10] could be addressed in terms of the unique association of LGALS16 with these tissues.
Figure 3. The normalized expression of LGALS16 mRNA in human tissues and cells from HPA datasets. (a) LGALS16-positive cases out of 55 tissue types; (b) LGALS16-positive cases out of 69 cell lines. The data were retrieved on 28 November 2021.
To develop experimental models for studylearning LGALS16 functions and regulation, it examined the gene expression in BeWo cells and an additional placental cell line JEG-3 in the context of trophoblastic differentiation. The expression of LGALS16 mRNA was significantly increased in both cell lines after 36 h (JEG-3 cells) and 48 h (BeWo cells) treatment with a potent cell-permeable and metabolically stable activator of cAMP-dependent protein kinase 8-Br-cAMP (250 μM), which coincided with upregulation of CGB3/5, genes encoding chorionic gonadotropin subunits 3 and 5 (Figure 4). As chorionic gonadotropin is one of the biomarkers of placenta and trophoblastic differentiation, ourit resultwas suggested that classifying LGALS16 to the same category of biological molecules. Others studieswere also reported significant upregulation of LGALS16 in association with processes of cellular differentiation, even if the basal levels were relatively low. Thus, treatment of BeWo cells with forskolin, an inducer of cyclic adenosine 3′,5′-monophosphate (cAMP), stimulated trophoblastic differentiation and simultaneous LGALS16 overexpression [2]. An interesting example of LGALS16 upregulation was reported in a model of intestinal differentiation of Caco-2 cells induced by a combined treatment with dexamethasone and p44/42 MAPK inhibitor PD98059 [11]. Therefore, LGALS16 may deserve further attention as a factor associated with processes of cellular differentiation and tissue development.
Figure 4. LGALS16 expression in human placental choriocarcinoma cell lines, BeWo and JEG-3. Cells were treated with 8-Br-cAMP (250 μM) for different periods of time to induce syncytiotrophoblast differentiation. (a) BeWo cells (n = 4); (b) JEG-3 cells (n = 3). Agarose gels on the left confirm the expected size of PCR amplicons. Bar graphs show the fold changes in the expression of LGALS16 and CGB3/5 genes obtained by qPCR, which were quantified by the Livak method (2−ΔΔCT) using ACTB as a reference gene. Data are presented as means ± SD; means with the same letter are not significantly different from each other (Tukey’s post hoc HSD test, p > 0.05).
An important function of galectin-16 as well as placental galectin-13 and galectin-14 is the ability to induce apoptosis of CD3+ T cells, which was detected by flow cytometry of cells double-stained with annexin-V-FITC and propidium iodide [1]. Considering the high expression of galectin-16 in differentiated trophoblasts, the apoptotic mechanism might contribute to the immune tolerance at the maternal-fetal interface reducing the danger of maternal immune attacks on the fetus and enabling anthropoid primates to evolve long gestation periods while retaining highly invasive placentation. The details of this regulation are obscure since there are no studies addressing the secretion of galectin-16 from trophoblasts. However, intracellular EGFP-tagged recombinant galectin-16 was readily localized in the nucleus and cytoplasm of transfected cells including, HeLa, 293T, HCT-116, SMMC-7721 and Jurkat cells [7]. In fact, the nuclear staining was much stronger than in the cytoplasm suggesting that the transport of galectin-16 into the nucleus might play a role in regulating intranuclear processes. These authors showed that the binding partner of galectin-16 is c-Rel, a member of the NF-κB family of transcription factors (TFs), which is involved in the regulation of multiple processes such as apoptosis, inflammation, immune responses, tumorigenesis, cell growth and differentiation [7][12]. All NF-κB family members, including c-Rel, have a conserved N-terminal DNA-binding/dimerization domain, known as the Rel homology domain (RHD) [13]. Recombinant galectin-16 strongly binds to the RHD which might inhibit c-Rel and prevent activation of anti-apoptotic genes, such as Bcl-2 and Bcl-xL, promoting T-cell apoptosis during pregnancy [7]. An additional aspect of LGALS16 functions may contribute to the rescue of glucose restriction-induced cell death in a model of a whole genome gain-of-function CRISPR activation using human mitochondrial disease complex I mutant cells [14].

3. Transcriptional and Post-Transcriptional Regulation of LGALS16

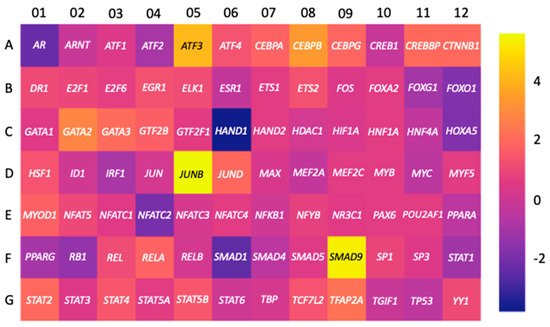
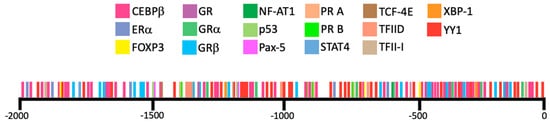
3.1. Transcription Factors
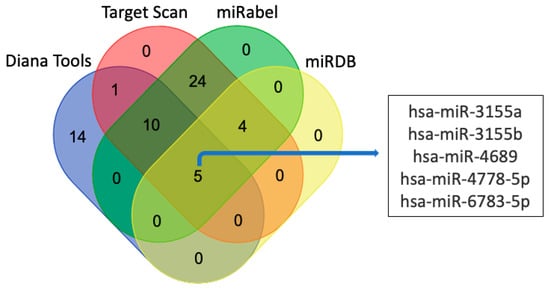
Multiple TFs can be involved in the regulation of LGALS16 expression based on the presence of specific response elements in the promoter regions of the gene. Original analysis of retrotransposons within the 10 kb 5′ UTR by Than and co-authors demonstrated that the LGALS16 promoter has binding sites for GATA2, TEF5, and ESRRG, which are also involved in the regulation of important trophoblast-specific genes such as ERVWE1 (marker of cell fusion), CGA, and CGB3 (markers of chorionic gonadotropin production, a hormone released by differentiated trophoblasts to maintain pregnancy) [2]. The contribution of these TFs in regulating LGALS16 expression was claimed to vary, especially with decreased regulation from GATA2, due to the specific layout and properties of transposable elements (L1PA6 and L1PREC2) within the 5′UTR of this gene as compared to two other placental genes, LGALS13 and LGALS14. Additional shared TFs for the placental galectin gene cluster include TFAP2A and GCM1, which have binding sites within ALU transposable elements next to L1PREC2. Experimental evidence of this regulation was confirmed in a model of forskolin-induced differentiation of primary trophoblasts, which revealed time-dependent upregulation of LGALS16 in parallel with the expression of TEAD3, ESRRG, GCM1, and ERVWE1 [2]. It is interesting to note that ithis study did was not revealed the effect of 5-azacytidin on LGALS16 expression in BeWo trophoblast cells as compared to other upregulated placental galectins, which suggested a minor role of DNA methylation in the context of LGALS16 regulation.
To enrich this analysis, it used human choriocarcinoma cell line JEG-3 and Qiagen RT2 Profiler™ PCR Array to test changes in the mRNA transcript levels of 84 TFs during trophoblastic differentiation induced by 8-Br-cAMP. Overall, 60 TFs were upregulated in this assay including three top genes encoding Jun B proto-oncogene (JUNB), SMAD family member 9 (SMAD9), and activating transcription factor 3 (ATF3) (Figure 5). Since all of these three genes are expressed in placenta and brain tissues [15][16][17][18][19][20], which are LGALS16-positive, this observation provides a new insight into possible transcriptional regulation of this gene. JUNB and ATF3 belong to a family of TFs with a basic leucine zipper DNA binding domain, with JUNB preferentially binding to the 12-O-tetradecanoylphorbol-13-acetate response element sequence and ATF3 binding to the cAMP response element in promoters with the consensus sequence, TGACGTCA [21]. They are subunits of activating protein 1 (AP-1) TFs, which function as homodimers or heterodimers in association with other members of JUN, FOS, ATF, and MAF protein families [21]. JUNB was reported to be directly involved in processes of trophoblastic cell syncytialization [22][23], while upregulation of ATF3 was associated with cellular stress responses [18][24][25], decidualization [24], and preeclampsia [26]. In comparison, SMAD9 is activated by bone morphogenic proteins (BMPs), a subfamily of the transforming growth factor-β (TGF-β) family [17][27]. Although some BMPs such as BMP-4 can be regulated in a downstream manner from the cAMP pathway [28], the connection between SMAD9 and cAMP is still unclear. GATA2 was found to be slightly upregulated, which may suggest that the enrichment of L1PREC2 in the 5′UTR still plays a role in regulating LGALS16 despite the insertion of L1PA6 [2]. Interestingly, CREB1, a major regulator downstream of the cAMP pathway was not upregulated in this RT-qPCR array analysis suggesting that post-translational modification and transcriptional activation might be essential for this TF.
Figure 5. Changes in the expression of genes encoding TFs in JEG-3 cells. Cells were treated 8−Br−cAMP (250 μM) for 36 h to induce trophoblastic differentiation and Qiagen RT2 Profiler™ PCR Array kit was used to assess fold changes in gene expression between differentiated and control cells presented as a heatmap.
It further analyzed the 2 kb region upstream from the transcription start site of LGALS16 by extracting the sequence from Ensembl (Release 104) and performing in silico analysis of TF-binding sites using PROMO virtual laboratory with a 0% dissimilarity index. Putative binding sites for seventeen TFs were identified, which may represent specific response elements, enhancers, or silencers (Figure 6). To reveal common patterns in the expression of the predicted TFs, it weas watched for their protein levels in two LGALS16-positive tissues, the cerebellum and placenta, using the expression scores (high, medium, low) available at HPA. Within this set of data, two TFs (CEBPβ and TFII-I) were characterized by high protein expression levels, seven TFs had variable levels (GR, NFAT1, p53, STAT4, TCF-4E, TFIID, and YY1), four TFs (ERα, FOXP3, Pax5, and PR A) showed low expression, and no HPA data were available for GRα, GRβ, PR B, and XBP-1 in these tissues (Figure 7). Thus, the role of the predicted TFs in tissue-specific transcriptional regulation of LGALS16 can be different and remains to be studied.
Figure 6. In silico screening of putative transcription factor binding sites for the LGALS16 gene. There are multiple binding sites for 17 transcription factors within the 2 kb promoter region upstream the transcription start site of LGALS16 gene as detected by PROMO.
Figure 7.
Protein expression patterns of predicted transcription factors for
LGALS16
regulation in the cerebellum and placenta.

3.2. miRNAs

Post-transcriptional control of mRNA availability for protein synthesis depends on miRNAs which can hybridize to complementary sequences in protein-coding mRNAs at the 3′ untranslated region and either block protein translation or induce mRNA degradation [29]. Multiple miRNAs were predicted to target the LGALS16 transcript by bioinformatics tools, such as Diana Tools [30], miRabel [31], miRDB [32], and TargetScan [33], which use different algorithms and methods. A robust application of these tools using default options shows that five miRNAs (hsa-miR-3155a, hsa-miR-3155b, hsa-miR-4689, hsa-miR-4778-5p, hsa-miR-6783-5p) are predicted by all four of these online platforms (Figure 8). These miRNAs among others can be considered as perspective candidates for regulating the stability and/or translational potential of the LGALS16 transcripts, especially in relevant tissues such as placenta and brain. Indeed, a significant decrease in hsa-miR-4778-5p expression during gestation in exosomes from maternal blood was associated with preterm birth pregnancies [34]. Expression of hsa-miR-3155a was significantly upregulated in the anterior cingulate cortex of deceased patients with major depressive disorder [35]. In comparison, the expression of hsa-miR-4689 was downregulated in exosomes isolated from the plasma of patients with mesial temporal lobe epilepsy with hippocampal sclerosis compared to controls [36]. Differential expression of exosomal hsa-miR-4689 and hsa-miR-6783-5p was reported in patients with intracranial aneurysms [37]. Human miRNA tissue atlas confirms expression of hsa-miR-3155a, hsa-miR-3155b, hsa-miR-4689, and hsa-miR-4778-5p in brain among other tissues at variable levels [38]. Unraveling possible mechanisms of miRNA-mediated regulation of galectin-16 in these tissues awaits future research.
Figure 8. Putative miRNAs targeting LGALS16 mRNA transcript. Five miRNAs are unanimously predicted by four different online platforms such as Diana Tools, miRabel, miRDB, and TargetScan.

3.3. LGALS16 and Human Diseases

Dysregulation of the placenta-specific gene cluster containing LGALS16 is associated with a pregnancy complication known as preeclampsia, which can be highly fatal for both the mother and fetus. As such, LGALS16 together with LGALS13 and LGALS14 were confirmed to satisfy the criteria of placenta enriched genes in a comprehensive studyone of RNA-Seq datasets from 302 placental biopsies [39]. However, although increasing expression of LGALS13, LGALS14, and LGALS16 was observed during forskolin-induced syncytialization and differentiation of primary trophoblasts and BeWo cells in culture, only LGALS13 and LGALS14 were downregulated in preeclampsia with no significant changes of LGALS16 [2]. Remarkably, LGALS16 does not show sex-biased expression depending on the chromosomal sex of the fetus while LGALS13 and LGALS14 are notably elevated in fetal male placentas based on the chorionic villus transcriptome [40]. These aspects of galectin network regulation remain unclear in the context of placental disorders and development. In addition, LGALS16 may be an important molecule in the context of brain diseases as it follows from primary bioinformatics analyses [41][42][43][44]].

References

  1. Than, N.G.; Romero, R.; Goodman, M.; Weckle, A.; Xing, J.; Dong, Z.; Xu, Y.; Tarquini, F.; Szilagyi, A.; Gal, P.; et al. A primate subfamily of galectins expressed at the maternal-fetal interface that promote immune cell death. Proc. Natl. Acad. Sci. USA 2009, 106, 9731–9736.
  2. Than, N.G.; Romero, R.; Xu, Y.; Erez, O.; Xu, Z.; Bhatti, G.; Leavitt, R.; Chung, T.H.; El-Azzamy, H.; LaJeunesse, C.; et al. Evolutionary origins of the placental expression of chromosome 19 cluster galectins and their complex dysregulation in preeclampsia. Placenta 2014, 35, 855–865.
  3. Blois, S.M.; Dveksler, G.; Vasta, G.R.; Freitag, N.; Blanchard, V.; Barrientos, G. Pregnancy galectinology: Insights into a complex network of glycan binding proteins. Front. Immunol. 2019, 10, 1166.
  4. Ely, A.Z.; Moon, J.M.; Sliwoski, G.R.; Sangha, A.K.; Shen, X.-X.; Labella, A.L.; Meiler, J.; Capra, J.A.; Rokas, A. The impact of natural selection on the evolution and function of placentally expressed galectins. Genome Biol. Evol. 2019, 11, 2574–2592.
  5. Singer, M.F. SINEs and LINEs: Highly repeated short and long interspersed sequences in mammalian genomes. Cell 1982, 28, 433–434.
  6. Weckselblatt, B.; Rudd, M.K. Human structural variation: Mechanisms of chromosome rearrangements. Trends Genet. 2015, 31, 587–599.
  7. Si, Y.; Yao, Y.; Ayala, G.J.; Li, X.; Han, Q.; Zhang, W.; Xu, X.; Tai, G.; Mayo, K.H.; Zhou, Y.; et al. Human galectin-16 has a pseudo ligand binding site and plays a role in regulating c-Rel mediated lymphocyte activity. Biochim. Biophys. Acta Gen. Subj. 2021, 1865, 129755.
  8. Johannes, L.; Jacob, R.; Leffler, H. Galectins at a glance. J. Cell Sci. 2018, 131, jcs208884.
  9. Barrett, T.; Wilhite, S.E.; Ledoux, P.; Evangelista, C.; Kim, I.F.; Tomashevsky, M.; Marshall, K.A.; Phillippy, K.H.; Sherman, P.M.; Holko, M.; et al. NCBI GEO: Archive for functional genomics data sets—Update. Nucleic Acids Res. 2013, 41, D991–D995.
  10. Rosenfeld, C.S. The placenta-brain-axis. J. Neurosci. Res. 2021, 99, 271–283.
  11. Inamochi, Y.; Mochizuki, K.; Goda, T. Histone code of genes induced by co-treatment with a glucocorticoid hormone agonist and a p44/42 MAPK inhibitor in human small intestinal Caco-2 cells. Biochim. Biophys. Acta 2014, 1840, 693–700.
  12. Park, M.H.; Hong, J.T. Roles of NF-κB in cancer and inflammatory diseases and their therapeutic approaches. Cells 2016, 5, 15.
  13. Hayden, M.S.; Ghosh, S. NF-κB in immunobiology. Cell Res. 2011, 21, 223–244.
  14. Balsa, E.; Perry, E.A.; Bennett, C.F.; Jedrychowski, M.; Gygi, S.P.; Doench, J.G.; Puigserver, P. Defective NADPH production in mitochondrial disease complex I causes inflammation and cell death. Nat. Commun. 2020, 11, 2714.
  15. Uhlén, M.; Fagerberg, L.; Hallström, B.M.; Lindskog, C.; Oksvold, P.; Mardinoglu, A.; Sivertsson, A.; Kampf, C.; Sjöstedt, E.; Asplund, A. Tissue-based map of the human proteome. Science 2015, 347, 1260419.
  16. Nuzzo, A.M.; Giuffrida, D.; Zenerino, C.; Piazzese, A.; Olearo, E.; Todros, T.; Rolfo, A. JunB/Cyclin-D1 imbalance in placental mesenchymal stromal cells derived from preeclamptic pregnancies with fetal-placental compromise. Placenta 2014, 35, 483–490.
  17. Han, Y.M.; Romero, R.; Kim, J.S.; Tarca, A.L.; Kim, S.K.; Draghici, S.; Kusanovic, J.P.; Gotsch, F.; Mittal, P.; Hassan, S.S.; et al. Region-specific gene expression profiling: Novel evidence for biological heterogeneity of the human amnion. Biol. Reprod. 2008, 79, 954–961.
  18. Knyazev, E.N.; Zakharova, G.S.; Astakhova, L.A.; Tsypina, I.M.; Tonevitsky, A.G.; Sukhikh, G.T. Metabolic reprogramming of trophoblast cells in response to hypoxia. Bull. Exp. Biol. Med. 2019, 166, 321–325.
  19. Walcott, B.P.; Winkler, E.A.; Zhou, S.; Birk, H.; Guo, D.; Koch, M.J.; Stapleton, C.J.; Spiegelman, D.; Dionne-Laporte, A.; Dion, P.A.; et al. Identification of a rare BMP pathway mutation in a non-syndromic human brain arteriovenous malformation via exome sequencing. Hum. Genome Var. 2018, 5, 18001.
  20. Ma, S.; Pang, C.; Song, L.; Guo, F.; Sun, H. Activating transcription factor 3 is overexpressed in human glioma and its knockdown in glioblastoma cells causes growth inhibition both in vitro and in vivo. Int. J. Mol. Med. 2015, 35, 1561–1573.
  21. Garces de Los Favos Alonso, I.; Liang, H.C.; Turner, S.D.; Lagger, S.; Merkel, O.; Kenner, L. The role of activator protein-1 (AP-1) family members in CD30-positive lymphomas. Cancers 2018, 10, 93.
  22. Shankar, K.; Kang, P.; Zhong, Y.; Borengasser, S.J.; Wingfield, C.; Saben, J.; Gomez-Acevedo, H.; Thakali, K.M. Transcriptomic and epigenomic landscapes during cell fusion in BeWo trophoblast cells. Placenta 2015, 36, 1342–1351.
  23. Cheng, Y.-H.; Richardson, B.D.; Hubert, M.A.; Handwerger, S. Isolation and characterization of the human syncytin gene promoter. Biol. Reprod. 2004, 70, 694–701.
  24. Wang, Z.; Liu, Y.; Liu, J.; Kong, N.; Jiang, Y.; Jiang, R.; Zhen, X.; Zhou, J.; Li, C.; Sun, H.; et al. ATF3 deficiency impairs the proliferative-secretory phase transition and decidualization in RIF patients. Cell Death Dis. 2021, 12, 387.
  25. Jadhav, K.; Zhang, Y. Activating transcription factor 3 in immune response and metabolic regulation. Liver Res. 2017, 1, 96–102.
  26. Moslehi, R.; Mills, J.L.; Signore, C.; Kumar, A.; Ambroggio, X.; Dzutsev, A. Integrative transcriptome analysis reveals dysregulation of canonical cancer molecular pathways in placenta leading to preeclampsia. Sci. Rep. 2013, 3, 2407.
  27. Tsukamoto, S.; Mizuta, T.; Fujimoto, M.; Ohte, S.; Osawa, K.; Miyamoto, A.; Yoneyama, K.; Murata, E.; Machiya, A.; Jimi, E.; et al. Smad9 is a new type of transcriptional regulator in bone morphogenetic protein signaling. Sci. Rep. 2014, 4, 7596.
  28. Heo, K.S.; Fujiwara, K.; Abe, J. Disturbed-flow-mediated vascular reactive oxygen species induce endothelial dysfunction. Circ. J. 2011, 75, 2722–2730.
  29. Fabian, M.R.; Sonenberg, N.; Filipowicz, W. Regulation of mRNA translation and stability by microRNAs. Annu. Rev. Biochem. 2010, 79, 351–379.
  30. Paraskevopoulou, M.D.; Georgakilas, G.; Kostoulas, N.; Vlachos, I.S.; Vergoulis, T.; Reczko, M.; Filippidis, C.; Dalamagas, T.; Hatzigeorgiou, A.G. DIANA-microT web server v5.0: Service integration into miRNA functional analysis workflows. Nucleic Acids Res. 2013, 41, W169–W173.
  31. Quillet, A.; Saad, C.; Ferry, G.; Anouar, Y.; Vergne, N.; Lecroq, T.; Dubessy, C. Improving bioinformatics prediction of microRNA targets by ranks aggregation. Front. Genet. 2020, 10, 1330.
  32. Chen, Y.; Wang, X. miRDB: An online database for prediction of functional microRNA targets. Nucleic Acids Res. 2020, 48, D127–D131.
  33. Agarwal, V.; Bell, G.W.; Nam, J.W.; Bartel, D.P. Predicting effective microRNA target sites in mammalian mRNAs. eLife 2015, 4, e05005.
  34. Menon, R.; Debnath, C.; Lai, A.; Guanzon, D.; Bhatnagar, S.; Kshetrapal, P.K.; Sheller-Miller, S.; Salomon, C.; Garbhini Study Team. Circulating exosomal miRNA profile during term and preterm birth pregnancies: A longitudinal study. Endocrinology 2019, 160, 249–275.
  35. Yoshino, Y.; Roy, B.; Dwivedi, Y. Altered miRNA landscape of the anterior cingulate cortex is associated with potential loss of key neuronal functions in depressed brain. Eur. Neuropsychopharmacol. 2020, 40, 70–84.
  36. Yan, S.; Zhang, H.; Xie, W.; Meng, F.; Zhang, K.; Jiang, Y.; Zhang, X.; Zhang, J. Altered microRNA profiles in plasma exosomes from mesial temporal lobe epilepsy with hippocampal sclerosis. Oncotarget 2017, 8, 4136–4146.
  37. Liao, B.; Zhou, M.X.; Zhou, F.K.; Luo, X.M.; Zhong, S.X.; Zhou, Y.F.; Qin, Y.S.; Li, P.P.; Qin, C. Exosome-derived miRNAs as biomarkers of the development and progression of intracranial aneurysms. J. Atheroscler. Thromb. 2020, 27, 545–610.
  38. Ludwig, N.; Leidinger, P.; Becker, K.; Backes, C.; Fehlmann, T.; Pallasch, C.; Rheinheimer, S.; Meder, B.; Stähler, C.; Meese, E.; et al. Distribution of miRNA expression across human tissues. Nucleic Acids Res. 2016, 44, 3865–3877.
  39. Gong, S.; Gaccioli, F.; Dopierala, J.; Sovio, U.; Cook, E.; Volders, P.J.; Martens, L.; Kirk, P.D.W.; Richardson, S.; Smith, G.C.S.; et al. The RNA landscape of the human placenta in health and disease. Nat. Commun. 2021, 12, 2639.
  40. Braun, A.E.; Muench, K.L.; Robinson, B.G.; Wang, A.; Palmer, T.D.; Winn, V.D. Examining Sex Differences in the Human Placental Transcriptome During the First Fetal Androgen Peak. Reprod Sci. 2021, 28, 801–818.
  41. Santos, J.X.; Rasga, C.; Marques, A.R.; Martiniano, H.F.M.C.; Asif, M.; Vilela, J.; Oliveira, G.; Vicente, A.M. A role for geneenvironment interactions in Autism Spectrum Disorder is suggested by variants in genes regulating exposure to environmental factors. BioRxiv 2019, 520544.
  42. Vastrad, B.; Vastrad, C. Bioinformatics analyses of significant genes, related pathways and candidate prognostic biomarkers in Alzheimer’s disease. BioRxiv 2021.
  43. Zhao, B.; Shan, Y.; Yang, Y.; Zhaolong, Y.; Li, T.; Wang, X.; Luo, T.; Zhu, Z.; Sullivan, P.; Zhao, H.; et al. Transcriptome-wide association analysis of brain structures yields insights into pleiotropy with complex neuropsychiatric traits. Nat. Commun. 2021, 12, 2878.
  44. Cheng, P.; Feng, F.; Yang, H.; Jin, S.; Lai, C.;Wang, Y.; Bi, J. Detection and significance of exosomal mRNA expression profiles in the cerebrospinal fluid of patients with meningeal carcinomatosis. J. Mol. Neurosci. 2021, 71, 790–803.
More
Video Production Service