Embodied CO2 in China’s Imports, Exports: Comparison
Please note this is a comparison between Version 1 by yaru tan and Version 2 by Vivi Li.

Constraining the embodied CO2  from international trade is a crucial part of China’s efforts to achieve emission peak and carbon neutrality. By referring to the WIOD, researchersthis article applies the Global Multi-Regional Input-Output (GMRIO) Model and the Value-added Trade Accounting Method to calculate the amount of embodied CO2 in China’s international trade from 2000 to 2014. Results indicate that China’s embodied CO2 in imports and exports is imbalanced in three dimensions: product, region, and industry. One direct cause of this phenomenon is China’s higher carbon emission factors compared to its trading partner. However, the real cause is the global relocation of energy-intensive industries, which leads China to undertake the production of high-carbon industries. To achieve the 3060 Dual Carbon Goal and high-quality economic development, China needs comprehensive and systematic reforms in its economic structure. 

  • embodied CO2
  • trade value-added
  • GMRIO model
  • GVCs

1. Introduction

Since the beginning of the 1980s, a new international demarcation of the global value chains (GVCs) has gradually taken place, and countries at different degrees of economic development have been integrated into the global production network. The production processes have been characterized by fragmentation, with countries participating in different production segments according to their natural advantages. During the reform and opening-up period, China has actively participated in it. With the advantages of labor and resources, China has become the world factory for manufacturing and processing trade. After joining WTO in 2001, China’s exports have been driven rapidly by the global market and China became the world’s largest exporter in 2009. However, China did not have many advantages in terms of industrial knowledge and leading technology in the GVCs; hence, the exported products were mainly in the labor-intensive and capital-intensive industries [1]. Accordingly, this has led to certain drawbacks in China’s trade model. First, relying on the ever-increasing scale of exportation could boost China’s economic growth in the short term; however, this would not drive the quality of the economy concurrently. Moreover, the long-term exportation of low value-added products would also lead to environmental damages and an excessive consumption of resources [2].
With global warming and frequent extreme weather events, there has also been greater concerns over the severity of China’s climate change issues. According to the International Energy Agency (IEA) accessed on 6 May 2022 (IEA: https://www.iea.org/data-and-statistics), China’s CO2 emissions totaled 5449.5 Mt in 2005, surpassing the United States; hence China has become the world’s top carbon emitter, accounting for 20.12% of the world’s total emissions. In 2019, China’s total carbon emissions rose to 9919.1 Mt, equivalent to 29.50% of the world’s total emissions. The continuous expansion of CO2 emissions has posed challenges to China, facing public pressures from the international society for emission reduction as well as balancing domestic economic development and environmental protection. To mitigate it, China has proposed emission peak and carbon neutrality goals (3060 Dual Carbon Goal) in 2020 (The 3060 dual carbon goal is that China achieve carbon peaking by 2030 and carbon neutrality by 2060. Source: Central People’s Government of the People’s Republic of China accessed on 22 September 2020, “China will adopt stronger policies and measures to peak CO2 emissions by 2030 and strive to achieve carbon neutrality by 2060”, http://www.gov.cn/gongbao/content/2020/content_5549875.htm). Achieving reduction in carbon emission requires a systematic approach and restraining the embodied CO2 from international trade is crucial. Excessive embodied CO2 emission in exports and its substantial imbalance with imports have been a realistic issue. In 2014, China’s embodied CO2 in exports were as high as 2035.22 Mt, accounting for 21.95% of China’s total CO2 emissions. In comparison, embodied CO2 in imports were only 652.05 Mt, equivalent to only 7.03%. Therefore, it is necessary to research the imbalance of embodied CO2 in China’s imports, exports and the causes.

2. Literature Review

CO2 emissions are caused by production and consumption activities such as the combustion of fossil fuels. Although international trade does not directly generate CO2 except for transportation, there is still a strong correlation between international trade and carbon emissions in real life [3]. The rationale is that international trade separates the production and consumption systems of products, making carbon emissions transferable and reallocated across borders. International trade leads to the international demarcations based on comparative advantages, which in turn change the distribution of production activities on a global scale. Thus, it indirectly changes the geographical distribution of CO2, shifting them from countries with comparative advantages in clean industries to those with comparative advantages in high pollution industries. This phenomenon has long received academic attention. Baumol and Oates (1988) [4] proposed the pollution haven hypothesis (PHH), which believes that asymmetric environmental policies leads to the international migration of industries. To reduce the costs of environmental management, countries with strict environmental regulations tend to move high-carbon industries to those regions with less strict environmental regulations and then import back the desired goods. This often makes the countries and regions with less strict environmental regulations a haven of pollution. In general, developed countries are highly concerned about the environment and they will tighten the pollution regulations. In contrast, developing countries are more willing to ease environmental regulations to boost their economies, leading them to produce products in pollution-extensive industries. Data supporting this hypothesis have been provided by Robinson (1988) [5], who examined data over the period of 1973–1982 and found that the United States tended to import rather than produce pollution-intensive products. Lee and Roland-Holst (1993) [6] used a dual-country CGE model for trade between Japan and Indonesia and it appears that their bilateral trade effects a net transfer of environmental costs from the former to the latter. Copeland and Taylor (1994) [7][8][7,8] constructed a North-South model that demonstrated that trade mitigates environmental pollutions in the North (developed countries) and increases pollution levels in the South (developing countries). Mani and Wheeler (1998) [9] showed that pollution-intensive outputs as a percentage of total manufacturing had fallen consistently in the OECD countries and they had risen steadily in the developing world. In addition to the theoretical and data support above, there are also literatures that use the Input-Output Analysis (IOA) approach to study the relationship between international trade and environment [10][11][10,11]. This method is more intuitive and it directly reveals the impacts of international trade on environment by calculating embodied CO2. With the improvement of technical tools and database, the method has changed from the initial Single-Region Input-Output (SRIO model) (Machado, 2001 [12]; Chen et al., 2008 [13]) through the Bilateral Region Input-Output (BRIO model) (Peters 2008 [14]) and the Multi-Region Input-Output (MRIO model) (Wiedmann, 2009 [15]; Ma et al., 2015 [16]), to the Global Multi-Region Input-Output (GMRIO model) (Xie et al., 2016 [17], Yuan et al., 2014 [18]). The I-O approach is still an effective tool for studying environmental economics. However, due to the fragmentation of production, countries around the world are included in the GVCs with intermediate goods being traded across borders often. Therefore, if the traditional trade accounting method is followed, it will result in a double counting of trade volume, which makes the accounting of embodied CO2 biased. From the research objects and areas of concern, many scholars have paid higher attention to the embodied CO2 between specific countries [19][20][19,20]. Yan et al., 2017 [21] and Liu et al., 2020 [22] focused on the China-US trade, Pan et al., 2018 [23] and Jin et al., 2018 [24] studied the embodied CO2 in the trade between China and Japan. Zheng et al., 2018 [25] and Meng et al., 2019 [26] studied the issue of embodied CO2 from China-BRICS and China- “Belt and Road” countries, respectively. In addition, there are also some papers that focus on the embodied CO2 in foreign trade of a certain country [27]. For example, Tolmasquim and Machado, 2003 [28] analyzed the embodied CO2 in Brazil’s international trade in the 1990s and argued that the increase of CO2 emissions in the country was closely related to its specialization in energy-intensive industries. Whan-Sam Chung et al., 2011 [29] analyzed CO2 emissions and the affecting factors in South Korea from 1985 to 2005, and the findings proved that national energy policies such as those pertaining to the diversification of energy sources are effective. Numerous scholars have studied the issue of embodied CO2 in China from a particular perspective. Wang, 2010 [30] accounted for the embodied CO2 of exports in China’s industrial sector from 2003 to 2007, and he concluded that the expansion of exports was the main reason for the increase in the size of embodied CO2. Dai et al., 2015 [31] studied the embodied CO2 of Chinese agriculture from 1990 to 2010, and he used the Kaya constant equation decomposition principle to determine its driving factors. Fei et al., 2020 [32] measured embodied CO2 emissions of Chinese exports from 1995 to 2011 and found that the trade in intermediate goods was the main reason. However, due to the complexity of calculation, literatures about the issue of embodied CO2 across all industries and its imbalance between imports and exports are relatively limited. That is why rwesearchers have conducted the research.

3. The Imbalance of China’s Embodied CO2 in Imports and Exports

3.1. Imbalance in Product Amount and Product Type

First, during the period this enstrudy focuses on, China’s total embodied CO2 emissions in exports were much higher than that of imports and the imbalance has clearly indicated that China is clearly in the position of carbon transfer-in (Figure 1). From 2001 to 2007, the gap was widening. In 2001, the embodied CO2 emissions in exports was higher than that in imports by 432.53 Mt, and it reached a peak of 1590.93 Mt in 2007, which means that the amount of transferred carbon emission into China was from 432.53 Mt to 1590.93 Mt. From 2008 to 2010, the gap showed a V-shaped change of falling and then rising. This is mainly due to the financial crisis in 2008; the decline in exports led to the decline in embodied CO2, but after 2009, it gradually recovered. From 2010 to 2014, the difference tended to be stable, basically between 1300 and 1400 Mt.
Figure 1.
 The embodied CO
2 in China’s import and export from 2001 to 2014 (Unit: Mt). Source: The figure in this entry is plotted by the calculations.
 in China’s import and export from 2001 to 2014 (Unit: Mt). Source: The figure in this article is plotted by the calculations.
Second, the types of imported and exported products with embodied CO2 are also imbalanced (Figure 2). The main source of embodied carbon in imports is from trade of intermediate goods, which accounts for more than 70%. However, more than 50% of the embodied carbon in exports trade is from final goods, although the trend is weakening slightly. In 2001, 53.1% of the embodied carbon in exports was generated from final goods. In 2014, the proportion dropped to 49.6%. In general, the difference of embodied carbon in various product types is consistent with China’s long-established manufacturing and processing trade pattern of importing intermediate goods and exporting final goods. It has indicated that the trade pattern has a great impact on carbon emissions.
Figure 2. The product type of embodied CO2 in China’s import and export from 2001 to 2014. Note: The left one is embodied CO2 in import and the right is in export.

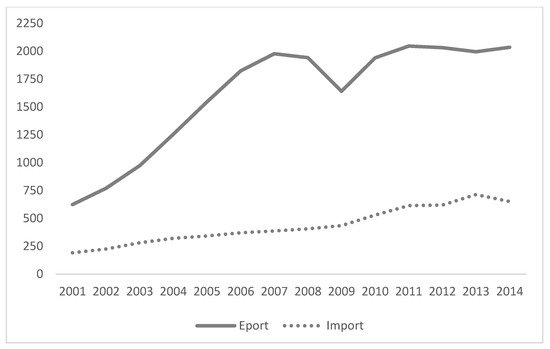
3.2. Imbalance in Regions

China’s embodied CO2 in imports and exports have been in great imbalance with the major regions of the world and there have been significant differences among these regions. There have been no substantial changes in the characteristics during the study interval; hence 2010 has been chosen as an example for illustration (Figure 3). According to the geographical and economic development characteristics, the 43 countries and regions in the WIOD excluding China have been divided into six major regions (Euro Zone; Non-Euro Zone; BRIIAT; East Asia; NAFTA and ROW).
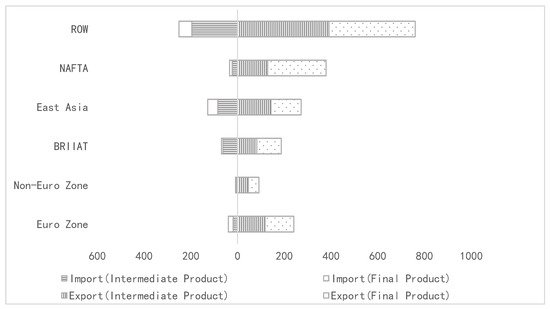
Figure 3. Region distribution of China’s embodied CO2 in import and export in 2010. (Unit: Mt). Note: (1) NAFTA refers to North American Free Trade Area, BRIIAT includes Brazil, Russia, India, Indonesia, Australia and Turkey, East Asia includes Japan, South Korea and Taiwan (China), and ROW refers to the rest of the world. Since the rest of the world ROW is counted as a whole, the description of this articlentry does not include ROW. (2) This table divides the EU into the Euro Zone and Non-Euro Zone. The former contains Austria, Belgium, Cyprus, Germany, Spain, Estonia, Finland, France, Greece, Ireland, Italy, Luxembourg, Malta, the Netherlands, Portugal, Slovakia and Slovenia. Non-Euro Zone contains Bulgaria, the Czech Republic, Denmark, the United Kingdom, Croatia, Hungary, Lithuania, Latvia, Poland Romania and Sweden. Since Switzerland CHE and Norway NOR are not part of the EU, they are not included in the statistical results.
The embodied CO2 in China’s exports to all these regions are much higher compared with that in imports. Among them, NAFTA, Euro Zone and Non-Euro Zone are the three regions with the most substantial imbalanced. Reflected in data, embodied CO2 emissions from China’s exports to these regions are 11.23 times, 11.00 times and 6.18 times of that from imports, respectively. Moreover, the embodied CO2 in exports to these regions were dominated by final products. From the specific countries in Table 12 below, the US is the country with the largest imbalance of NAFTA, accounting for 81.03% of the total imbalance, mainly because China exports a large amount of embodied CO2 in final goods to the US, reaching 214.58 Mt. Germany, France, Italy and the Netherlands are the main imbalanced countries in the Euro Zone, and China’s exports to them are also quite large; the difference of product type is not very obvious, but in general the final products are higher than the intermediate goods. The UK is the country with the largest imbalance in the Non-Euro Zone, accounting for 51.03% of the region. A distinctive feature is that China imports very little from the UK, only 2.79 Mt, and exports 45.26 Mt (mainly final goods).
Table 12.
 China’s Embodied CO
2
 of Import and Export to Major Countries by Region in 2010 (Unit: Mt).
Region Country Immediate Product (Import) Final Product (Import) Immediate Product (Export) Final Product (Export)
Euro Germany 9.05 11.43 35.72 44.38
Euro France 2.28 1.95 21.29 21.25
Euro Italy 1.56 2.24 17.05 17.09
Euro The Netherlands 1.49 1.16 14.70 12.71
Non-Euro UK. 1.29 1.51 19.69 25.58
East Asia Japan 26.58 13.09 74.40 92.37
NAFTA US 17.33 9.08 91.41 214.58
BRIIAT Australia 11.54 1.36 19.45 20.81
BRIIAT Brazil 7.06 0.66 13.49 13.68
BRIIAT India 11.09 1.34 20.78 17.40
East Asia and BRIIAT belong to the zone with an intermediate imbalance, where the embodied CO2 in exports is 2.73 times and 2.13 times than that in imports, respectively. Moreover, it is observed that the CO2 in imports of the two regions is mainly from intermediate products. Among them, there is little difference in BRIIAT countries, with about 90% of the imported embodied CO2 from intermediate goods in the four countries (Australia, Brazil, India, and Russia). Japan is the country with the largest imbalance in East Asia, accounting for 88.01% of the total imbalance CO2. A relatively large share of China’s imports of embodied CO2 to Japan comes from intermediate goods, about twice as much as final goods. Besides, for embodied CO2 in exports, immediate goods carry less weight compared with final goods. To summarize, the main source of China’s embodied CO2 in imports is intermediate products, basically from East Asia and BRIIAT, whereas the main source of embodied CO2 in exports is final goods, mainly from NAFTA and Euro Zone, followed by East Asia and BRIIAT, with the least inflow to Non-Euro Zone. Therefore, it is further clear that China, as the world factory, operates a typical triangular trade, importing intermediate goods from East Asia and emerging economies to meet the consumption demand of final goods in developed economies in Europe and the US.

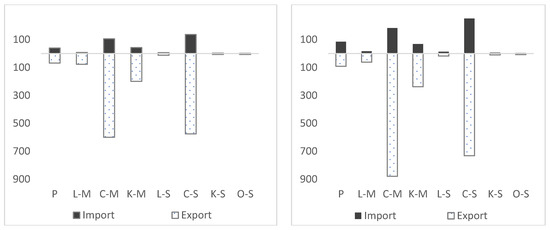
3.3. Imbalance in Industries

As shown in Figure 4, in 2005, all industries had higher exported embodied CO2 than that from importation, dominated by the products of capital-intensive manufacturing industry and capital-intensive service industry. The total imbalance from all industries was 1203.49 Mt and the primary resources industry, manufacturing industry, and service industry accounted for 2.45%, 59.87% and 37.68%, respectively. The primary resources industry is the industry with the least imbalance with exports of embodied CO2 only 29.46 Mt higher than that from importation. This is mainly because of China’s dependence on imports for direct extraction of raw materials, fuels, etc. Manufacturing industries are with the most substantial imbalance. Further breakdown shows labor-intensive manufacturing, capital-intensive manufacturing, and knowledge-intensive manufacturing industry are out of balance by 69.89 Mt, 494.54 Mt and 156.14 Mt, respectively. Service industries are out of balance by a total of 453.46 Mt, mainly generated by the imbalance of capital-intensive service (439.36 Mt), with very few in labor-intensive service, knowledge-intensive service, and other services.
Figure 4. Industry distribution of China’s imports and exports of embodied CO2 in 2005 and 2014 (Unit: Mt). Note: (1) The left one is industry distribution of embodied CO2 in 2005 and the right is in 2014. (2) P, L-M, C-M, K-M, L-S, C-S, K-S, O-S represent primary industries, labor-intensive manufacturing, capital-intensive manufacturing, knowledge-intensive manufacturing, labor-intensive services, capital-intensive services, knowledge-intensive services and other services, respectively.
In 2014, the situation remained that all industries had higher exported embodied CO2 than that from importation, with a difference of 1383.17 Mt, although the share of each individual industry has changed. With the increase of imports in the primary resources industry, its imbalance of embodied CO2 decreased significantly and the proportion fell to 0.45%, which was the least imbalanced industry. The manufacturing industry still had the largest imbalance and the proportion rose to 65.81%. Among them, the imbalance of capital-intensive manufacturing is the largest, which is 696.39 Mt. Inevitably, it drove the rise of the imbalance of the whole manufacturing industry. The embodied CO2 in exports of knowledge-intensive manufacturing was higher than that from imports by 169.41 Mt. Labor-intensive manufacturing has the lowest imbalance (44.48 Mt). Thus, it can be seen that the structure of China’s embodied CO2 in exports has been optimized to a certain extent, with increase in the knowledge-intensive manufacturing exports and decrease in the labor-intensive manufacturing exports. However, as exports of capital-intensive manufacturing remain large, they still contribute to increased CO2. The imbalance proportion in the service sector has decreased slightly, from 37.68% of the total imbalance in 2005 to 33.74% in 2014. The imbalance in the capital-intensive services still dominates with relatively low imbalance in the other three services industries. To summarize, the structure of China’s imports and exports of embodied CO2 has constantly been optimized, but the current imbalance is still substantial. As exports of labor-intensive manufacturing have declined and exports of knowledge-intensive manufacturing have increased, the shift towards knowledge-based manufacturing is beneficial to China’s reduction in emissions. However, the capital-intensive industries still have the biggest share of embodied CO2 emissions from exports. Capital-intensive industries have been labeled by high-carbon content; hence, they should be the focus of reducing carbon emissions in the future. In addition, the knowledge-intensive service industries and other service industries are low-carbon industries. The inclination towards such industries will help a great deal for achieving the overall emission reductions.
Video Production Service