Your browser does not fully support modern features. Please upgrade for a smoother experience.
Please note this is a comparison between Version 1 by Raja Oloan Saut Gurning and Version 2 by Catherine Yang.
Several public seaports and fishing terminals are located in the same port complex but have different fragmented operations such as waste management. It is possible to provide a new initiative to ensure sustainability for all entities in the surrounding port ecosystem through the application of Green Port using the circular economy approach and mixed linear programming model. It was discovered that the integration model has the potential to generate new energy by recycling waste from all related entities in the production of a few main fishing products such as tuna, sardine, and squid, as well as vessel traffic, facilities, and cargo flow interactions in addition to other port operations.
- Green port
- circular economy
- waste management
1. Circular Economy in Port and Fishery Aquaculture Waste
Studies on ports and their acceleration towards a circular economy are limited [1][17] even though the concept is closely related to sustainable development and management of ports including their ecosystem such as the operators, fishermen, fishing industries, environment, and the local community. The correlation between society and the port ecosystem developed through a circular economy has been studied [2][18]. It was discovered that the approach has the ability to provide economic, social, and environmental benefits by promoting its implementation for port operators, users, and surrounding cities to ensure a win-win scenario for several parties. Furthermore, the protection of the port environment including the fishing operations has become an important concern for planners and the increasing awareness concerning sustainable ports has led to its global acceptance and implementation, even in sea and fishing ports. This is observed in the visions set out in Europe toward transiting to the circular economy, as indicated in the following Table 1, but several fragmentations have been reported in their implementation processes [3][4][5][19,20,21].
Table 1.
European Port Circular Economy Strategy.
| Ports | Existing Circular and Bio-Based Economy Clusters | Strategies |
|---|---|---|
| Rotterdam | Renewable energy clusters | Towards 2030 Rotterdam |
| Antwerp | E-waste and recycling | |
| Zeeland | Bio-park | Sustainable Development Strategy |
| Ghent | Bio-refinery, bio-park | |
| Amsterdam | Recycling | Vision 2030 and Circle city scan |
| Ostend | Recycle, recover | |
| Brussels | Recycling hub | |
| North Sea Port | Energy hub; reduce, recycle |
Studies also mentioned the application of circular economy in the fishery and aquaculture waste industry. For example, Corral et al. (2022) [8][23] converted galicia aquaculture waste into revalorized by-products while Zilia et al. (2021) [9][24] changed sea urchin waste into collagen to produce biomedical devices, dermal implants, cosmetics, and pharmaceutical products. Another example in the fishery industry is the conversion of food waste and by-products to replace fish meal [10][25]. Moreover, the implementation of a circular economy to ensure waste is reused to produce biomaterials or energy sources is also a method of maximizing the value of production and reducing the quantity of waste to be disposed of [11][26].
2. Framework of Circular Economy in the Public Terminal, Fishing Terminal, and City Authority
Figure 12 shows a framework of the circular economy involving the public terminal, fishing terminal, and city of Denpasar which is expected to be implemented by maintaining the 3R principles of Reduce, Reuse, and Recycle. It is important to note that the liquid waste from fish processing activity can be reused after being treated while vessel parking management can be used to ensure the safety of vessel traffic and increase the efficiency of fish landing. Moreover, it is possible to regulate the activities of fishermen toward recycling their fishing gears, implement reusable products around public terminals, and ensure terminal operators provide an adequate location for street/stand vendors. Every waste generated from surrounding activities can also be recycled by the port and city management instead of transporting them directly to landfills in order to provide certain benefits for both the entities of the port and the city. It is important to note that the current waste disposal system in Denpasar City is in the form of a landfill.
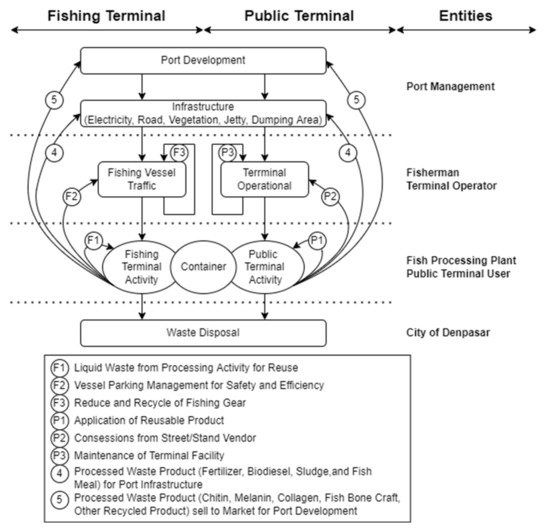
Figure 12.
Circular Economy in Fishing and Public Terminal. Source: Author.
3. Waste Management Based Distribution Benefit Approach
The management of waste based on the distribution method involves the processing of waste to produce recycled and reusable products and renewable energy for the benefit of all involved entities. An example of this is the conversion of waste into renewable energy to be distributed to entities generating this waste such as the fish processing operators, port operators, fishermen, and the residents of Denpasar City. It is important to note that some studies have been conducted on the processing of waste and the distribution of their benefits to all parties involved [9][12][16,24].
One of the most important environmental contamination sources is industrial waste, such as the by-products of the fish processing plant, in this case [13][14][27,28]. This is indicated by the analysis of a previous study, which showed that the quality and quantity of the wastewater produced by XYZ fish processing company is beyond the acceptable standard [15][29]. This makes it important to explore the appropriate management strategies for fish waste considering their potential as fish feeds as well as others such as biodiesel, chitosan, gelatin, fish oil, jewelry, flavor, and fertilizer [16][17][30,31]. Previous studies developed several methods to convert this waste into useful products [18][32].
Benoa Fishing Terminal (BFT) was combined with a port complex to serve as a hub-port for both tourism and fishing industries, specifically in relation to Eastern Indonesian fisheries. The port has three main fishing commodities including tuna, sardine, and squid, which have always dominated both the export and domestic markets annually (BKIPM Benoa, 2017–2021). These products generate both solid and liquid waste, which need to be analyzed to determine their possible response to the implementation of a circular economy in BFT. It is important to note that the solid waste normally generated from fish and squid processing produces different by-products, and this means they need to be discussed separately while the liquid waste is the same.
Solid by-products during fish processing generally include the head, skin, viscera, and bones, which are usually made into fish meal or fertilizer [19][33]. According to Vatria (2020) [17][31], the percentage by weight of the physical composition of fish is 21% head, 7% intestine, 5% liver, 14% bone, 10% fin, 3% skin, 36% meat (fillet), and 4% for others. This agrees with the findings of Babbit (1990) [20][34] that the weight of fish waste or by-products during the fish processing is approximately 50% of the total weight of the fish, while the solid waste is 4–5% skin, 21–25% head, and 24–34% bone for whitefish and solid waste of 40–45% total for fatty fish [21][35]. The other main product is squid and its parts mainly used include the fins, mantle, and tentacles while others such as viscera, head, skin, and pen are generally categorized as waste [22][36]. The weight of this waste is between 22–50% of the total [23][37]. Meanwhile, 1 ton of squid waste contains 7 kg of pen, 4 kg of ink, 589 kg of internal organs, and 65 kg of skin when it is processed properly. It is also important to note that the squid ink waste was estimated to be 1.3% of the total weight [24][38] and it is composed of 15% melanin and 5–8% protein as well as free amino acids consisting of taurine, glutamate, and tyrosine [24][25][26][38,39,40]. A previous study also showed that 1 ton of squid waste contains 0.6 kg melanin, 16.4 kg collagen, 46.1 kg biodiesel, and 1.45 kg chitin [22][36] while squid pens have 42.5% protein [27][41]. A whole squid waste including the ink, pen, skin, and viscera can easily be directly processed to produce squid liquid fertilizer such that 946 L can be obtained from 1 ton of the waste [22][36].
It was previously stated that liquid waste from fish and squid processing is the same. The fishery product processing industry consumes water up to 20 m3/ton of product produced depending on the technology used, the type of fish processed, and the product [28][42]. It was also explained by Overseas Fishery Cooperation Foundation (1987) that liquid waste is mostly generated from four fishery processing activities, including freezing, general processing, canning, and fish meal/oil. Meanwhile, most of the activities at the Benoa fishing terminal are based on freezing and general processing, which produce 14.9 m3/hour of liquid waste. This is different from solid waste, which is based on the product being processed, and this is the reason the determination of the quantity generated from tuna and squid requires different approaches.
4. Domestic Waste Management
The solid waste from the vessels is due to the operational activities, while those from the terminals are associated with land installations, facilities, infrastructure, and fish processing plants at the BFT [29][30][43,44]. It is also important to note that this waste varies based on the different activities being conducted in the vessels and they include general, hazardous, and kitchen waste separated based on an international classification established by the Annex V of the MARPOL Convention 1973/1978. The volume of the waste mostly depends on the size, gross tonnage, number of crew on board, and the duration of the voyage. Meanwhile, those from the port activities usually come from the industries and buildings in the port area such as canteens, markets, offices or stores, restaurants, and others. Studies on the solid waste generated by vessels are very few and every approach used in the analysis produces different results, but the average in each vessel was found to be 3.06 kg per person per day [31][32][33][45,46,47]. Moreover, three Wastewater Treatment Plants (WWTPs) facility was planned to be constructed at BFT, with one designed to treat wastewater from the fishery processing plants. It was discovered that they are currently able to handle the constantly varying quantities and concentration of wastewater produced daily [34][48], leading to the production of sludge which is an avoidable problem. This sludge contains a fair number of different contaminants that can produce substances considered to be harmful to health when they are not handled and disposed of properly [35][49].
5. Bilge Waste Management
It has been discovered that approximately 1-2% of the heavy fuel oil burned in a vessel’s main engine and generators end up as a sludge (Interpol, 2007). It is preferable to recycle the sludge with a low solid concentration of less than 30% and a high oil concentration above 50% [36][50]. Meanwhile, it was suggested in another study that those with a low oil concentration of less than 10% are also eligible for oil recovery treatment [37][51].