Due to the increasing maintenance costs of hydraulic machines related to the damages caused by cavitation erosion and/or erosion of solid particles, as well as in tribological connections, surface protection of these components is very important. Up to now, numerous investigations of resistance of coatings, mainly nitride coatings, such as CrN, TiN, TiCN, (Ti,Cr)N coatings and multilayer TiN/Ti, ZrN/CrN and TN/(Ti,Al)N coatings, produced by physical vapor deposition (PVD) method using different techniques of deposition, such as magnetron sputtering, arc evaporation or ion plating, to cavitation erosion, solid particle erosion and wear have been made. The results of these investigations, degradation processes and main test devices used are presented in this paper. An effect of deposition of mono- and multi-layer PVD coatings on duration of incubation period, cumulative weight loss and erosion rate, as well as on wear rate and coefficient of friction in tribological tests is discussed. It is shown that PVD coating does not always provide extended incubation time and/or improved resistance to mentioned types of damage. The influence of structure, hardness, residence to plastic deformation and stresses in the coatings on erosion and wear resistance is discussed. In the case of cavitation erosion and solid particle erosion, a limit value of the ratio of hardness (H) to Young’s modulus (E) exists at which the best resistance is gained. In the case of tribological tests, the higher the H/E ratio and the lower the coefficient of friction, the lower the wear rate, but there are also many exceptions
- PVD coating
- nitride coating
- cavitation erosion
- solid particle erosion
- tribological wear
Note:All the information in this draft can be edited by authors. And the entry will be online only after authors edit and submit it.
1. Introduction
Hydraulic machines especially in hydropower plants are exposed to erosion caused by cavitation and/or solid particles that move with the flowing water. Erosion of the hydro turbines has become a serious economic issue due to maintenance costs and loss of efficiency caused by surface degradation. Despite using computational fluid dynamics simulation to optimize the design of water turbines and minimize the level of erosion, the problem of erosion has not been fully resolved [1]. The need for more and more efficient and reliable machines requires increasingly resistant materials. The cost of elaborating and producing new highly resistant materials, as well as the production of machines from these materials, can be very high. Since in many cases the surface of working elements or machines is exposed to the harmful environment, the use of protective coatings allows improving the reliability and maintain manufacturing cost at reasonable level. There are many methods of production of protective coatings, such as spraying processes, which include plasma spaying [2,3], high-velocity oxygen-fuel (HVOF) spraying [4,5] and also physical vapor deposition (PVD) method [6–9]. The last method allows producing coatings with a wide range of properties. Hardness of the coating can be in the range from 5 GPa for Ti11Mg29Gd2N58 coating to 45 GPa for CrCN/CrN coating with 1 μm thick layer of tetrahedral carbon [10,11]. However, this method also allows producing reflective coatings, e.g., Nb2O5/SiO2 coating, with a hardness even lower than 1 GPa [12]. Coatings of high hardness are mainly used for anti-wear applications, as protective coatings for tools and knives [13,14], and for anti-erosion applications [15–17]. For that reason, resistance to sliding wear [10,18], tribological properties [19], fracture toughness [16,20], fatigue toughness [6,21], solid particle erosion resistance [22,23] as well as cavitation erosion resistance [24,25] have been deeply investigated. Endurance properties of PVD coatings depend on their hardness, elastic modulus, adhesion, residual stresses and structure [26–28]. The possibility of creating coatings with a wide range of properties, by appropriate selection of deposition conditions and coating structure (mono-or multilayer) makes them becoming more and more popular.
Among the listed types of damage, erosion is the most complex one because of simultaneous action of several types of degradation. In each erosion process, e.g., solid particle erosion or cavitation erosion, the material surface is exposed to multiple short-lasting and high velocity impacts that act on a very small area in an aquatic environment that promotes corrosive processes. Thus, the erosion process includes such damage processes as: dynamic fracture in micro-volumes, fatigue in micro-volumes, and corrosion. Hence, erosion resistant materials should be resistant to the mentioned damage processes [29,30]. Most of the investigations prove that deposition of PVD coatings improve fatigue resistance [31–42]. However, according to References [35,39,41,43], deposition of PVD coating may also decrease fatigue resistance or has no effect on fatigue resistance [36,42] in comparison to that of substrate material. The improvement of fatigue resistance of the material by deposition of PVD coatings depends on the following factors: coatings properties, substrate properties and test conditions. Among coating properties, very important are adhesion, fracture toughness, hardness (H) and Young’s modulus (E), resistance to plastic deformation (H/E and H3/E2 ratios), surface roughness and also coating thickness. Since with the increase of the H/E and H3/E2 ratios increases the tendency of the coating to brittle fracture, these parameters are also considered as a measure of stiffness. Among substrate properties, the most important are hardness, Young’s modulus and also fracture and fatigue toughness. In case of fatigue, very important are such test conditions as frequency and a load ratio, R. In case of tests performed with R = −1, deposition of PVD coatings leads to improvement of fatigue endurance in most cases [31,36,38,44], while in case of R = 0.1, the fatigue endurance depends on the coating thickness and material of the coating [45]. With increasing thickness of PVD coating, the fatigue resistance decreases [36,41,45]. However, the results of fatigue tests also depend on the substrate material. For example, TiN coating deposited on 316L steel and tested at R = −1 and 50 Hz increased about 22% fatigue limit [31], while deposited on Ti–6Al–4V alloy caused about 24% decrease in fatigue endurance [43]. Testing TiN coating deposited on Cr–Mo–V steel at R = −1 and 10 Hz, the fatigue limit increased only about 7% [45]. Despite some negative results of obtained in fatigue tests of PVD coating, many investigations confirmed improvement of fatigue strength by depositing PVD coating. Thus, the improvement in fatigue strength along with high hardness contributed to the interest in these coatings as protective coatings against erosion (cavitation, water droplets and particle erosion).
Resistance to erosion or wear increases with increasing duration of incubation period, decreasing cumulative weight or volume loss, as well as decreasing erosion rate. Erosion or wear resistance is usually determined as the inverse of the erosion/wear rate, which in turn is determined in erosion/wear tests. Recent investigations of bulk materials and PVD coatings showed that the test conditions and erosion intensity highly influence the erosion rate [25,46,47]. The test conditions depend on the construction of test devices. There are many types of cavitation erosion and solid particles test devices [48–50]. Some of them generate very intensive erosion, some low and some allow modification of test conditions and testing at different erosion intensities. This is the reason why the tests results may be different, sometimes contradictory. In addition, it is difficult to compare the tests results performed at different devices.
Because the material property that has largest impact on resistance to cavitation erosion, solid particle erosion and wear is hardness [50,51], hard coatings are tested as anti-erosion and anti-wear coatings [52–55]. In the case of PVD coatings, the properties affecting their resistance to erosion depend on such factors as the technique and parameters of deposition [40,41,43], the coatings thickness [38,41,45,56–58], the type of PVD coating (monolayer or multilayer coating) [21,33,36,59–63] and the substrate properties [64].
2. Resistance of PVD Coatings to Cavitation Erosion
The phenomenon of cavitation erosion consists in the degradation of the material surface as a result of multiple impacts of micro-jets formed during the implosions of cavitation bubbles. Cavitation erosion resistance of materials is tested using mainly ultrasonic devices compliant with the ASTM G-32 standard (Figure 1) [30,53,65–69]. The ASTM G-32 standard allows performing tests in the direct and indirect methods (Figure 1). In the direct method, a tested sample is fixed to a vibrating horn (Figure 1a), while in the indirect method the sample is stationary and is placed on the table/holder opposite the vibrating horn (Figure 1b). Another test device used to test material resistance to cavitation is a cavitation tunnel with a system of barricades (Figure 2) [25]. There are many different cavitation tunnels, but most of them are designed to study cavitation cloud. The cavitation tunnels allow performing tests at various test conditions, i.e., various flowing liquid speed that affects cavitation intensity, which in turn affects erosion rate.
Cavitation intensity is defined as the energy of imploding cavitation bubbles released into the environment in a unit of space and time [70]. The observation of the cavitation cloud showed that it undergoes a quasi-periodic evolution, which consists in the formation and growth of the cavity, the formation and development of the re-entrant flow and the collapse of the cloud with the generation and propagation of the shock wave [70,71]. Due to the unstable turbulent cavitation flow, accurately determining the cavitation intensity is a problem. Nevertheless, some approaches have been proposed [70,72]. Most methods are indirect methods based on the cavitation pit analysis [73,74]. In case of cavitation tunnels, the flow velocity controls the development of the cavitation cloud and can serve as a measure or indicator of cavitation intensity [75]. Recent studies have shown that slight change in the flow velocity strongly affects the duration of the incubation period and the rate of cavitation erosion of bulk materials and the PVD coating [25,46,75]. Thus, the test conditions associated with the test device have an influence on the obtained test results.
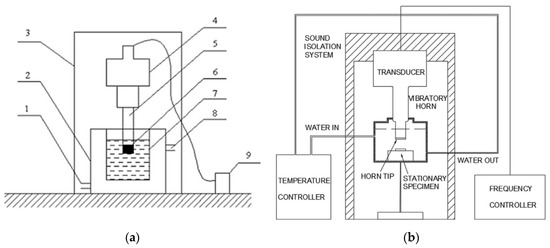
Figure 1. Schematic of the vibratory test devices for (a) testing in a direct method, 1: water inlet; 2: cooling bath; 3: sound-proof chamber; 4: transducer; 5: horn; 6: specimen; 7: beaker; 8: water outlet; 9: ultrasonic generator, reprinted from Ultrasonics Sonochemistry, Reference [29], with permission from Elsevier and for (b) testing in an indirect method, reprinted from Wear, Reference [66], with permission from Elsevier.
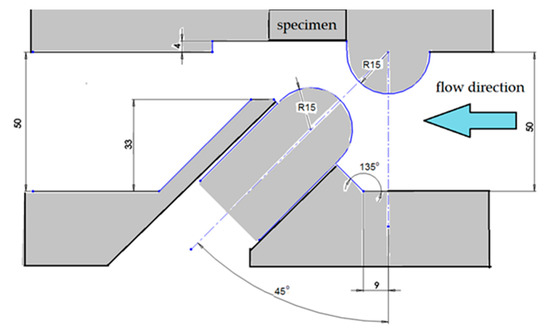
Figure 2. Cavitation chamber with a system of barricades, reprinted from Coatings, Reference [25], published in MDPI.
Monolayer Ti-based PVD coatings were the first PVD coatings widely investigated as protective coatings against cavitation erosion [76]. Tests carried out using an ultrasonic apparatus showed that PVD coatings increased incubation period comparing to uncoated ball-bearing steel. In the case of TiCN and TiN coating with thickness in the range 2.7–3.5 μm, the incubation time increased to about 60,000 and 20,000 s, respectively, compared to 5000 s for uncoated bearing steel. An increase in the incubation period was attributed to the high hardness and high compressive stresses. Nevertheless, an increase in hardness and compressive stresses did not ensure the increase in incubation period. If hardness of TiN coating increased from 24 to 38 GPa and compressive stresses from 600 MPa to 1.4 GPa incubation period shortened to 15,000 s. While the TiCN coating, which had higher hardness and comparable elastic modulus as TiN coating, showed a better capacity for resistance to cavitation erosion than TiN coating. After the entire test, only a slight increase in surface roughness and no significant damage was observed. Thus, hardness promotes, but does not determine, an increase in resistance to cavitation erosion.
Additionally, investigations of about 42 μm thick NiCrAlTi(N) and 4 μm thick TiN coatings confirmed elongating incubation period [77,78]. However, not always elongation of incubation period was obtained. In some cases, a decrease in the incubation period with a simultaneous decrease in the cumulative weight or volume loss of PVD coatings after the long-lasting cavitation erosion test compared to that obtained for uncoated steel (an improvement of cavitation erosion resistance) was noted (Figure 3) [79]. The decrease in cumulative volume loss caused by PVD coating was noted in many works, e.g., in References [77,80–82]. However, some studies showed that the deposition of a hard PVD coating does not always provide extended incubation time and/or improved resistance to cavitation damage [46,67,79,83]. The 2.7 μm thick TiN coating deposited on Ti6Al4V alloy had no incubation period and a very high erosion rate compared to the uncoated substrate (Figure 4a) [67]. Additionally, the 3.7 μm thick TiN coating deposited at 500 °C on austenitic steel decreased the resistance to cavitation erosion [83]. Lastly, the 3.7 μm thick CrN/CrCN coating deposited on austenitic steel increased the incubation period, but after this period the resistance to cavitation erosion decreased (Figure 4b) [46].
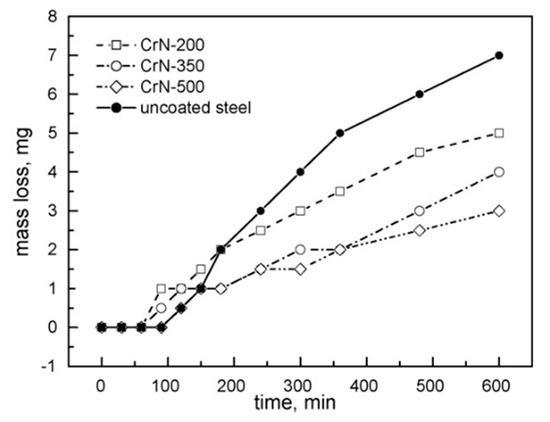
Figure 3. Cavitation curves of 3.7 μm thick Cr-N coatings deposited on X6CrNiTi18-10 stainless steel by means of the cathodic arc evaporation method and uncoated stainless steel reprinted from Wear, Reference [79], with permission from Elsevier.
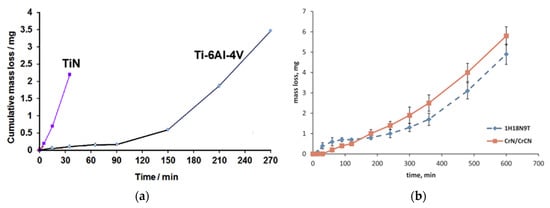
Figure 4. Cavitation curves of (a) 2.7 μm thick TiN coating deposited on Ti6Al4V alloy by means of an unbalanced magnetron spattering method, reprinted from Journal of Alloys and Compounds, Reference [67], with permission from Elsevier and (b) 4.3 μmthick CrN/CrCN coating deposited on austenitic steel by means of a cathodic arc evaporation method, reprinted from Wear, Reference [46], with permission from Elsevier.
A decrease in incubation period noted in Reference [79] was caused by the removal of micro-droplets created during coating production. Micro-sized droplets are formed in the plasma due to micro-explosions and nearly always occur on the surface of PVD coatings [84–86], especially the ones produced using cathodic arc evaporation method [79,86,87]. Density and size of droplets depends on the deposition parameters [88–90]. TiN and CrN coatings deposited at 400 °C had about 40% higher density of droplets than those deposited at 200 °C [88]. With increasing deposition pressure from 0.1 Pa to 1.2 Pa, density of droplets decreased about 46% [89]. An increase of bias voltage from −70 to −150 V also decreased droplets density [91]. Similar result, i.e., a decrease in droplet density with increasing bias voltage was obtained in Reference [92].
Because droplets are mostly metal droplets, they have different crystallographic structure than the surrounding coating. In case of TiN coating, droplets have the hexagonal close-packed (hcp) crystal structure of α-Ti [59], while TiN coating has the NaCl structure. The removal of droplets causes reduction of incubation period and leads to the formation of pinholes on the coating surface that act as stress concentrators that initiate cracks [93]. For that reason they are treated as defects. Development of cracks through pinholes in Cr-N coating is shown in Figure 5. Nevertheless, high density of tiny droplets does not affect the resistance to cavitation erosion [92].
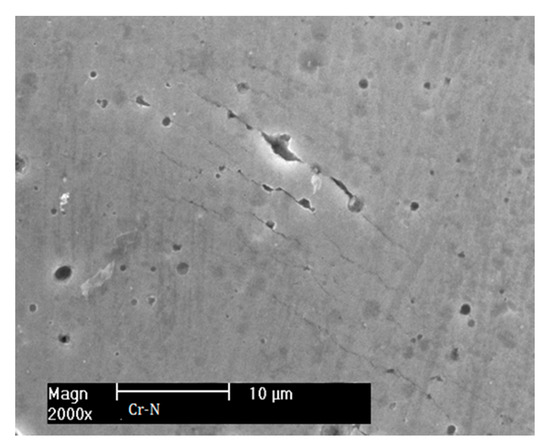
Figure 5. Development of a crack thorough pinholes in 4 μm thick Cr-N coating deposited on X6CrNiTi18-10 austenitic steel by means of a cathodic arc evaporation method (own investigations).
Studies performed using the cavitation tunnel revealed micro-undulation of 4 μm thick TiN coating (Figure 6a) [25,94]. Similar effect was observed in 3.78 μm thick NiTi coating tested using the indirect method in a vibratory test device (Figure 6b) [80]. However, in some studies, which used the direct method in a vibratory test device, micro-undulation was not observed [24,77,95]. The reason can be cavitation intensity and/or coating properties (stiffness/plasticity, adhesion and thickness). According to Reference [96], as the thickness of the coating increases, the susceptibility of PVD coatings to undulations decreases. This is connected with increasing compressive residual stress [97,98]. The residual stresses depend on the deposition parameters, e.g., with increasing bias voltage from −40 to −85 V, compressive residual stresses in 2 μm thick Ti45Al55N coatings increased from −0.1 to −5.7 GPa at the depth of 0.5 μm [99].
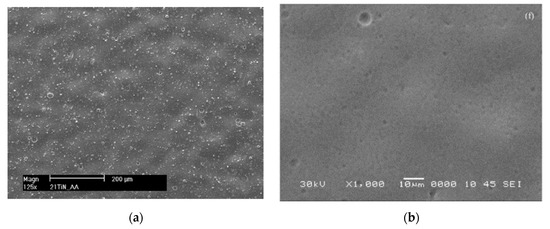
Figure 6. Undulation of (a) 3.6 μm thick TiN coating deposited on X6CrNiTi18-10 steel by means of a cathodic arc evaporation physical vapor deposition (PVD) method, reprinted from Engineering Failure Analysis, Reference [94], with permission from Elsevier and (b) 3.78 μm thick NiTi coating produced on mild steel using the filtered arc deposition PVD method, reprinted from Wear, Reference [80], with permission from Elsevier.
According to References [64,77,81,92,94,100,101], the ability of PVD coatings to resist cavitation erosion also depends on the mismatch of the hardness and stiffness of the coating to the substrate (H/E and H3/E2 ratios), the thickness of the coating, as well as the adhesion of the coating to the substrate. As the resistance to plastic deformation increases, the coating needs more impact energy to develop cavitation damage, so the resistance to cavitation erosion also increases [24]. For about 4 μm thick TiN coatings, the resistance to cavitation erosion increases with increasing H/E ratio from 0.049 to 0.058 [92]. In the case of about 3 μm thick NiTi/TiCN coatings, an increase in resistance to cavitation erosion was noted for an increase in H/E ratio from 0.026 to 0.046 [24]. However, there are limit values of these parameters above which the resistance to cavitation erosion decreases [46,79,81,92]. For 4 μm thick TiN coatings, the critical H/E ratio was about 0.065 (Figure 7) [92]. TiN coatings with H/E ratio of about 0.078 had erosion rate similar to those with H/E ratio of about 0.55. An increase in erosion rate is connected with the change of the degradation mode from ductile to brittle. In the brittle mode, fracture requires less energy than in the ductile mode and therefore cracks develop very rapidly. This was the reason that 4 μm thick CrN/CrCN coating with H/E ratio of 0.102 had erosion rate higher than that of austenitic stainless steel indicating on low resistance of the coating to cavitation erosion [46]. However, 8% decrease in flow rate resulted in 24% decrease of the erosion rate of the CrN/CrCN coating and about a 3-fold increase in duration of substrate protection by the coating [25]. Thus, a slight change in cavitation intensity (flow rate in flowing cavitation) caused an essential influence on erosion rate. This showed that cavitation erosion rate is not only related to coating properties, but also to flow conditions [46,75].
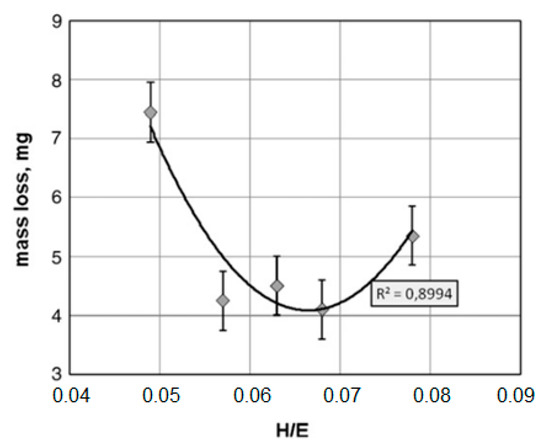
Figure 7. Correlation between H/E ratio and mass loss in cavitation tests of 4 μm thick TiN coatings deposited on X6CrNiTi18-10 steel by means of a cathodic arc evaporation PVD method, reprinted from Surface and Coatings Technology, Reference [92], with permission from Elsevier.
The improvement in cavitation erosion resistance due to deposition of monolayer coatings motivated to investigate multi-layer PVD coatings. Investigations of mono- and multilayer coatings of chromium and chromium nitride showed that metallic 6 μm thick Cr coating had better cavitation erosion resistance than 1.2 μm thick CrN coating and 7.2 μm thick CrN/Cr coating, despite lower hardness (Figure 8) [102]. In addition, an increase in coating hardness had a slight effect on the cavitation erosion resistance. The resistance to cavitation erosion of CrN coating with higher hardness was comparable to that of CrN/Cr coating with lower hardness. Lack of correlation between PVD coating hardness and cavitation erosion resistance was also obtained in Reference [77], in which NiCrAlTi(N) coatings were tested. On the other hand, in the case of 4 μm thick TiN/Ti coatings of various hardness, the resistance to cavitation erosion increased with increasing coating hardness [103]. In the case of chromium-based coatings [102], an increase in resistance to cavitation erosion was related to adhesion. Additionally, in Reference [92], the cumulative weight loss decreased with increasing coating adhesion. Such correlation was not noted in investigations of 4 μm thick TiN/Ti coatings [103]. Nevertheless, comparing the results obtained in Reference [92] and Reference [103], the 4 μm thick multilayer TiN/Ti coating had better resistance to cavitation erosion than 4 μm thick TiN coating. This improvement was attributed to lower stiffness of the multilayer coatings (lower H/E ratio) and the cushioning of cavitation impacts by soft metallic Ti layers. Investigations of stress distribution in the coating under impacts showed a decrease in stress at the metallic interlayers [104]. In addition, the resistance to plastic deformation represents better than hardness alone coating the ability to resist cavitation erosion.
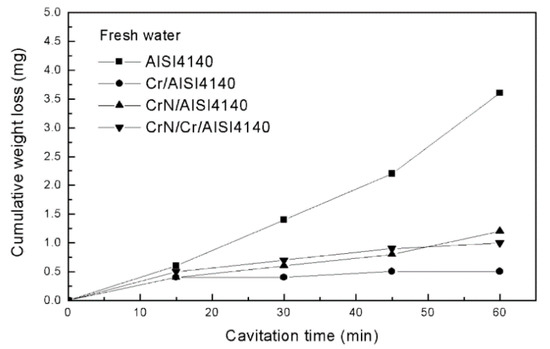
Figure 8. Cavitation curves of 6 μm thick Cr coating deposited on AISI 4140 steel by commercial electroplating using Atotech HEEF 25 as a catalyst, 1.2 μm thick CrN and 7.2 μm thick CrN/Cr coatings deposited on AISI 4140 steel by means of a cathodic arc evaporation PVD method, reprinted from Surface and Coatings Technology, Reference [102], with permission from Elsevier.
Investigations of the resistance of Ti–Si–C–N and Ti/Ti–Si–C–N coatings with thickness in the range from 36 to 68 μm deposited on 2Cr13 steel to cavitation erosion in corrosion aggressive medium (3 wt.% NaCl solution) showed that the thickness of coatings had higher impact on the resistance than coating structure (mono- or multi-layer coating) in opposition to the results obtained in distilled water [95]. In distilled water, the best resistance to cavitation erosion was found in the thinner coating, while in 3 wt.% NaCl solution—the thickest coating. The multi-layer structure of the coating improved the resistance only in the distilled water. Despite many studies, there is still a need to search for factors determining the resistance of PVD coatings to cavitation erosion.
3. Resistance of PVD Coatings to Solid Particle Erosion
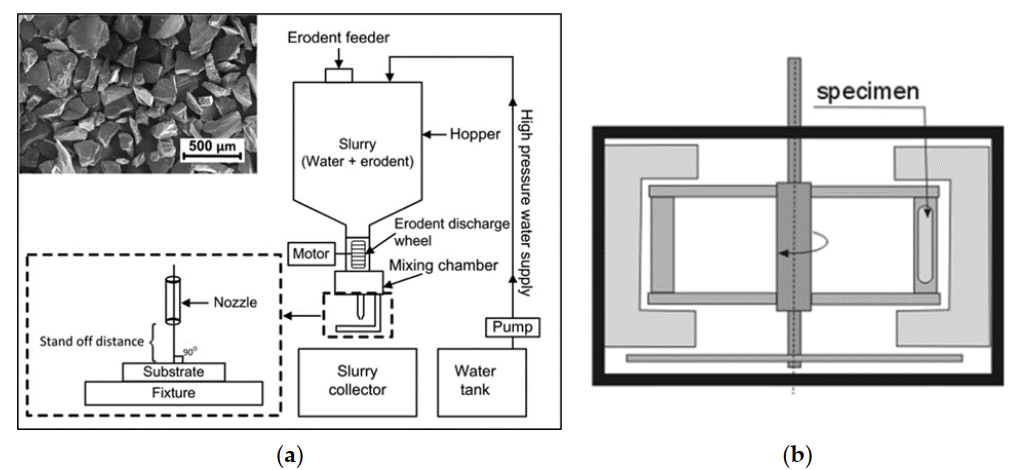
Since 1988, hard PVD coatings have been investigated as the protective coatings against solid particle erosion [105,106]. Among many test devices, very popular are the solid particle jet and slurry pot devices [49,107]. Unlike devices for cavitation erosion testing, many devices are designed to meet the individual needs of researchers. Most slurry pots are similar in design, but the jet type apparatus can vary significantly. The examples of the devices are shown in Figure 9.
Figure 9. The examples of (a) a jet type apparatus, reprinted from Wear, Reference [108], with permission from Elsevier and (b) a slurry pot, reprinted from Engineering Failure Analysis, Reference [109], with permission from Elsevier.
Similarly to cavitation erosion investigations, erosion rate of the coatings depends on many factors that are related to coating properties (hardness, elastic modulus, ratio of hardness to elastic modulus, total coating thickness, number and thickness of layers in multilayer coating, residual stress), substrate properties and test conditions (type and size of solid particles as well as angle and velocity of impacts) [82,110–113].
Early investigations of TiN coatings showed that weight loss of 10 μm thick coatings was bigger than that of 3 μm thick coatings for impact velocity of 14 m/s and impact angle of 90° [105]. While if impact velocity increased to 24 m/s and impact angle decreased to 45°, more severe erosion (bigger weight loss) was noted for thinner TiN coating (3 μm thick). Thus, 10 μm thick TiN coating better protect substrate at higher impact velocities, while 3 μm thick coating at lower impact velocity.
Besides impact velocity, substrate properties also affects the protective properties of PVD coatings. In the case of deposition of 10 μm thick TiN coating on austenitic steel substrate, the improvement in erosion resistance in the testes performed at impact velocity of 24 m/s was about 8 times compared to 3 μm thick TiN coating, while about 3 times, when mild steel was used as substrate material [105]. Thus, regardless of the substrate, an improvement in erosion resistance was obtained. Subsequent studies confirmed the improvement in erosion resistance (a decrease in cumulative weight loss/volume loss or erosion rate) due to deposition of hard PVD coatings [110,111,114].
Investigations of an influence of coating thickness on erosion rate did not show any general correlation. The studies of (Ti,Cr)N coatings with thickness from about 13 μm to about 26 μm showed that the impact angle is a more critical parameter [112]. In the case of an alumina impacts at 30°, all coatings (Ti,Cr)N have better resistance than the uncoated Ti–6Al–4V substrate. While for 90° angle of impingement, the erosion resistance depended on the content of chromium in the (Ti,Cr)N coating. As the chromium content increased and hardness decreased, the resistance also decreased. Thus, the resistance was related to coating hardness. 6 μm thick TiN coating deposited on austenitic stainless steel reduced 20 times erosion rate after 200 min of testing compared to that of uncoated substrate when SiC abrasive particles with 26 GPa hardness impacted at 8 m/s [110]. In case of 8 μm thick TiN coating, erosion rate was reduced by 13 times after 24 h of testing, when a slurry pot device and a speed of 2000 rpm were used [82]. Thus, TiN coating with higher thickness improved the erosion resistance less.
Good results of deposition of monolayer PVD coatings increased interest in multilayer coatings as anti-erosive coatings [115]. Properties of multilayer coatings can be modified by material, number and thickness of each layer and bilayer periods. Multilayer coatings can be divided into ceramic-metallic coatings, e.g., TiN/Ti coatings, or ceramic–ceramic coatings, e.g., CrN/CrCN coatings. Ceramic-metallic coatings have usually lower hardness and Young’s modulus than ceramic–ceramic coatings [116,117]. In case of ceramic-metallic coatings, e.g., ZrN/CrN and TiAlN/TiSiN, hardness of multilayer coating is higher than hardness of each ceramic monolayer coatings [21,91]. However, investigations of the impact of hardness of TiN-based multilayer coatings on the erosion resistance did not show any correlation [22].
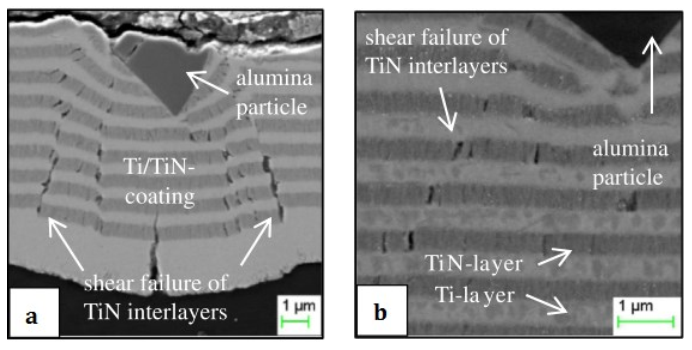
Investigations of an effect of the thickness and number of bilayers in PVD coatings showed that they play a key role in erosion resistance [16,118]. Comparison of erosion rate of monolayer TiN coating and multilayer TiN/Ti coatings with various number and thickness of bilayer period showed that an increase of period number with decreasing their thickness cause an increase in weight loss [16]. A similar result was obtained by testing the TiN/Ti coating for resistance to cavitation erosion [103]. High compression and tensile stresses on the surface and under the surface of every TiN layer, respectively, initiated cracks and were the reason of increasing erosion. So, thick TiN layers decreased erosion resistance and the fewer TiN layers, the fewer vulnerable regions with high tensile stress [16]. Similar to Reference [16], better erosion resistance of Ti monolayer coating in comparison to TiN/Ti multilayer coating was obtained in Reference [118]. On the other hand, increasing number of layers within TiN/Ti coatings did not increase erosion rate like in Reference [16], but increased time required for a coating to fail [118]. The likely reason was the constant thickness of TiN and Ti layers. Due to high stiffness of TiN layers, they have a lower deformation capacity, and the dynamic impact of solid particles causes shear cracking, while the soft Ti layers remain undamaged (Figure 10) [118].
Figure 10. Shear fracture in TiN/Ti coatings with a thickness of (a) 10 μm and (b) 30 μm deposited on polymer matrix composite by means of a magnetron spattering method, reprinted from Wear, Reference [118], with permission from Elsevier.
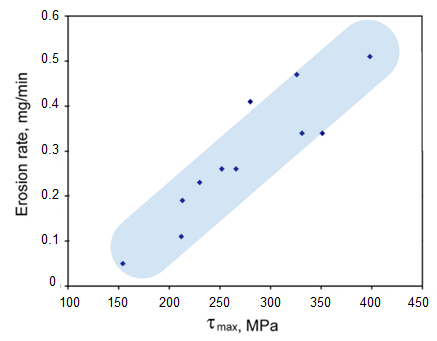
An effect of residual stresses on erosion resistance of TiN/Ti multilayer coatings with thickness in the range from 5 μm to 20 μm was investigated in Reference [22]. In opposition to earlier investigations of TiN/Ti coatings with thickness of 16 μm [16], no correlation between erosion rate and tensile stresses was noted. Nevertheless, the correlation between erosion rate and shear residual stresses in multilayer PVD coatings was obtained. The lower maximum shear stress, the lower erosion rate (Figure 11) [22]. Considering the results from References [16,22,118], the ductile metallic layers have a significant influence on the residual stresses and erosion resistance.
Figure 11. Correlation between erosion rate and maximum shear stress in Ti/TiN and Ti/Ti(V,Zr)N multilayered coatings with thickness from 5 to 20 μm deposited on Ti-6Al-4V alloy by the Arc-PVD method, reprinted from Wear, Reference [22], with permission from Elsevier.
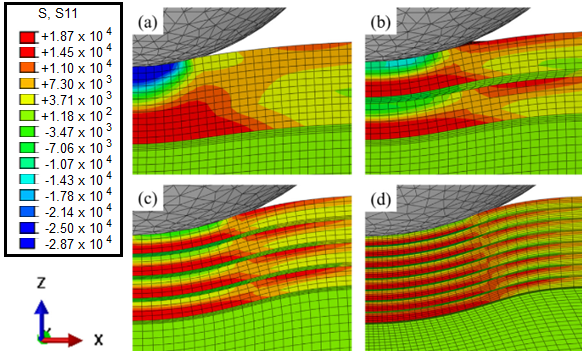
An effect of the properties of metallic interlayer in 20 μm thick TiN/M coatings, where M was Ti, Zr, Hf and Nb metallic layer, was investigated in Reference [116]. It was obtained that the properties of solid particles (size and hardness), more than the metallic interlayer and coating properties, affected erosion resistance. In addition, no correlations between mechanical and endurance properties of interlayer material and cumulative weight loss of TiN/M multilayer coatings and the tests conditions were noted. In the case of 204 μm glass beads impacted at 75 m/s, the TiN/Hf coating had the best erosion resistance, while the TiN/Zr coating the worst followed by the TiN/Ti coating. Using 56 µm alumina, the TiN/Ti coating had the lowest cumulative weight loss, while the TiN/Zr and TiN/Hf coatings had comparable very high weight losses indicating on very low erosion resistance. One of the causes of the different results may be the change of degradation mechanism. The second was the stress distribution in the coating resulting from the impacts of solid particles. Calculation of stresses in a monolayer (i.e., one thin Ti interlayer and much thicker TiN layer) and TN/Ti multilayer coatings showed significant decrease in interfacial axial stress in metallic interlayer [104]. Calculations of stresses in the coating showed that each TiN layer has compressive stresses on top and high tensile stresses at the bottom [16]. Increasing the number of bilayers with decreasing their thickness reduces compressive stresses and increases tensile stresses until they begin to dominate the coating (Figure 12). Thus, increasing number of bilayers in the TiN/Ti coating increases tensile stress that promoting cracking leading to increase in erosion rate.
Figure 12. Stress fields in the 16 μm TiN coating (a) and the 16 μm TiN/Ti multilayer coatings with the bilayers number of (b) N = 2, (c) N = 4 and (d) N = 8 deposited on Ti-6Al-4V alloy by combining the techniques of a filtered cathode vacuum arc and a metal vapor vacuum arc ion implantation, reprinted from Surface and Coatings Technology, Reference [16], with permission from Elsevier.
In multi-layer ceramic–ceramic coatings, e.g., TiN/(Ti,Al)N coating, compressive residual stresses occur in both ceramic layers but they are not the same in both layers [59]. Regardless of the substrate, the stresses in the TiN layer are about 2 times greater than in the (Ti,Al)N layer. In addition, hardness and thermal expansion of the substrate affect the amount of stresses. For austenitic steel (AISI 304) substrate, which is a ductile material with low hardness and high thermal expansion, the stresses in both coatings are higher than those developed in the coatings deposited on cold work tool steel (AISI D2), which has higher hardness and lower thermal expansion.
Another factor influencing the rate of erosion is corrosion resistance. The occurrence of tensile and compressive stresses as well as the different phases in the multi-layer metal-ceramic coating favor corrosion. In the case of TiN/Ti coatings with thickness ranged from 20 to 22 μm, they become more susceptible to corrosion with increasing thickness of the Ti layers from 0.2 to 1 μm [119]. Columnar boundaries of TiN grains, pinholes and voids in TiN layers become the diffusion paths of corrosive media into the Ti layer, which reacts with oxygen and undergoes internal oxidation and forms TiO2. As a result, corrosion pits are formed. They are often sources of cracks, contributing further to the increase in erosion rate.
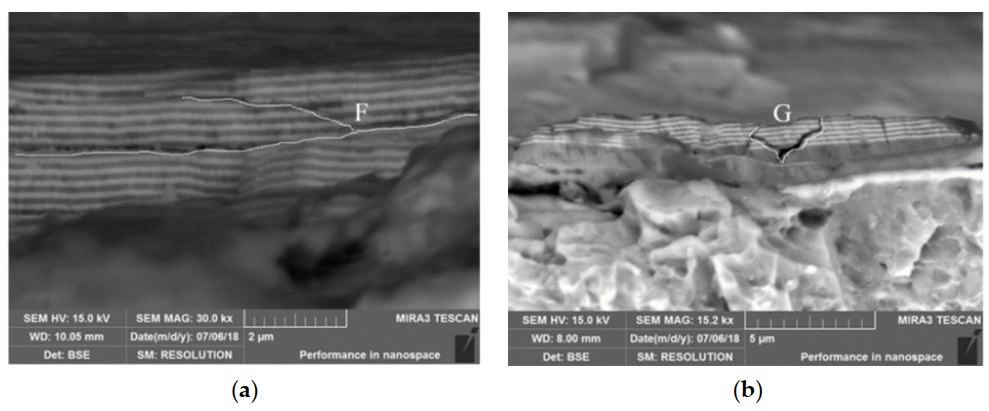
As it was shown in Reference [59], in ceramic–ceramic multilayer coating, only compressive stresses occur. Therefore, the problem of corrosion and the weakening of the structure in multilayer coatings by corrosion pits are avoided. In addition, ceramics do not oxide. Investigations of 10 µm thick TiN/ZrN multilayer coating showed that its erosion rate was 15.5 times lower than that of the uncoated substrate, despite the high erosion aggressiveness (quartz sand particles impacted with a velocity of 100 m/s) [111]. The degradation of the coating occurred as a result of the initiation of a crack inside the coating, which continued to propagate through subsequent layers, branching (marked by letter G in Figure 13b) and deflecting (marked by letter F in Figure 13a).
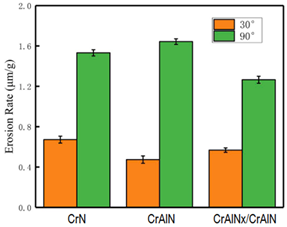
The erosion rate in solid particle erosion depends on the impact angle. For hard and stiff materials, the highest erosion rate is expected at an impact angle of 90°. Investigations of CrN, CrAlN and CrAlNx/CrAlN coatings with thickness of about 2 μm showed that all coatings had lower erosion rate at the impact angle of 30°, which is in accordance with the mentioned rule [9]. These investigations also showed that depending on the impact angle, different coating achieved the lowest erosion rate (Figure 14). If the impact angle was 30°, the CrAlN coating had the lowest erosion rate. However, if the impact angle increased to 90°, CrAlNx/CrAlN coating had the lowest erosion rate. The analysis of the coating properties indicated that resistance to solid particle erosion was related to residual stresses [9]. CrAlN coating, which had the biggest compressive residual stresses (−1.569 GPa), was the most resistant to abrasion, which occurs at an impact angle of 30°. In contrast, the CrAlNx/CrAlN coating, which had the lowest compressive residual stress (−0.932 GPa), was the most resistant to impacts at normal angles. The reason is probably the ability of the coating to absorb some of the impact energy.
Figure 13. Development of a crack in 10 µm thick TiN/ZrN multilayer coating deposited on Ti-6Al-4V alloy using PVD equipment (Pro China Limited AS700DTX, Beijing, China); (a) deflection of a crack (marked by letter F), (b) branching of a crack (marked by letter G), reprinted from Coatings, Reference [111], published in MDPI.
Figure 14. Erosion rate of 2.24 μm thick CrN, 1.92 μm thick CrAlN and 2.17 μm thick CrAlNx/CrAlN coatings deposited on TC11 titanium alloy using the arc ion plating technique, reprinted from Vacuum, Reference [9], with permission from Elsevier.
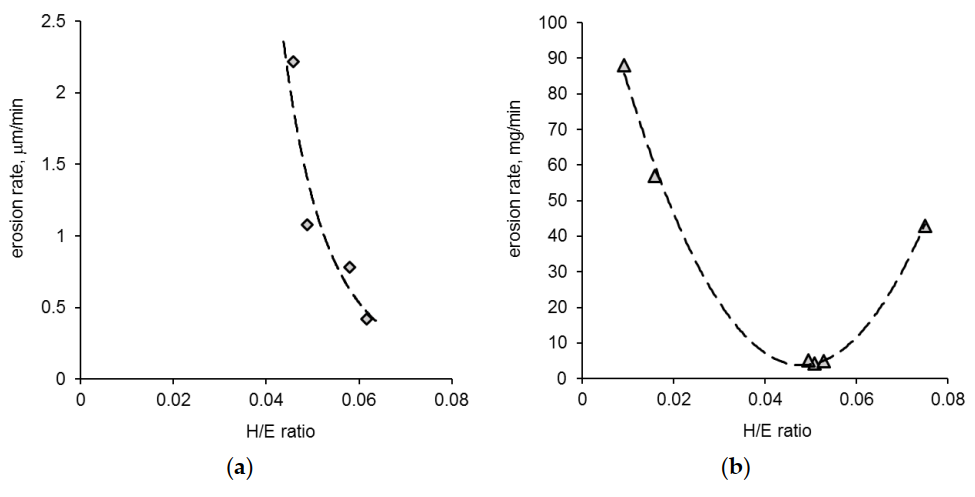
Improvement in the erosion resistance of PVD coatings has been shown to be dependent on many factors, not just one such as hardness. In the previous section was shown that resistance to plastic deformation (the H/E and H3/E2 ratios) strongly affects the resistance of PVD coatings to dynamic impacts. Deng et al. [120] showed that 2 μm thick TiN, CrN, TiAlN and CrAlN coatings deposited on cemented carbide substrate improved erosion resistance that was related to the H3/E2 ratio. The erosion rate decreased with increasing H3/E2 ratio (from 0.035 to 0.123). Using H/E ratio instead, the erosion rate decreased as the H/E ratio increased from 0.0458 to 0.0616 (Figure 15a). Compared to the correlation obtained for cavitation erosion (Figure 7), a similar range of values was obtained. However, based on data in Reference [120], the H/E optimum is difficult to assess. Taking into consideration data from Reference [110] (Figure 15b), the correlation between erosion rate and H/E ratio shows its optimum around 0.05. This value is inconsistent with that obtained in Reference [120]. The reason may be the properties of solid particles or impact velocity. Nevertheless, the correlation obtained has similar shape to that gained in cavitation erosion (Figure 7) indicating the same nature of the relationship. Different values of optimum H/E ratio probably result from different research conditions.
Figure 15. Relation between H/E ratio and erosion rate of various PVD coatings, performed on the basis of on data from (a) Reference [120], (b) Reference [110].
It should be emphasized that despite the identification of the main relations between the properties and erosive resistance of the coatings, there is still a need for research. It results from the fact that the obtained correlations are strongly dependent on the type of coatings and the conditions of the research and many exceptions. As indicated, although the erosion resistance is dependent on the hardness, the harder coating does not always have the best erosion resistance. The same is with other properties.
4. Resistance of PVD Coatings to Wear
Although the tribological tests are different from the erosion tests, their results are often used in analysis of PVD coatings. Therefore, these results are also presented in this paper.
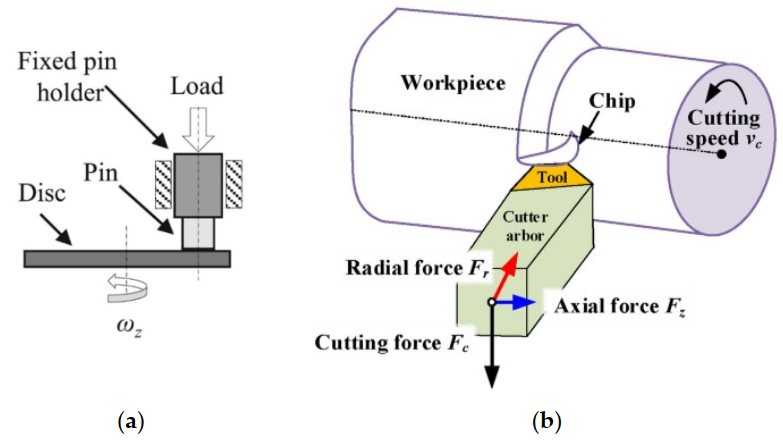
Numerous investigation showed that PVD coatings extend tool life [13,121–123]. The degree of tool lifetime elongation may be in a wide range depending on the factors related to sliding speed, temperature, contact load, sliding length, properties of PVD coatings, substrate and cooperating materials [14,37,88,98,124–127]. In most tribological tests a pin-on-disk, ball-on-plate and rubber-wheel/sand abrasion testing apparatus are mainly used. An example of a pin-on-disc test device is shown in Figure 16a. A ball-on-plate is similar to a pin-on-disc device, but a ball is used. In the case of a pin-on-disk or ball-on-plate device, PVD coating may be deposited on a disc or on a pin/ball. In testing knives, a workpiece is used (Figure 16b) and PVD coating is deposited on a knife.
Figure 16. An example of (a) a pin-on-disc apparatus, reprinted from Tribology International, Reference [128], with permission from Elsevier and (b) an abrasive tool test, reprinted from Journal of Manufacturing Processes, Reference [98], with permission from Elsevier.
As deposition parameters affect properties of PVD coatings, they also affect the wear rate. According to References [88,126], nitrogen and/or acetylene flow rate and deposition temperature essentially affect the wear resistance. An increase in acetylene flow rate causes initially an increase in the wear resistance, but after exceeding a limit value, which is depended on the coating, the wear resistance decreases [126,129]. Thus, there exists a limit value at which the minimum wear rate of the coating is achieved. Investigations of deposition temperature in range between 200 and 400 °C showed that the higher the temperature, the lower the wear rate [88]. In the case of TiN coating, the wear resistance increased about 40%, while for CrN coating about 30%.
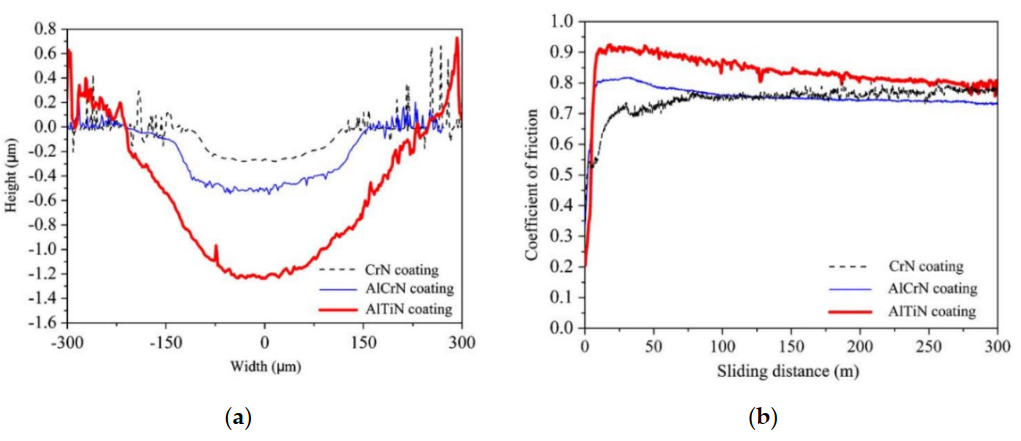
Deposition of TiN monolayer coating at four different DC power values of 200 W, 250 W, 300 W and 350 W on aluminum, brass and mild steel substrate decreased the wear rate and coefficient of friction (CoF) compared to the uncoated substrate [130]. Depending on the substrate, grain size in TiN coating, sliding speed and load, CoF decreased from about 10% to about 25% and wear resistance increased from about 30% to 700%. Although the decrease in CoF was accompanied by a decrease in wear rate, no correlation between them was recorded. In these tests was noticed that regardless of the test conditions, the smaller the grain size, the lower the wear rate and CoF. In Reference [131], there was obtained better protection of 60SMD8 steel substrate (57–59 HRc) against abrasion wear by 0.2 μm thick CrN coating with low CoF, that was in the range between 0.25 and 0.29, compared to 1.3 μm thick W-C: H coating with CoF in the range between 0.34 and 0.38. Thus, the lower the CoF of CrN coating, the lower the abrasion wear, despite the smaller thickness. Other results were obtained for CrAlN coatings with a thickness of around 3 μm: an increase in CoF was accompanied by a decrease in the wear rate [132]. Investigations of CrN, AlCrN, AlTiN and TaN coatings showed no correlation between CoF and wear rate [133,134]. In the case of 2 μm thick CrN and 1 μm thick AlCrN coatings, which had similar CoF in the steady stage, lower wear rate was obtained for 2 μm thick CrN coating (Figure 17) [133]. However, in the initial stage, the highest CoF had CrN coating, while the lowest AlTiN coating. This indicates the initial stage of testing had significant impact on the final wear track. Thus, wear of the coatings was consistent with the initial values of CoF.
Figure 17. Wear track profiles (a) and coefficients of friction (b) of the 2 μm thick CrN, 1 μm thick AlCrN and 2 μm thick AlTiN coatings deposited on cemented carbide (10 wt.% Co and 90 wt.% WC) using the multi-arc ion plating technique, after the entire tests performed at the normal load of 5 N; the sliding velocities of 10m/min; the wear track nominal diameter of 10 mm; the total sliding distance of 300 m, using a Si3N4 ball with diameter of 4mm, surface roughness Ra of 0.02 μm and hardness of HV1600 as the counterpart, reprinted from Tribology International, Reference [133], with permission from Elsevier.
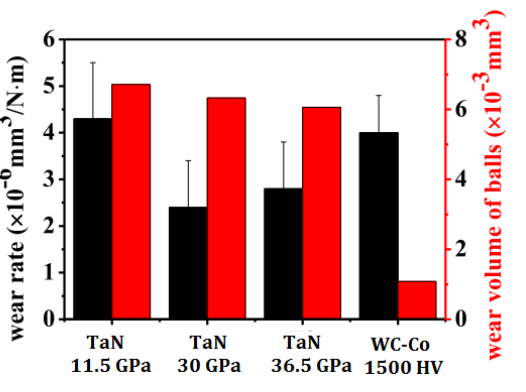
Studies of TaN coatings with a thickness of 2.5∼3 μm showed that deposition of hard PVD coatings does not always guarantee an improvement in wear resistance (Figure 18) [134]. TaN coating with hardness lower than the WC-Co substrate had comparable wear rate to that of substrate. Only TaN coatings with hardness higher than that of WC-Co substrate decreased wear rate. In addition, TaN coating with hardness of 36.5 GPa had higher wear rate than the coating with hardness of 30 GPa. Thus, an increase in coating hardness did not cause a proportional decrease in wear rate. Additionally, investigations of TiAlN(Ag,Cu) coatings with thickness of about 2 μm and hardness ranged from 6.7 GPa to 27 GPa, showed that high coating hardness did not decrease wear rate [135]. TiAlN(Ag,Cu) coating with 11 at.% Ag–Cu content and hardness of 15.2 GPa had 37.5% higher wear volume than TiAlN(Ag,Cu) coating with 20 at.% Ag–Cu content and hardness of 6.7 GPa. Addition of Ag and Cu to TiAlN coating decreased hardness, elastic modulus, and compressive residual stresses, and also decreased CoF and wear rate, hence improved wear resistance. These results of an effect of coating hardness on wear rate were in opposition to those obtained for 3 µm-thick TiN coating with hardness of 26.4 GPa, 3 µm-thick TiAlSiN coating with hardness of 30.4 GPa and 3 µm-thick TiCrAlSiN coating with hardness of 31.6 GPa deposited on 316 stainless steel by a filtered cathodic arc process [136]. The TiN, TiAlSiN and TiCrAlSiN coatings were tested under dry soft-sliding against a nylon fibre with 0.12 mm in diameter, a tension force of 2 N and a rotation speed of 150 rpm (the average sliding velocity was 225 m/min). With increasing coating hardness the wear rate decreased, so the wear resistance increased. Investigations of TaN coatings showed also that the wear rate of a steel ball was about 6–7 times bigger for all TaN coatings than for uncoated WC-Co substrate despite coating hardness [134].
Figure 18. Wear rate of 2.5–3 μm thick TaN coatings deposited on WC-Co substrate using the reactive magnetron sputtering technique, and wear volume of steel balls, reprinted from Tribology International, Reference [134], with permission from Elsevier.
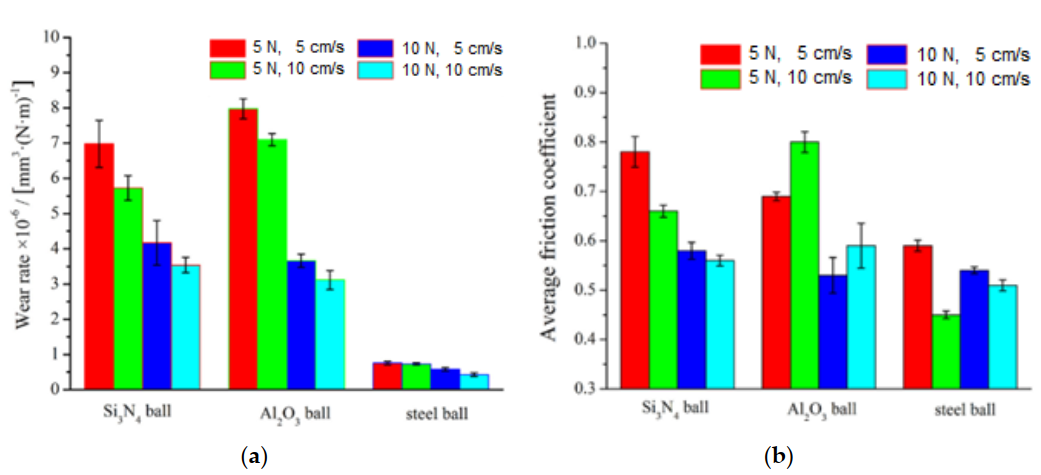
Investigations of the material of a ball (Si3N4 with hardness of 15 GPa, Al2O3 with hardness of 16 GPa, steel with hardness of 7 GPa), sliding speed (5 and 10 cm/s) and load (5 and 10 N) on wear rate of 4 μm thick TiN coating with hardness of 26 GPa showed that the wear rate decreased as load and sliding speed increased (Figure 19) [137]. The lowest wear rate was obtained for the steel ball with the lowest hardness and the lowest elastic modulus, and the highest for the alumina ball with the highest hardness and the highest elastic modulus. The reason was the contact pressure generated on the surface of TiN coating. For the alumina ball, the contact pressure was the highest and for the steel ball was the smallest. Load and sliding speed also influenced CoF. In case of the Si3N4 and steel balls, with increasing contact pressure and sliding speed, CoF decreased. Different results were obtained for the alumina ball, CoF increased with increasing sliding speed, but decreased with increasing contact load. In the case of tests conducted with the Al2O3 ball, the wear rate decreased as sliding speed increased from 5 cm/s to 10 cm/s than although CoF increased. These studies show very well that CoF does not determine wear rate. The difference in the obtained results follows degradation mechanism. In the case of Si3N4 and Al2O3 balls, damages of TiN coating were typical for polishing. While, the degradation of TiN coating caused by steel ball was mainly due to adhesive and abrasive wear.
Figure 19. Wear rate (a) and coefficient of friction (b) of the systems 4 μm thick TiN coating deposited on AISI 440C steel by means of the arc ion plating technique—Si3N4, Al2O3 and steel balls, reprinted from Tribology International, Reference [137], with permission from Elsevier.
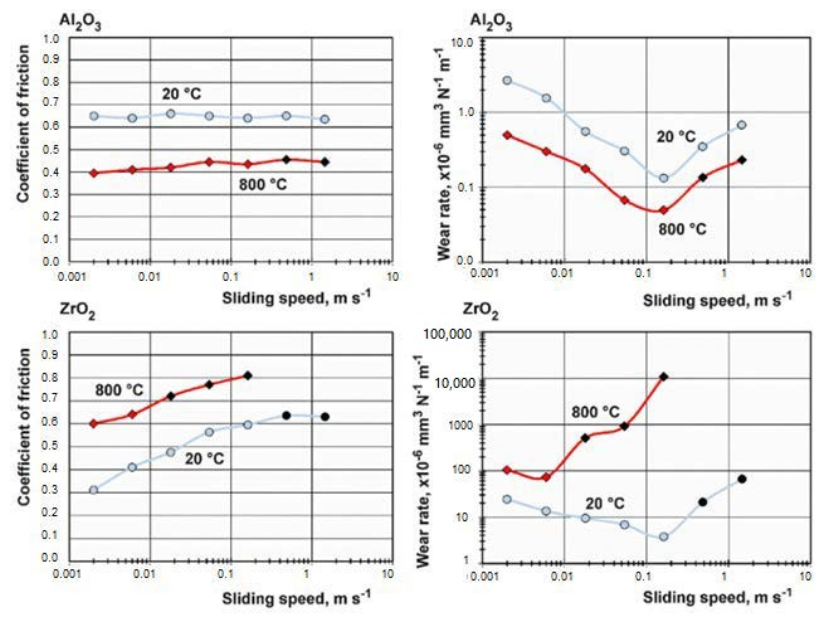
Investigations of the effect of temperature showed that CoF and wear rate of the 3 μm thick AlCrN coating with hardness of 30.6 GPa was depended on material of the ball that was made from Si3N4 (hardness: 15 GPa), Al2O3 (hardness: 15 GPa), and ZrO2 (hardness: 10.5 GPa) (Figure 20) [125]. In the case of a zirconia ball, high wear rate was caused by low hardness and low thermal conductivity. However, CoF was lower than in case of the Al2O3 ball, that had much lower wear rate. In addition, increasing CoF did not cause an increase in wear rate. An increase in sliding temperature caused different change in CoF and wear rate depending on the ball. In the case of Al2O3 ball, CoF and wear rate decreased, while for zirconia ball—increased. These changes were related with hardness and thermal conductivity of the balls.
Figure 20. Coefficient of friction and wear rate of the systems 3 μm thick AlCrN coating deposited on high temperature oxidation resistant stainless steel (EN 1.4835) by means of the arc ion plating technique—Al2O3 and ZrO2 balls, reprinted from Tribology International, Reference [125], with permission from Elsevier.
Comparison of the wear rate of the 4-μm-thick TiAlN monolayer coating and the 4-μm-thickTi-Al-Mo-N multilayer coating with alternating layers of Ti and Mo enriched nitride showed higher wear resistance (lower wear rate) of the multilayer coating [114]. Also investigations of CoF and life of tools with 5 μm-thick TiN/TiC, TiN and TiC coatings showed a lower friction coefficient and about twice the life of tools with the multilayer coating compared to the monolayers [138]. In the case of CrN and CrN/CrCN coatings with different content of carbon and thickness in a range from 1.27 μm to 1.96 μm that was depended on the C2H2 flow rate, the CrN/CrCN multilayer coatings had lower CoF than CrN monolayer coating [129]. In addition, CrN/CrCN coating that had the lowest CoF (0.49) also had the lowest wear (the width of the wear track was 126 μm). Although with increasing CoF increased the wear, this relation was not too rigid. CrN/CrCN coating produced at the C2H2 flow rate of 30 sccm had lower CoF (0.63) than CrN coating (0.69), but higher wear: the width of the wear track was 180.9 μm and 171.5 μm, respectively. Better wear resistance of the multilayer coating compared to the monolayer have been obtained testing CrN and DLC coatings with or without Fe3Al-based interlayer [139]. Similar results of wear resistance of the multilayer coatings have been also obtained in References [13,140,141].
The wear resistance of multilayer PVD coatings depends on the coating structure. Deposition of 2.4 μm thick CrCN/CrN coatings with 400 nm thick module and the ratio of layer thickness in the module being 1:1 on planer knives made of HS6-5-2 steel allowed increase lifetime by 42% [13]. Comparison of 2.9 μm thick CrCN and CrN/CrCN multilayer coatings showed that the wear depth and wear rate of the CrCN monolayer coating was about 2–5 times higher than that of the CrCN/CrN multi-layer coating in the same test conditions [140]. An improvement in resistance to the wear of the CrCN/CrN coating has been connected with the good adhesion of 125 N obtained in a test performed using a commercial scratch tester (Revetest, CSEM), the adhesion of CrCN monolayer coating was 80 N, the thickness of the harder CrCN layer in the bilayer, and the thickness and number of bilayers in the coating. The better the adhesion, the better the resistance to the wear. With increasing number of bilayers in the coating the adhesion increased. However, increasing thickness of the CrCN layer in the bilayer caused a decrease in coating adhesion. Such correlation of wear resistance with adhesion was not confirmed for TiN coating with thickness of 0.8 μm and TiN/TiAlSiN coatings with thickness in a range from 2 μm to 4 μm, which were also obtained by a scratch tester (Revetest, CSEM) [142]. The TiN + multiTiAlSiN + TiN coating that had the highest adhesion (LC = 22.4 N) had slightly better wear resistance than the TiN + TiAlSiN + AlSiTiN coating with the lowest adhesion (LC = 18.3 N).
The study on the influence of the layer thickness of the multilayer coating on the wear resistance showed that the wear rate decreases with the decrease of the layer thickness [114,143]. For example, TiN/Ti coating with a total thickness of 1.2 μm and a layer thickness of 20 nm had about 50% less wear than TiN/Ti coating with the same total thickness and a layer thickness of 100 nm. In the case of TiN/CrN coatings with a total thickness of 1.4–1.6 μm, a decrease of a layer thickness from 100 nm to 20 nm caused about 40% reduction in wear. In the case of 4 μm thick Ti-Al-Mo-N coatings with a modulation period of about 80 nm, in contrast to TiAlN monolayer coating with the same thickness, no wear was observed after the entire tribological tests, regardless the test temperature.
According to References [127,141], a decrease in wear resistance in metallic-ceramic multilayer coating is related to the content of soft metallic phase in the coating. In case of 3 μm thick TiN/Ti coatings, an increase in the content of soft metallic Ti phase (an increase in Ti layer thickness from 10 nm to 150 nm) caused a decrease in the hardness (from 32 GPa to 20 GPa) and elastic modulus (from 330 GPa to 297 GPa) of the coating and increases the wear rate (from about 2 × 10⁻⁶ mm3/Nm to 8 × 10⁻⁵ mm3/Nm) [141]. In addition, the wear rate of an alumina ball used as a counterpart also increases. Investigations of an influence of metallic Ti content in TiN/Ti coating showed that with increasing metallic Ti phase up to 50%, hardness decreased from about 2200 HV for TiN coating to about 950 HV and the wear rate increased from about 250 μm3/mmN to 400 μm3/mmN [127]. An increased content of Ag and Cu in TiAlN(Ag,Cu) coatings (from 11% to 20%) caused a decrease in hardness (from 15.2 GPa to 6.7 GPa) and elastic modulus (from 216.4 GPa to 140.7 GPa). However, CoF and wear also decreased from 0.31 to 0.1 and from 2.2 × 10⁻⁴ mm3 to 1.6 × 10⁻⁴ mm3, respectively [135]. Thus, the wear resistance was improved.
Despite the thickness of each layer, the thickness of bilayers also plays an essential role in wear resistance of multilayer coating. Investigations of CrN/CrCN coatings showed that the thinner the bilayer, the better the wear resistance [140]. Comparable results of an effect of bilayer thickness were obtained in testing TiN/Ti, Ti-Al-Mo-N and TiN/CrN multilayer coatings with nanometric layer thickness [114,143]. The wear decreased with decreasing bilayer thickness. This is connected with increasing number of layer boundaries, which affect stress distribution and crack development. However, this correlation was not confirmed in TiAlN/W2N coatings [19]. The reason was decreasing adhesion of the coatings with decreasing thickness of bilayers.
PVD coatings, especially produced by the cathodic arc evaporation technique, have many defects in the form of micro-droplets and craters [98,144]. Table 1 shows that the deposition of the PVD coating increases the surface roughness, regardless of the deposition technique. According to Reference [132], along with roughness increase, CoF increases as well. Tribological tests of 5 μm thick (Cr,Al,Mo)N, 3 μm thick (Cr,Al,Cu)N and 3.5 μm thick (Cr,Al,Mo,Cu)N coatings deposited on hardened steel AISI5115 (16MnCr5E) with hardness H = (60 ± 2) HRC, AlCrN and CrWN coatings deposited on 30CrMo6 steel with a hardness of 440 ± 1 HV0.01 showed that during initial stage of testing the reduction of CoF occurred [86,145]. This reduction depended on the contact force, sliding velocity, lubricant, material of ball used as a counterpart, temperature of testing and the coating. In case of AlCrN coating, the reduction of CoF was about 30% [145]. While, in case of (Cr37Al50Mo13)N coating, the reduction of CoF was even about 80% for low viscosity lubrication oil LVO, the counterpart made from 100Cr6, the sliding velocity of 0.1 m/s, Hertzian pressure of 1400 MPa and temperature of 80 °C [86]. When the lubricant and the material of a ball was changed to a mineral base oil and Si3N4, the reduction was only about 20%. Based on Reference [144], the decrease of friction coefficient occurs due to removal of droplets and formation of craters. Since polishing also causes the removal of micro-droplets from the PVD coating surface, it has been used to reduce CoF in (Ti,Al)N-(Al,Cr)2O3 coatings [85]. The reduction in surface roughness by almost 60% was accompanied by a decrease in CoF by about 50%. It should be highlighted that low surface roughness does not always mean low CoF (Table 1). Regardless of the tribological test conditions, the AlCrN coating had lower friction coefficient than CrWN coating, despite higher surface roughness [145].
Table 1. Surface roughness and CoF of PVD coatings.
|
Coating |
Substrate |
Technique of Deposition |
Coating Roughness |
Substrate Roughness |
CoF |
Reference |
|
Cr-N |
high speed steel |
Arc evaporation |
0.1 ÷ 1.06 |
0.05 |
- |
[8] |
|
CrN |
17-4 PH stainless steel |
Plasma enhanced magnetron sputtering. |
0.015 |
0.004 |
0.81 |
[18] |
|
CrN |
cemented carbide (10 wt.% Co, 90 wt.% WC) |
multi-arc ion plating technique |
0.21 |
0.04 |
0.8 |
[133] |
|
Cr55Si1.3CN |
17-4 PH stainless steel |
Plasma enhanced magnetron sputtering. |
0.008 |
0.004 |
0.71 |
[18] |
|
Cr46Si2.6CN |
17-4 PH stainless steel |
Plasma enhanced magnetron sputtering. |
0.017 |
0.004 |
0.91 |
[18] |
|
Cr43Si3.4CN |
17-4 PH stainless steel |
Plasma enhanced magnetron sputtering. |
0.013 |
0.004 |
0.67 |
[18] |
|
CrN/CrCN |
X6CrNiTi 18-10 stainless steel |
Cathodic arc evaporation |
0.255 ± 0.05 |
0.02 |
- |
[46] |
|
CrCN/CrN |
HS6-5-2 steel |
Cathodic arc evaporation |
0.1 ÷ 1.06 |
0.02 |
- |
[13] |
|
AlCrN |
cemented carbide (10 wt.% Co, 90 wt.% WC) |
Multi-arc ion plating technique |
0.12 |
0.04 |
0.75 |
[133] |
|
AlTiN |
cemented carbide (10 wt.% Co, 90 wt.% WC) |
Multi-arc ion plating technique |
0.14 |
0.04 |
0.82 |
[133] |
|
TiN |
AISI 316 |
Cathodic arc evaporation |
0.64 ± 0.22 |
1.133 ± 0.35 |
- |
[136] |
|
TiAlN |
AISI 420 |
Magnetron sputtering |
0.1135 |
0.050 |
0.8 |
[135] |
|
TiAlSiN |
AISI 316 |
Cathodic arc evaporation |
0.61 ± 0.08 |
1.133 ± 0.35 |
- |
[136] |
|
TiCrAlSiN |
AISI 316 |
Cathodic arc evaporation |
0.622 ± 0.33 |
1.133 ± 0.35 |
- |
[136] |
|
TiAlN (Ag,Cu) 11 at.% |
AISI 420 |
Magnetron sputtering |
0.176 |
0.050 |
0.31 |
[135] |
|
TiAlN (Ag,Cu) 16 at.% |
AISI 420 |
Magnetron sputtering |
0.228 |
0.050 |
0.28 |
[135] |
|
TiAlN (Ag,Cu) 17 at.% |
AISI 420 |
Magnetron sputtering |
0.425 |
0.050 |
0.25 |
[135] |
|
TiAlN (Ag,Cu) 20 at.% |
AISI 420 |
Magnetron sputtering |
0.538 |
0.050 |
0.1 |
[135] |
|
TiAlN/W2N modulation period 680 nm |
AISI 304l |
Multi-arc ion plating and magnetron sputtering |
0.436 |
mirror polished |
0.78 |
[19] |
|
TiAlN/W2N modulation period 373 nm |
AISI 304l |
Multi-arc ion plating and magnetron sputtering |
0.349 |
mirror polished |
0.73 |
[19] |
|
TiAlN/W2N modulation period 256 nm |
AISI 304l |
Multi-arc ion plating and magnetron sputtering |
0.327 |
mirror polished |
0.80 |
[19] |
|
TiAlN/W2N modulation period 197 nm |
AISI 304l |
Multi-arc ion plating and magnetron sputtering |
0.319 |
mirror polished |
0.81 |
[19] |
|
TiAlN/W2N modulation period 140 nm |
AISI 304l |
Multi-arc ion plating and magnetron sputtering |
0.295 |
mirror polished |
0.81 |
[19] |
In previous section it was shown that resistance to erosion was related to the resistance to plastic deformation (H/E and H3/E2 ratios). Leyland and Matthews have proposed using the H/E ratio in wear control [146]. They have suggested that a high H/E ratio is a reliable indicator of a good abrasion resistance of a coating. Investigations of TiN–Al/TiN, TiN–AlTiN/SiN, CrTiN–AlTiN–AlTiCrN/SiN coatings confirmed that the wear resistance increased with H/E ratio [147]. The best wear resistance was achieved by the coating with the highest H/E ratio. Additionally, in References [129,139], there was shown that the higher the resistance to plastic deformation, the lower the wear rate. However, not all investigations confirm this relationship. The tribological test of TiAlN, TiAlSiN, CrN/TiAlCrSiN and CrN/CrCN/DLC coatings showed that no correlation between H/E or H3/E2 ratio and the wear resistance [148]. Similarly, the tests of TiAlN(Ag,Cu) and AlNiTiSiB(N) coatings did not confirm this relationship [135,149]. Lack of such correlation was also noted in Ref [134].
5. Summary
As the PVD method gives a great opportunity to modify the properties of the produced coatings, these coatings are tested as anti-wear and anti-erosion coatings and used in several applications. They should be resistant to such damage processes as: dynamic fracture in micro-volumes, fatigue in micro-volumes and corrosion. Their protective properties (incubation period, rate of erosion/wear) depend on the composition and structure of the coating, the properties of the substrate, the method and conditions of deposition, and the test/operating conditions of the coating. Increasing the duration of incubation, decreasing the cumulative mass or volume loss, and reducing the erosion rate are indicative of increased anti-erosion properties of PVD coatings.
Numerous investigations showed that PVD coatings increase incubation period and decrease erosion rate in cavitation and solid particle erosion tests. The improvement of resistance to cavitation and solid particle erosion depends on hardness, elastic modulus and adhesion of the coating, stresses in the coating, as well as hardness, elastic modulus and plastic properties of the substrate, and also impact velocity. Thus, the resistance of PVD coatings to mentioned degradation processes depends on many factors. The most important are hardness, adhesion and the resistance to plastic deformation (H/E or H3/E2 ratios). Nevertheless, hardness promotes, but does not determine, an increase in resistance to cavitation erosion. Some investigations show that coatings with very high hardness have lower resistance to cavitation or solid particle erosion than coatings with lower hardness. Such case was noted in testing 3 μm thick TiN coatings deposited on ball-bearing steel with hardness of 24 and 38 GPa. Similar results have been obtained in the tribological tests in searching wear rate of TiAlN(Ag,Cu) or TaN coatings. TiAlN(Ag,Cu) coating with hardness of 15.2 GPa had 37.5% higher wear volume than TiAlN(Ag,Cu) coating with hardness of 6.7 GPa. TaN coating with hardness of 36.5 GPa had higher wear rate than TaN coating with hardness of 30 GPa. Thus, it should be emphasized that an improperly selected coating, e.g., due to an inadequate literature review or the lack of own research, may shorten the incubation period and/or increase the erosion/wear rate. Table 2 summarizes the degradation rate of the PVD coatings.
Table 2. Degradation rate of PVD coatings.
|
Coating |
Substrate |
Deposition |
Test Condition |
Coating Hardness /Substrate Hardness |
CoF |
Adhesion (Critical Load, LC2) |
Degradation Rate |
Reference |
|
Cr-N V = −20V |
high speed steel |
Arc evaporation |
1 μm diamond slurry load of 20 g |
2101 HV0.1 |
- |
129 N |
24.5 μm3/mmN |
[8] |
|
Cr-N V = −50V |
high speed steel |
Arc evaporation |
1 μm diamond slurry, load of 20 g |
2213 HV0.11 |
- |
127 N |
21.6 μm3/mmN |
[8] |
|
Cr-N V = −100V |
high speed steel |
Arc evaporation |
1 μm diamond slurry load of 20 g |
2474 HV0.1 1 |
- |
120 N |
21.8 μm3/mmN |
[8] |
|
Cr-N V = −200V |
high speed steel |
Arc evaporation |
1 μm diamond slurry load of 20 g |
2027 HV0.1 1 |
- |
110 N |
31.1 μm3/mmN |
[8] |
|
CrN |
17-4 PH stainless steel |
Plasma enhanced magnetron sputtering. |
Sharp alumina φ 50 μm, velocity: 60 m/s, |
19.97 GPa |
0.81 |
- |
1.29 μm3/mmN |
[18] |
|
CrN |
TC11 titanium alloy |
Arc ion plating |
alumina φ 80 μm; velocity: 30 m/s impact angle 30 and 90° |
21.4 ± 0.5 GPa |
- |
42 N |
0.672 μm/g at 30° 1.532 μm/g at 90° |
[9] |
|
CrAlN |
TC11 titanium alloy |
Arc ion plating |
alumina φ 80 μm; velocity: 30 m/s impact angle 30 and 90° |
24.9 ± 0.3 GPa |
- |
37.4 N |
0.474 μm/g at 30° 1.643 μm/g at 90° |
[9] |
|
CrAlN Al/Cr atomic ratio = 0.13 |
HSS |
Unbalanced magnetron sputtering |
alumina φ 9.5 mm, load: 10 N, speed: 20 cm/s, distance: 2000 m |
22.5 GPa |
0.44 |
- |
0.8 μm3/mmN |
[132] |
|
CrAlN Al/Cr atomic ratio = 0.26 |
HSS |
Unbalanced magnetron sputtering |
alumina φ 9.5 mm, load: 10 N, speed: 20 cm/s, distance: 2000 m |
24.1 GPa |
0.43 |
- |
0.6 μm3/mmN |
[132] |
|
CrAlN Al/Cr atomic ratio = 0.39 |
HSS |
Unbalanced magnetron sputtering |
alumina φ 9.5 mm, load: 10 N, speed: 20 cm/s, distance: 2000 m |
27.8 GPa |
0.45 |
- |
0.38 μm3/mmN |
[132] |
|
CrAlN Al/Cr atomic ratio = 0.51 |
HSS |
Unbalanced magnetron sputtering |
alumina φ 9.5 mm, load 10 N, speed: 20 cm/s, distance: 2000 m |
26 GPa |
0.6 |
- |
0.17 μm3/mmN |
[132] |
|
Cr55Si1.3CN |
17-4 PH stainless steel, |
Plasma enhanced magnetron sputtering |
Sharp alumina, φ 50 μm, velocity: 60 m/s |
21.59 GPa |
0.71 |
- |
1.12 μm3/mmN |
[18] |
|
Cr46Si2.6CN |
17-4 PH stainless steel, |
Plasma enhanced magnetron sputtering |
Sharp alumina, φ 50 μm velocity: 60 m/s |
14.04 GPa |
0.91 |
- |
2.12 μm3/mmN |
[18] |
|
Cr43Si3.4CN |
17-4 PH stainless steel, |
Plasma enhanced magnetron sputtering |
Sharp alumina, φ 50 μm velocity: 60 m/s |
13.86 GPa |
0.67 |
- |
1.1 μm3/mmN |
[18] |
|
CrAlTiN |
VT-3 titanium alloy |
Unbalanced magnetron sputtering |
Steel ball φ 25–40 mm, load: 0.5–10 N, sliding speed: 74–247 rpm, abrasive material: SiC |
18 GPa |
- |
22 N |
5.18 μm3/mmN/23.66 μm3/mmN |
[15] |
|
CrCN/CrN |
HS18-0-1 high speed steel |
Cathodic arc evaporation |
alumina, φ 10 mm, load 30 N, velocity: 0.2 m/s distance: 1500 m |
24.5 ± 0.5 GPa |
0.48 ± 0.03 |
115 ± 3 N |
2.4 μm3/mmN |
[11] |
|
CrCN/CrN + ta-C |
HS18-0-1 high speed steel |
Cathodic arc evaporation |
alumina, φ 6 mm, load: 20N, velocity: 0.1 m/s distance: 3790 m |
45 ± 2 GPa |
0.09 ± 0.02 |
71 ± 3 N |
1.3 μm3/mmN |
[11] |
|
CrAlNx/CrAlN |
TC11 titanium alloy |
Arc ion plating |
alumina φ 80 μm; velocity: 30 m/s impact angle 30 and 90° |
24.7 ± 0.6 GPa |
- |
46.2 N |
0.568 μm/g at 30° 1.265 μm/g at 90° |
[9] |
|
TiN |
VT-3 titanium alloy |
Unbalanced magnetron sputtering |
steel ball φ 25–40 mm, load: 0.5–10 N, sliding speed: 74–247 rpm, abrasive material: SiC |
41 GPa |
- |
8 N |
6.59 μm3/mmN/27.92 μm3/mmN |
[15] |
|
TiN |
AISI 316 |
Cathodic arc evaporation |
nylon fibre φ 0.12 mm tension force: 2 N, sliding velocity: 225 m/min |
26.4 GPa/6.6 GPa |
- |
- |
0.967 g/m /4.73 g/m after 180 min |
[136] |
|
TiAlN |
AISI 420 |
Magnetron sputtering |
alumina, φ 0.6 mm, load: 1 N, rotation: 1432.4 rpm wear track: φ 0.2 cm, 185 cycles |
27 ÷ 1 GPa/6.0 ÷ 0.1 GPa |
0.8/0.7 |
- |
4.0 × 10⁻⁴ mm3/5.4 × 10−4 mm3 |
[135] |
|
TiCrAlN |
VT-3 titanium alloy |
Unbalanced magnetron sputtering |
steel ball φ 25–40 mm, load: 0.5–10 N, sliding speed: 74–247 rpm, abrasive material: SiC |
17 GPa |
- |
25 N |
3.39 μm3/mmN/6.29 μm3/mmN |
[15] |
|
TiCrBN |
VT-3 titanium alloy |
Unbalanced magnetron sputtering |
steel ball φ 25–40 mm, load: 0.5–10 N, sliding speed: 74–247 rpm, abrasive material: SiC |
28 GPa |
- |
35 N |
4.759 μm3/mmN/120.8 μm3/mmN |
[15] |
|
TiN/Ti |
Ti6Al4V alloy |
Combination of magnetic filtered cathode vacuum arc and metal vapor vacuum arc ion implantation |
silica (SiO2), alumina (Al2O3), |
24.73 GPa ÷ 30.58 GPa |
- |
77.8 ± 2.9 N ÷ 83.7 ± 3.5 N |
0.0014 mg/g ÷ 0.023 mg/g |
[16] |
|
TiN/Ti |
Ti-6Al-4V alloy |
Arc evaporation |
Corundum 0.053 mm size; velocity: 85 g/s, angle: 60° |
25.07 ÷ 34.06 GPa |
- |
2.4 ÷ 14.1 N |
0.19 ÷ 0.51 mg/min |
[22] |
|
TiAlN/W2N modula-tion period 680 nm |
AISI 304 L |
Multiarc ion plating and magnetron sputtering |
Si3N4 ball, φ 6.0 mm; load: 5 N, rotating speed of 200 rpm, 30 min |
1.3 GPa |
0.78 |
41.8 N |
5.84 μm3/mmN / 9.92 μm3/mmN |
[19] |
|
TiAlN/W2N modula-tion period 373 nm |
AISI 304 L |
Multi-arc ion plating and magnetron sputtering |
Si3N4 ball, φ 6.0 mm; load: 5 N, rotating speed of 200 rpm, 30 min |
1.76 |
0.73 |
35.3 |
2.50 μm3/mmN |
[19] |
|
TiAlN/W2N modula-tion period 256 nm |
AISI 304 L |
Multi-arc ion plating and magnetron sputtering |
Si3N4 ball, φ 6.0 mm; load: 5 N, rotating speed of 200 rpm, 30 min |
1.38 |
0.80 |
29.8 |
3.42 μm3/mmN |
[19] |
|
TiAlN/W2N modula-tion period 197 nm |
AISI 304 L |
Multi-arc ion plating and magnetron sputtering |
Si3N4 ball, φ 6.0 mm; load: 5 N, rotating speed of 200 rpm, 30 min |
1.29 |
0.81 |
24.1 |
4.11 μm3/mmN |
[19] |
|
TiAlN/W2N modula-tion period 140 nm |
AISI 304 L |
Multi-arc ion plating and magnetron sputtering |
Si3N4 ball, φ 6.0 mm; load: 5 N rotating speed of 200 rpm, 30 min |
1.14 |
0.81 |
18.9 |
4.38 μm3/mmN |
[19] |
|
TiAlN (Ag,Cu) 11 at.% |
AISI 420 |
Magnetron sputtering |
alumina, φ 0.6 mm, load: 1 N, rotation: 1432.4 rpm wear track: |
15.2 ± 0.4 GPa/ 6.0 ± 0.1 GPa |
0.31/0.7 |
- |
2.2 × 10⁻⁴ mm3/5.4 × 10−4 mm3 |
[135] |
|
TiAlN (Ag,Cu) 16 at.% |
AISI 420 |
Magnetron sputtering |
alumina, φ 0.6 mm, load: 1 N, rotation: 1432.4 rpm wear track: |
10.1 ± 0.3 GPa /6.0 ± 0.1 GPa |
0.28/0.7 |
- |
1.6 × 10⁻⁴ mm3 / 5.4 × 10⁻⁴ mm3 |
[135] |
|
TiAlN (Ag,Cu) 17 at.% |
AISI 420 |
Magnetron sputtering |
alumina, φ 0.6 mm, load: 1 N, rotation: 1432.4 rpm wear track: |
8.8 ± 1.4 GPa /6.0 ± 0.1 GPa |
0.25/0.7 |
- |
7.7 × 10⁻⁵ mm3/5.4 × 10−4 mm3 |
[135] |
|
TiAlN (Ag,Cu) 20 at.% |
AISI 420 |
Magnetron sputtering |
alumina, φ 0.6 mm, load: 1 N, rotation: 1432.4 rpm wear track: |
6.7 ± 0.3 GPa /6.0 ± 0.1 GPa |
0.1/0.7 |
- |
1.6 × 10⁻⁴ mm3 / 5.4 × 10⁻⁴ mm3 |
[135] |
|
TiAlSiN |
AISI 316 |
Cathodic arc evaporation |
nylon fibre φ 0.12 mm tension force: 2 N, sliding velocity: 225 m/min |
31.6 GPa /6.6 GPa |
- |
- |
0.494 g/m / |
[136] |
|
TiCrAl SiN |
AISI 316 |
Cathodic arc evaporation |
nylon fibre φ 0.12 mm tension force: 2 N, sliding velocity: 225 m/min |
30.4 GPa /6.6 GPa |
- |
- |
0.65 g/m / |
[136] |
Since the deformation capacity of the material depends on the hardness and modulus of elasticity, it has been proposed to use the ratio of hardness and modulus of elasticity, which has been called resistance to plastic deformation. By determining the correlation of the resistance to plastic deformation (H/E or H3/E2 ratios) with the erosion rate, it can be seen that there is an optimum value of the ratio at which the PVD coating obtains the best resistance to cavitation erosion or solid particle erosion. Initially, the increase in resistance to plastic deformation is accompanied by an increase in resistance to erosion due to the need to increase the impact energy to initiate and develop damage. However, in case of high resistance to plastic deformation, the change of the degradation mode from ductile to brittle occurs and an increase in erosion rate is observed. This is because fracture requires less energy in the brittle mode than in the ductile mode. Thus, coatings with high resistance to plastic deformation become stiff with little susceptibility to deformation. The impact energy needed for crack initiation and its development is low. In the case of cavitation erosion, the optimal value of the H/E ratio depends on the flow velocity in flow cavitation and the thickness of the coatings. For the flow velocity resulting from the inlet pressure of 1000 kPa, the outlet pressure of 130 kPa, the 5 mm gap width in the cavitation tunnel with a barricade system and a TiN coating thickness of 4 µm, the optimal H/E value is around 0.065. In the case of solid particle erosion, the optimum value of the resistance to plastic deformations depends also on the impact angle and the properties of erodent particle (shape, size and hardness). For sharp-edged SiC particles with a size of 212–300 µm, an impact velocity of 8 m/s, a normal angle of impact and a coating thickness of about 6 µm, the optimal H/E value is about 0.055. In the case of tribological wear, many factors affecting the relationship between the H/E ratio and the wear rate mean that the rule obtained in cavitation and solid particle erosion is not recorded. Many tests show the higher the H/E ratio the better the wear resistance. However, not all investigations confirm this rule. In some cases, no correlation between H/E or H3/E2 ratio and the wear resistance has been obtained. The wear resistance of TiN–Al/TiN, TiN–AlTiN/SiN, CrTiN–AlTiN–AlTiCrN/SiN coatings increased with H/E ratio, but no correlation between H/E or H3/E2 ratio and the wear resistance was obtained for TiAlN, TiAlSiN, CrN/TiAlCrSiN, TiAlN(Ag,Cu) and AlNiTiSiB(N) coatings.
The protective properties of PVD coatings depend on the coating structure, which affect the stress distribution and the development of cracks. The multilayer coatings, in general, have better resistance to erosion and wear than the monolayer coatings. In the case of multi-layer metal-ceramic coatings, e.g., in TiN/Ti coating, high tensile stresses arise in the TiN layers, while in the metallic interlayers there is a significant decrease in interfacial axial stress. As a result, the first cracks are initiated in the TiN layers. With increasing thickness of the ceramic TiN layers the erosion resistance decreases. Stiff TiN layers have low deformation capacity and dynamic impact causes shear cracking, while soft Ti layers remain undamaged. This is because the metallic layers absorb more of the impact energy on elastic deformation, thus improving the resistance. However, in the aquatic environment there is a risk of their corrosion, which can contribute to accelerated deterioration of the multilayer coating. In the case of ceramic–ceramic coatings, there is no risk of corrosion and the compressive residual stresses are present in both ceramic layers, although they are not the same. The protective properties depend on coating and substrate stiffness and loading conditions. In solid particle erosion, TiN/ZrN multilayer coating impacted by quartz sand particles with a velocity of 100 m/s had 15.5 times lower erosion rate than that of the uncoated substrate. In flowing cavitation, the resistance of CrN/CrCN coating depends on the liquid flow rate. The 8% decrease in flow rate resulted in a 24% decrease of the erosion rate and about a 3-fold increase in substrate protection time. In tribological tests, there was also obtained that thickness and number of bilayers in multilayer coatings determine their wear rate. The thinner the bilayer, the better the wear resistance. CrCN/CrN coatings with 400 nm thick module and the ratio of layer thickness in the bilayer being 1:1 have about 2–5 times lower the wear depth and wear rate than the CrCN monolayer coating. This result is in contradiction with the results obtained in the cavitation erosion tests, in which a higher erosion rate was obtained for the finer bilayer.
As PVD coatings increase the surface roughness, it affects the coefficient of friction. The increase in surface roughness is usually accompanied by the increase in CoF. However, low surface roughness does not always mean low CoF. The AlCrN coating compared to CrWN coating has lower CoF despite higher surface roughness. During initial stage of testing the reduction of CoF is observed. This reduction is caused by the removal of droplets and formation of craters on the coating surface. The decrease in CoF is often accompanied by a decrease in wear rate, but no correlation between them is recorded. In addition, in case of some investigations, an increase in CoF was accompanied by a decrease in the wear rate. Moreover, there is no correlation between CoF and wear rate (Tables 1 and 2). Thus, low CoF does not determine low wear rate. Although many investigations showed that the lower the surface roughness, the lower the CoF and the lower the wear rate. However, there are also many exceptions to this rule.
Despite the identification of the main relations between the coating properties and its resistance to erosion and wear processes, there is still a need for providing research due to many exceptions. The results obtained depend on the research conditions, the mismatch between coating and substrate properties. The increasing requirements for the reliability of the elements on which the coatings are applied necessitate the elaboration of new coatings, which should be tested experimentally due to numerous exceptions to the obtained dependencies.
References
- Sanga, ; Singhal, M.K.; Saini, R.P. Hydro-abrasive erosion in hydro turbines: A review. Int. J. Green Energy 2018, 15, 232–253.
- Lee, ; Lee, S.; Han, H.N.; Kim, W. Yttrium Oxyfluoride Coatings Deposited by Suspension Plasma Spraying Using Coaxial Feeding. Coatings 2020, 10, 481.
- Shi, ; Xue, Z.; Zhang, Z.; Ji, X.; Byon, E.; Zhang, S. Effect of spraying powder characteristics on mechanical and thermal shock properties of plasma-sprayed YSZ thermal barrier coating. Surf. Coat. Technol. 2020, 395, 125913.
- Garc, ; Julio, A.; Bonache, V. Sprayed WC-12Co on ZE41 Magnesium Alloy. Coatings 2020, 10, 502.
- Hong, ; Wu, Y.; Zhang, J.; Zheng, Y.; Zheng, Y.; Lin, J. Synergistic effect of ultrasonic cavitation erosion and corrosion of WC-CoCr and FeCrSiBMn coatings prepared by HVOF spraying. Ultrason. Sonochemistry 2016, 31, 563–569.
- Bouzakis, Fatigue Endurance Assessment of DLC Coatings on High-Speed Steels at Ambient and Elevated. Coatings 2020, 10, 547.
- Awan, T.; Rivera, V.A.G.; Nogueira, I.C.; Pereira-da-Silva, M.A.; Li, M.S.; Ferreira, S.O.; Marega, E., Jr. Growth process and grain boundary defects in Er doped BaTiO3 processed by EB-PVD: A study by XRD, FTIR, SEM and AFM. Appl. Surf. Sci. 2019, 493, 982–993.
- Odén, ; Ericsson, C.; Håkansson, G.; Ljungcrantz, H. Microstructure and mechanical behavior of arc-evaporated Cr-N coatings. Surf. Coat. Technol. 1999, 114, 39–51.
- Wang, ; Lin, S.; Liu, L.; Yang, H.; Shi, J.; Jiang, B.; Zhou, K.; Zhang, X. Micro-nano multilayer structure design and solid particle erosion resistance performance of CrAlNx/CrAlN coating. Vacuum 2020, 172, 109064.
- Hoche, ; Pusch, C.; Oechsner, M. Corrosion and wear protection of mild steel substrates by innovative PVD coatings. Surf. Coat. Technol. 2020, 391, 125659.
- Gilewicz, ; Warcholinski, B.; Szymanski, W.; Grimm, W. CrCN/CrN ta-C multilayer coating for applications in wood processing. Tribol. Int. 2013, 57, 1–7.
- Zhou, ; Liu, H.Y.; Fu, K.; Yuan, H.; Du, X.; Mai, Y.W. Numerical simulation of failure of composite coatings due to thermal and hygroscopic stresses. Coatings 2019, 9,
- Nadolny, ; Kaplonek, W.; Sutowska, M.; Sutowski, P.; Myśliński, P.; Gilewicz, A. Experimental studies on durability of PVD-based CrCN/CrN-Coated cutting blade of planer knives used in the pine wood planing process. Materials 2020, 13, .
- Paiva, M.; Shalaby, M.A.M.; Chowdhury, M.; Shuster, L.; Chertovskikh, S.; Covelli, D.; Junior, E.L.; Stolf, P.; Elfizy, A.; Bork, C.A.S.; et al. Tribological and wear performance of carbide tools with TiB2 PVD coating under varying machining conditions of TiAl6V4 aerospace alloy. Coatings 2017, 7, 187.
- Kiryukhantsev-Korneev, V.; Phiri, J.; Gladkov, V.I.; Ratnikov, S.N.; Yakovlev, M.G.; Levashov, E.A. Erosion and Abrasion Resistance, Mechanical Properties, and Structure of the TiN, Ti–Cr–Al–N and Cr–Al–Ti–N Coatings Deposited by CFUBMS. Prot. Met. Phys. Chem. Surf. 2019, 55, 913–923.
- Zhang, ; Li, Z.; He, W.; Liao, B.; He, G.; Cao, X.; Li, Y. Damage evolution and mechanism of TiN/Ti multilayer coatings in sand erosion condition. Surf. Coat. Technol. 2018, 353, 210–220.
- Lima, S.; Guerreiro, B.M.H.; Aghasibeig, M. Microstructural Characterization and Room-Temperature Erosion Behavior of As-Deposited SPS, EB-PVD and APS YSZ-Based TBCs. J. Therm. Spray Technol. 2019, 28, 223–232.
- Cai, ; Huang, X.; Yang, Q. Mechanical properties, sliding wear and solid particle erosion behaviors of plasma enhanced magnetron sputtering CrSiCN coating systems. Wear 2015, 324–325, 27–35.
- Xu, ; Su, F.; Li, Z. Tribological properties of nanostructured TiAlN/W2N multilayer coating produced by PVD. Wear 2019, 430, 67–75.
- Azizpour, ; Hahn, R.; Klimashin, F.F.; Wojcik, T.; Poursaeidi, E.; Mayrhofer, P.H. Deformation and cracking mechanism in CrN/TiN multilayer coatings. Coatings 2019, 9, 9–17.
- Zha, ; Jiang, F.; Xu, X. Investigating the high frequency fatigue failure mechanisms of mono and multilayer PVD coatings by the cyclic impact tests. Surf. Coat. Technol. 2018, 344, 689–701.
- Selivanov, S.; Smyslov, A.M.; Dyblenko, Y.M.; Semenova, I.P. Erosive wear behavior of Ti/Ti(V,Zr)N multilayered PVD coatings for Ti-6Al-4V alloy. Wear 2019, 418–419, 160–166.
- Lin, ; Zhou, K.; Dai, M.; Lan, E.; Shi, Q.; Hu, F.; Kuang, T.; Zhuang, C. Structural, mechanical, and sand erosion properties of TiN/Zr/ZrN multilayer coatings. Vacuum 2015, 122, 179–186.
- Momeni, ; Tillmann, W.; Pohl, M. Composite cavitation resistant PVD coatings based on NiTi thin films. Mater. Des. 2016, 110, 830–838.
- Krella, K.; Czyżniewski, A.; Gilewicz, A.; Gajowiec, G. Experimental Study of the Influence of Deposition of Multilayer CrN / CrCN PVD Coating on Austenitic Steel on Resistance to Cavitation Erosion. Coatings 2020, 10, 487.
- Xi, ; Gao, K.; Pang, X.; Yang, H.; Xiong, X.; Li, H.; Volinsky, A.A. Film thickness effect on texture and residual stress sign transition in sputtered TiN thin films. Ceram. Int. 2017, 43, 11992–11997.
- Vega, ; Scheerer, H.; Andersohn, G.; Oechsner, M. Experimental studies of the effect of Ti interlayers on the corrosion resistance of TiN PVD coatings by using electrochemical methods. Corros. Sci. 2018, 133, 240–250.
- Zlamal, ; Mrkvica, I.; Szotkowski, T.; Malotova, S. The influence of surface treatment of PVD coating on its quality and wear resistant. Coatings 2019, 9, .
- Li, G.; Chen, D.R.; Liang, P. Enhancement of cavitation erosion resistance of 316 L stainless steel by adding molybdenum. Ultrason. Sonochemistry 2017, 35, 375–381.
- Zhang, ; Liu, Y.H.; Luo, K.Y.; Zhang, Y.K.; Zhao, Y.; Huang, J.Y.; Wu, X.D.; Zhou, C. Tensile property of ANSI 304 stainless steel weldments subjected to cavitation erosion based on treatment of laser shock processing. Materials 2018, 11,
- Puchi-Cabrera, S.; Matínez, F.; Herrera, I.; Berríos, J.A.; Dixit, S.; Bhat, D. On the fatigue behavior of an AISI 316L stainless steel coated with a PVD TiN deposit. Surf. Coat. Technol. 2004, 182, 276–286.
- Puchi-Cabrera, S.; Staia, M.H.; Quinto, D.T.; Villalobos-Gutiérrez, C.; Ochoa-Pérez, E. Fatigue properties of a SAE 4340 steel coated with TiCN by PAPVD. Int. J. Fatigue 2007, 29, 471–480.
- Zhou, ; Rao, G.B.; Wang, J.Q.; Zhang, B.; Yu, Z.M.; Ke, W.; Han, E.H. Influence of Ti/TiN bilayered and multilayered films on the axial fatigue performance of Ti46Al8Nb alloy. Thin Solid Films 2011, 519, 2207–2212.
- Cairney, M.; Tsukano, R.; Hoffman, M.J.; Yang, M. Degradation of TiN coatings under cyclic loading. Acta Mater. 2004, 52, 3229–3237.
- Baragetti, ; La Vecchia, G.M.; Terranova, A. Variables affecting the fatigue resistance of PVD-coated components. Int. J. Fatigue 2005, 27, 1541–1550.
- Su, L.; Yao, S.H.; Wei, C.S.; Kao, W.H.; Wu, C.T. Influence of single-and multilayer TiN films on the axial tension and fatigue performance of AISI 1045 steel. Thin Solid Films 1999, 338, 177–184.
- Su, L.; Yao, S.H.; Wei, C.S.; Wu, C.T.; Kao, W.H. Evaluation on the wear, tension and fatigue behavior of various PVD coated materials. Mater. Lett. 1998, 35, 255–260.
- Su, ; Yao, S.; Wei, C.; Wu, C. Tension and fatigue behavior of a PVD TiN-coated material. Thin Solid Films 1998, 315, 153–158.
- Sundaram, S. Diamond like carbon film as a protective coating for high strength steel and titanium alloy. Surf. Coat. Technol. 2006, 201, 2707–2711.
- Teer, G. Fatigue properties of a 316L stainless steel coated with different TiN x. Surf. Coat. Technol. 2001, 148, 179–190.
- Trapezon, G.; Lyashenko, B.A. Effect of the deposition and thickness parameters of titanium nitride (TiN) coatings on the fatigue strength. Strength Mater. 2010, 42, 675–682.
- Xin, ; Liu, P.; Feng, C.; Zhu, S.; Wang, F. Fatigue behavior of (graded) (Ti, Al)N-coated 1Cr11Ni2W2MoV stainless steel at high temperature. Surf. Coat. Technol. 2010, 204, 2417–2423.
- Cassar, ; Avelar-Batista Wilson, J.C.; Banfield, S.; Housden, J.; Fenech, M.; Matthews, A.; Leyland, A. Evaluating the effects of plasma diffusion processing and duplex diffusion/PVD-coating on the fatigue performance of Ti-6Al-4V alloy. Int. J. Fatigue 2011, 33, 1313–1323.
- Berríos-Ortíz, A.; La Barbera-Sosa, J.G.; Teer, D.G.; Puchi-Cabrera, E.S. Fatigue properties of a 316L stainless steel coated with different ZrN deposits. Surf. Coat. Technol. 2004, 179, 145–157.
- Kim, R.; Suh, C.M.; Murakami, R.I.; Chung, C.W. Effect of intrinsic properties of ceramic coatings on fatigue behavior of Cr-Mo-V steels. Surf. Coat. Technol. 2003, 171, 15–23.
- Krella, K.; Czyzniewski, A.; Gilewicz, A.; Krupa, A. Cavitation erosion of CrN/CrCN multilayer coating. Wear 2017, 386–387, 80–89.
- Krella, K.; Zakrzewska, D.E.; Marchewicz, A. The resistance of S235JR steel to cavitation erosion. Wear 2020, 452–453, 203295.
- Krella, K.; Zakrzewska, D.E. Cavitation Erosion–Phenomenon and Test Rigs. Adv. Mater. Sci. 2018, 18, 15–26.
- Buszko, H.; Krella, A.K. Slurry Erosion–Design of Test Devices. Adv. Mater. Sci. 2017, 17, 5–17.
- Javaheri, ; Porter, D.; Kuokkala, V. Slurry erosion of steel – Review of tests, mechanisms and materials. Wear 2018, 408–409, 248–273.
- Hattori, ; Ishikura, R.; Zhang, Q. Construction of database on cavitation erosion and analyses of carbon steel data. Wear 2004, 257, 1022–1029.
- Ding, ; Ke, D.; Yuan, C.; Ding, Z.; Cheng, X. Microstructure and cavitation erosion resistance of HVOF deposited WC-Co coatings with different sized WC. Coatings 2018, 8,
- Krebs, ; Kuroda, S.; Katanoda, H.; Gaertner, F.; Klassen, T.; Araki, H.; Frede, S. Warm Spraying of High-Strength Ni-Al-Bronze: Cavitation Characteristics and Property Prediction. J. Therm. Spray Technol. 2017, 26, 265–277.
- Girisha, ; Sreenivas Rao, K.V.; Durga Prasad, C. Slurry Erosion Resistance of Martenistic Stainless Steel with Plasma Sprayed Al2O3-40%TiO2Coatings. Mater. Today: Proc. 2018, 5, 7388–7393.
- Bousser, ; Martinu, L.; Klemberg-Sapieha, J.E. Solid particle erosion mechanisms of protective coatings for aerospace applications. Surf. Coat. Technol. 2014, 257, 165–181.
- Hotta, ; Itou, Y.; Saruki, K.; Arai, T. Fatigue strength at a number of cycles of thin hard coated steels with quench-hardened substrates. Surf. Coat. Technol. 1995, 73, 5–13.
- Carvalho, J.M.; Huis, A.J.; Hosson, J.T. De Interfacial fatigue stress in PVD TiN coated tool steels under rolling contact fatigue conditions. Surf. Coat. Technol. 1998, 105, 109–116.
- Stewart, ; Ahmed, R. Rolling contact fatigue of surface coatings—A review. Wear 2002, 253, 1132–1144.
- Carvalho, J.M.; Zoestbergen, E.; Kooi, B.J.; De Hosson, J.T.M. Stress analysis and microstructure of PVD monolayer TiN and multilayer TiN/(Ti,Al)N coatings. Thin Solid Films 2003, 429, 179–189.
- Ibrahim, N.; Rahmat, M.A.; Oskouei, R.H.; Singh Raman, R.K. Monolayer TiAlN and multilayer TiAlN/CrN PVD coatings as surface modifiers to mitigate fretting fatigue of AISI P20 steel. Eng. Fract. Mech. 2015, 137, 64–78.
- Kim, S.; Lee, S.Y.; Hahn, J.H.; Lee, B.Y.; Han, J.G.; Lee, J.H.; Lee, S.Y. Effects of the thickness of Ti buffer layer on the mechanical properties of TiN coatings. Surf. Coat. Technol. 2003, 171, 83–90.
- Chen, ; Zhao, J.; Meng, X.; Li, J. Evaluation of fatigue resistance of a gradient CrNx coating applied to turbine blades. Mater. Sci. Eng. A 2010, 527, 1436–1443.
- Yoon, Y.; Yoon, S.Y.; Chung, W.S.; Kim, K.H. Impact-wear behaviors of TiN and Ti-Al-N coatings on AISI D2 steel and WC-Co substrates. Surf. Coat. Technol. 2004, 177–178, 645–650.
- Krella, ; Czyzniewski, A. Influence of the substrate hardness on the cavitation erosion resistance of TiN coating. Wear 2007, 263, 395–401.
- ASTM G32-09 Standard Test Method for Cavitation Erosion Using Vibratory Apparatus 1. In ASTM International, West Conshohocken, United States
- Lamana, S.; Pukasiewicz, A.G.M.; Sampath, S. Influence of cobalt content and HVOF deposition process on the cavitation erosion resistance of WC-Co coatings. Wear 2018, 398–399, 209–219.
- Ma, ; Harvey, T.J.; Wellman, R.G.; Ehiasarian, A.P.; Hovsepian, P.E.; Sugumaran, A.A.; Purandare, Y.P.; Wood, R.J.K. Cavitation erosion performance of CrAlYN/CrN nanoscale multilayer coatings deposited on Ti6Al4V by HIPIMS. J. Alloys Compd. 2019, 788, 719–728.
- Ding, ; Cheng, X. dong; Yu, X.; Li, C.; Yuan, C.; Ding, Z. Structure and cavitation erosion behavior of HVOF sprayed multi-dimensional WC–10Co4Cr coating. Trans. Nonferrous Met. Soc. China 2018, 28, 487–494.
- Jasionowski, ; Polkowski, W.; Zasada, D. Effect of crystalographic texture on cavitation wear resistance of as-cast CuZn10 alloy. Arch. Metall. Mater. 2018, 63, 935–940.
- Wu, ; Bai, L.; Lin, W. On the definition of cavitation intensity. Ultrason. Sonochemistry 2020, 67, 10–12.
- Wu, ; Huang, B.; Wang, G.; Cao, S. The transient characteristics of cloud cavitating flow over a flexible hydrofoil. Int. J. Multiph. Flow 2018, 99, 162–173.
- Choi, K.; Chahine, G.L. Relationship between material pitting and cavitation field impulsive pressures. Wear 2016, 352–353, 42–53.
- Hong, ; Sarntinoranont, M.; Subhash, G.; Canchi, S.; King, M.A. Localized Tissue Surrogate Deformation due to Controlled Single Bubble Cavitation. Exp. Mech. 2016, 56, 97–109.
- Soyama, Cavitation peening: A review. Metals 2020, 10, .
- Krella, K.; Krupa, A. Effect of cavitation intensity on degradation of X6CrNiTi18-10 stainless steel. Wear 2018, 408–409, 180–189.
- Münsterer, ; Kohlhof, K. Cavitation protection by low temperature TiCN coatings. Surf. Coat. Technol. 1995, 74–75, 642–647.
- Liu, ; Zhu, S.; Shen, M.; Jia, Y.; Wang, W.; Wang, F. Microstructure and cavitation erosion behavior of sputtered NiCrAlTi coatings with and without N incorporations. J. Mater. Sci. Technol. 2020, 54, 211–222.
- Krella, ; Czyzniewski, A. Cavitation erosion resistance of nanocrystalline TiN coating deposited on stainless steel. Wear 2008, 265, 963–970.
- Krella, ; Czyzniewski, A. Cavitation resistance of Cr-N coatings deposited on austenitic stainless steel at various temperatures. Wear 2009, 266, 800–809.
- Yang, M.; Tieu, A.K.; Dunne, D.P.; Huang, S.W.; Li, H.J.; Wexler, D.; Jiang, Z.Y. Cavitation erosion resistance of NiTi thin films produced by Filtered Arc Deposition. Wear 2009, 267, 233–243.
- Szala, ; Walczak, M.; Pasierbiewicz, K.; Kamiński, M. Cavitation erosion and sliding wear mechanisms of AlTiN and TiAlN films deposited on stainless steel substrate. Coatings 2019, 9, 340.
- Bahri, ; Kaçar, E.; Akkaya, S.S.; Elleuch, K.; Ürgen, M. Wear protection potential of TiN coatings for 304 stainless steels used in rotating parts during olive oil extraction. Surf. Coat. Technol. 2016, 304, 560–566.
- Krella, ; Czyzniewski, A. Investigation concerning the cavitation resistance of TiN coatings deposited on austenitic stainless steel at various temperatures. Wear 2008, 265, 72–80.
- Zhang, ; Guo, X.; Wang, C.; Liu, F.; Sun, L. Effect of plasma-assisted laser pretreatment of hard coatings surface on the physical and chemical bonding between PVD soft and hard coatings and its resulting properties. Appl. Surf. Sci. 2020, 509, 145342.
- Saketi, ; Olsson, M. Influence of CVD and PVD coating micro topography on the initial material transfer of 316L stainless steel in sliding contacts— A laboratory study. Wear 2017, 388–389, 29–38.
- Bobzin, ; Brögelmann, T.; Kalscheuer, C. Arc PVD (Cr,Al,Mo)N and (Cr,Al,Cu)N coatings for mobility applications. Surf. Coat. Technol. 2020, 384, 125046.
- Fazlalipour, ; Naghashnejad, M.; Niki Nushari, M. Evaluation of adhesion and erosion/corrosion resistance of nano-composite and nano-multilayer thin films in molten aluminum alloy. SN Appl. Sci. 2019, 1:
- Gahlin, ; Bromark, M.; Hedenqvist, P.; Hogmark, S.; Hakansson, G. Properties of TiN and CrN coatings deposited at low temperature using reactive arc-evaporation. Surf. Coat. Technol. 1995, 76–77, 174–180.
- Harris, G.; Doyle, E.D.; Wong, Y.C.; Munroe, P.R.; Cairney, J.M.; Long, J.M. Reducing the macroparticle content of cathodic arc evaporated TiN coatings. Surf. Coat. Technol. 2004, 183, 283–294.
- Hovsepian, E.; Lewis, D.B.; Munz, W.-D. Recent progress in large scale manufacturing of multilayer superlattice hard coatings. Surf. Coat. Technol. 2000, 133–134, 166–175.
- Maksakova, ; Simoẽs, S.; Pogrebnjak, A.; Bondar, O.; Kravchenko, Y.; Beresnev, V.; Erdybaeva, N. The influence of deposition conditions and bilayer thickness on physical-mechanical properties of CA-PVD multilayer ZrN/CrN coatings. Mater. Charact. 2018, 140, 189–196.
- Krella, The influence of TiN coatings properties on cavitation erosion resistance. Surf. Coat. Technol. 2009, 204, 263–270.
- Krella, K. Degradation of protective PVD coatings. In Handbook of Materials Failure Analysis; Elsevier: Amsterdam, The Netherlands, 2016; pp. 411–440, ISBN 9780081001165.
- Krella, K. The new parameter to assess cavitation erosion resistance of hard PVD coatings. Eng. Fail. Anal. 2011, 18, 855–867.
- Qin, P.; Zheng, Y.G.; Wei, R. Cavitation erosion behavior of nanocomposite Ti-Si-C-N and Ti/Ti-Si-C-N coatings deposited on 2Cr13 stainless steel using a Plasma Enhanced Magnetron Sputtering process. Surf. Coat. Technol. 2010, 204, 3530–3538.
- Krella, Cavitation Resistance of TiN Nanocrystalline Coatings with Various Thickness. Adv. Mater. Sci. 2009, 9, 12–24.
- Abdoos, ; Yamamoto, K.; Bose, B.; Fox-Rabinovich, G.; Veldhuis, S. Effect of coating thickness on the tool wear performance of low stress TiAlN PVD coating during turning of compacted graphite iron (CGI). Wear 2019, 422–423, 128–136.
- Zhao, ; Liu, Z. Influences of coating thickness on cutting temperature for dry hard turning Inconel 718 with PVD TiAlN coated carbide tools in initial tool wear stage. J. Manuf. Process. 2020, 56, 1155–1165.
- Skordaris, ; Bouzakis, K.D.; Kotsanis, T.; Charalampous, P.; Bouzakis, E.; Breidenstein, B.; Bergmann, B.; Denkena, B. Effect of PVD film’s residual stresses on their mechanical properties, brittleness, adhesion and cutting performance of coated tools. CIRP J. Manuf. Sci. Technol. 2017, 18, 145–151.
- Krella, Cavitation erosion of TiN and CrN coatings deposited on different substrates. Wear 2013, 297, 992–997.
- Krella, An experimental parameter of cavitation erosion resistance for TiN coatings. Wear 2011, 270, 252–257.
- Han, ; Lin, J.; Kuo, J.; He, J.; Shih, H. The cavitation-erosion phenomenon of chromium nitride coatings deposited using cathodic arc plasma deposition on steel. Surf. Coat. Technol. 2002, 161, 20–25.
- Krella, K. Cavitation erosion resistance of Ti / TiN multilayer coatings. Surf. Coat. Technol. 2013, 228, 115–123.
- Ali, ; Sebastiani, M.; Bemporad, E. Influence of Ti-TiN multilayer PVD-coatings design on residual stresses and adhesion. Mater. Des. 2015, 75, 47–56.
- Burnett, J.; Rickerby, D.S. The erosion behaviour of TiN coatings on steels. J. Mater. Sci. 1988, 23, 2429–2443.
- Tabakoff, Erosion resistance of superalloys and different coatings exposed to particulate flows at high temperature. Surf. Coat. Technol. 1999, 120–121, 542–547.
- Prashar, ; Vasudev, H.; Thakur, L. Performance of different coating materials against slurry erosion failure in hydrodynamic turbines: A review. Eng. Fail. Anal. 2020, 115, 104622.
- Singh, ; Zafar, S. Effect of microwave exposure time on microstructure and slurry erosion behavior of Ni + 20% Cr7C3 composite clads. Wear 2019, 426–427, 491–500.
- Krella, K.; Buszko, M.H.; Gajowiec, G. Degradation of ferritic X10CrAlSi18 stainless steel caused by slurry. Eng. Fail. Anal. 2020, 116, 104696.
- Recco, A.C.; López, D.; Bevilacqua, A.F.; da Silva, F.; Tschiptschin, A.P. Improvement of the slurry erosion resistance of an austenitic stainless steel with combinations of surface treatments: Nitriding and TiN coating. Surf. Coat. Technol. 2007, 202, 993–997.
- Chen, ; Geng, M.; Li, Y.; Yang, Z.; Chai, Y.; He, G. Erosion resistance and damage mechanism of TiN/ZrN nanoscale multilayer coating. Coatings 2019, 9, .
- Reedy, W.; Eden, T.J.; Potter, J.K.; Wolfe, D.E. Erosion performance and characterization of nanolayer (Ti,Cr)N hard coatings for gas turbine engine compressor blade applications. Surf. Coat. Technol. 2011, 206, 464–472.
- Fang, ; Chen, J.; He, W.; Yang, Z.; Yuan, Z.; Geng, M.; He, G. Study on the damage mechanism of TiN/Ti coatings based on multi-directional impact. Coatings 2019, 9, .
- Sergevnin, S.; Blinkov, I.V.; Belov, D.S.; Smirnov, N.I.; Volkhonskii, A.O.; Kuptsov, K.A. Wear and erosion of arc-PVD multilayer Ti-Al-Mo-N coatings under various conditions of friction and loading. Int. J. Adv. Manuf. Technol. 2018, 98, 593–601.
- Cao, ; Munroe, P.; Zhou, Z.; Xie, Z. Microstructure and mechanical properties of a multilayered CoCrNi/Ti coating with varying crystal structure. Surf. Coat. Technol. 2018, 350, 596–602.
- Borawski, ; Todd, J.A.; Singh, J.; Wolfe, D.E. The influence of ductile interlayer material on the particle erosion resistance of multilayered TiN based coatings. Wear 2011, 271, 2890–2898.
- Naveed, ; Obrosov, A.; Weiß, S. Investigation of the Wear Resistance Properties of Cr/CrN Multilayer Coatings against Sand Erosion. Conf. Pap. Sci. 2015, 2015, 1–9.
- Maurer, ; Schulz, U. Erosion resistant titanium based PVD coatings on CFRP. Wear 2013, 302, 937–945.
- Zhang, ; Niu, Y.; Xin, L.; Su, J.; Li, Y.; Wu, T.; Zhao, H.; Zhang, Y.; Xie, W.; Zhu, S.; et al. Studies on corrosion resistance of thick Ti/TiN multilayer coatings under solid NaCl–H2O–O2 at 450 °C. Ceram. Int. 2020, 46, 19274–19284.
- Deng, ; Wu, F.; Lian, Y.; Xing, Y.; Li, S. Erosion wear of CrN, TiN, CrAlN, and TiAlN PVD nitride coatings. Int. J. Refract. Met. Hard Mater. 2012, 35, 10–16.
- Van Stappen, ; Stals, L.M.; Kerkhofs, M.; Quaeyhaegens, C. State of art for industrial use of ceramic PVD coatings. Surf. Coat. Technol. 1995, 74–75, 629–633.
- Konyashin, Y. PVD / CVD technology for coating cemented carbides. Surf. Coat. Technol. 1995, 71, 277–283.
- Sproul, D. Physical vapor deposition tool coatings. Surf. Coat. Technol. 1996, 81, 1–7.
- He, ; Paiva, J.M.; Kohlscheen, J.; Beake, B.D.; Veldhuis, S.C. An integrative approach to coating/carbide substrate design of CVD and PVD coated cutting tools during the machining of austenitic stainless steel. Ceram. Int. 2020, 46, 5149–5158.
- Antonov, ; Afshari, H.; Baronins, J.; Adoberg, E.; Raadik, T.; Hussainova, I. The effect of temperature and sliding speed on friction and wear of Si3N4, Al2O3, and ZrO2 balls tested against AlCrN PVD coating. Tribol. Int. 2018, 118, 500–514.
- Pancielejko, ; Precht, W.; Czyzniewski, A. Tribological properties of PVD titanium carbides. Vacuum 1999, 53, 57–60.
- Bromark, ; Larsson, M.; Hedenqvist, P.; Hogmark, S. Wear of PVD Ti/TiN multilayer coatings. Surf. Coat. Technol. 1997, 90, 217–223.
- Borjali, ; Monson, K.; Raeymaekers, B. Predicting the polyethylene wear rate in pin-on-disc experiments in the context of prosthetic hip implants: Deriving a data-driven model using machine learning methods. Tribol. Int. 2019, 133, 101–110.
- Kong, ; Tian, X.; Gong, C.; Chu, P.K. Enhancement of toughness and wear resistance by CrN/CrCN multilayered coatings for wood processing. Surf. Coat. Technol. 2018, 344, 204–213.
- Chavda, R.; Dave, D.P.; Chauhan, K.V.; Rawal, S.K. Tribological Characterization of TiN Coatings Prepared by Sputtering. Procedia Technol. 2016, 23, 36–41.
- Beer, ; Djouadi, M.A.; Marchal, R.; Sokolowska, A.; Lambertin, M.; Czyzniewski, A.; Precht, W. Antiabrasive coatings in a new application-wood rotary peeling process. Vacuum 1999, 53, 363–366.
- Ding, -Z.; Zeng, X.T. Structural, mechanical and tribological properties of CrAlN coatings deposited by reactive unbalanced magnetron sputtering. Surf. Coat. Technol. 2005, 200, 1372–1376.
- Mo, L.; Zhu, M.H. Tribological oxidation behaviour of PVD hard coatings. Tribol. Int. 2009, 42, 1758–1764.
- Tan, ; Fu, L.; Teng, J.; Zhu, J.; Yang, W.; Li, D.; Zhou, L. Effect of texture on wear resistance of tantalum nitride film. Tribol. Int. 2019, 133, 126–135.
- Mejía, D.; Development and characterization of TiAlN(Ag,Cu) nanocomposite coatings deposited by DC magnetron sputtering for tribological applications. Surf. Coat. Technol. 2020, 381, 125095.
- Khanchaiyaphum, ; Saikaew, C.; Wisitsoraat, A.; Surinphong, S. Wear behaviours of filtered cathodic arc deposited TiN, TiAlSiN and TiCrAlSiN coatings on AISI 316 stainless steel fishing net-weaving machine components under dry soft-sliding against nylon fibres. Wear 2017, 390–391, 146–154.
- Yan, ; Jiang, D.; Gao, X.; Hu, M.; Wang, D.; Fu, Y.; Sun, J.; Feng, D.; Weng, L. Friction and wear behavior of TiN films against ceramic and steel balls. Tribol. Int. 2018, 124, 61–69.
- Holleck, ; Schier, V. Multilayer PVD coatings for wear protection. Surf. Coat. Technol. 1995, 76–77, 328–336.
- Pougoum, ; Qian, J.; Laberge, M.; Martinu, L.; Klemberg-Sapieha, J.; Zhou, Z.; Li, K.Y.; Savoie, S.; Schulz, R. Investigation of Fe3Al-based PVD/HVOF duplex coatings to protect stainless steel from sliding wear against alumina. Surf. Coat. Technol. 2018, 350, 699–711.
- Gilewicz, ; Warcholinski, B. Tribological properties of CrCN/CrN multilayer coatings. Tribol. Int. 2014, 80, 34–40.
- Cheng, H.; Browne, T.; Heckerman, B.; Bowman, C.; Gorokhovsky, V.; Meletis, E.I. Mechanical and tribological properties of TiN/Ti multilayer coating. Surf. Coat. Technol. 2010, 205, 146–151.
- Dobrzański, A.; Pakuła, D.; Hajduczek, E. Structure and properties of the multi-component TiAlSiN coatings obtained in the PVD process in the nitride tool ceramics. J. Mater. Process. Technol. 2004, 157–158, 331–340.
- Srinivasan, ; Kulkarni, T.G.; Anand, K. Thermal stability and high-temperature wear of Ti-TiN and TiN-CrN nanomultilayer coatings under self-mated conditions. Tribol. Int. 2007, 40, 266–277.
- Panjan, ; Drnovšek, A.; Gselman, P.; Čekada, M.; Panjan, M. Review of growth defects in thin films prepared by PVD techniques. Coatings 2020, 10, 447.
- Mozgovoy, ; Alik, L.; Hardell, J.; Prakash, B. Material transfer during high temperature sliding of Al-Si coated 22MnB5 steel against PVD coatings with and without aluminium. Wear 2019, 426–427, 401–411.
- Leyland, ; Matthews, A. On the significance of the H/E ratio in wear control: A nanocomposite coating approach to optimised tribological behaviour. Wear 2000, 246, 1–11.
- Volosova, ; Fyodorov, S.; Opleshin, S.; Mosyanov, M. Wear Resistance and Titanium Adhesion of Cathodic Arc Deposited Multi-Component Coatings for Carbide End Mills at the Trochoidal Milling of Titanium Alloy. Technologies 2020, 8, 38.
- Silva, ; Martinho, R.; Andrade, M.; Baptista, A.; Alexandre, R. Improving the wear resistance of moulds for the injection of glass fibre-reinforced plastics using PVD coatings: A comparative study. Coatings 2017, 7, .
- Lawal, J.; Kiryukhantsev-Korneev, P.; Matthews, A.; Leyland, A. Mechanical properties and abrasive wear behaviour of Al-based PVD amorphous/nanostructured coatings. Surf. Coat. Technol. 2017, 310, 59–69.

