Your browser does not fully support modern features. Please upgrade for a smoother experience.
Please note this is a comparison between Version 4 by Dean Liu and Version 3 by Dean Liu.
High energy systems, which are more dominant in northern Europe, are generally heavily climate controlled and energy use is dominated by heating and cooling processes, while low energy systems, which are dominant in southern Europe, show a mixture of energy uses including heating, cooling, irrigation, lighting, fertilisers, and pesticides.
- energy-use in agriculture
- fossil-energy-free technologies and strategies
- FEFTS
- greenhouses
1. Introduction
In the EU, greenhouse structure and cultivation show considerable variation, ranging from complex energy intensive structures that heavily regulate the indoor climate to simple structures that resemble open-field practices. This variation is dependent on a variety of factors, including, but not limited to, local climatic and socio-economic conditions [1]. According to the FAO, an estimated 405,000 hectares of greenhouses are spread throughout the EU [2], a figure that includes both glass and plastic covered structures. By contrast, data from Eurostat provide an overview of the area of vegetables, flowers and permanent crops under glass in the EU-27 from 2005–2013, highlighting that there are around 135,000 hectares of glass covered (excluding plastic covered) greenhouse cultivation in the EU [3].
Greenhouse agricultural production is generally seen as one of the most intensive parts of agricultural production [4][5] as compared to energy use in open-field agriculture [6], however the role of greenhouse agriculture in the European food systems is not well-documented [1], while a small number of studies have been conducted that document energy use in greenhouse production. In 2013, the European Commission published a report on greenhouse production, however this only includes only some minor energy use statistics [5]. Campioti et al. (2012) investigate some of the energy parameters in the greenhouse sector in four European countries [7]. Mohamed et al. (2017) investigate the energy profile of greenhouses in Cyprus [8], while Wageningen University releases an annual report monitoring energy use within the Dutch greenhouse sector [9]. Regarding geography, the Netherlands in particular has the largest and most relevant energy use data available [9]. Nikolaou et al. (2021) investigates energy parameters in greenhouse tomato and cucumber production in semiarid Mediterranean areas [10]. Other studies that look at agricultural production or energy use in the agricultural sector generally provide no data on energy use in greenhouses specifically [11].
In this context, where it is clear that greenhouse cultivation is a significant energy consumer but there is relatively little data available, and taking into account the implementation of EU climate targets and its farm to fork strategy in agriculture, it is apparent that there is a need to move towards sustainable production practices. In order to understand the future of greenhouse production in the EU and how they can contribute to a sustainable transformation of the agricultural systems, it is necessary to understand the energy use in greenhouses.
2. Greenhouses in the EU and Their Energy Use Parameters
Greenhouses are complex structures which aim to create ideal conditions for plant growth and production throughout the year, by controlling temperature, humidity, water, light, and carbon dioxide [12]. There are different types of greenhouses currently in operation in the EU, ranging from intensive structures that heavily regulate the internal environment to those that are solely plastic sheet covered structures in which production inputs are similar to open-field crops [5]. Over the last two decades, the technology associated with the construction of and agricultural production within advanced greenhouses has progressed considerably with significant changes in design, materials, agricultural techniques, etc. Consequently, the potential yield in ‘technology intensive’ greenhouses has seen dramatic increases, for instance, what is considered a ‘good’ tomato yield has increased from 100 tonnes per hectare to 600 tonnes per hectare in recent years [13]. There are a variety of options for heating a greenhouse, including air heaters, central heating through pipes, boilers, cogeneration, natural gas, electricity, heat pumps [14]. Energy sources vary, with small systems often running on direct fossil fuels, such as gas or oil, while larger systems may run on cogeneration/combined heat and power from power plants, or geothermal heat pumps. It is important to note that a large proportion of greenhouses, especially in Southern Europe, are not heated, while in temperate and northern European countries greenhouses often have large heating requirements. Conversely, there are a number of options for cooling a greenhouse, including shading, whitening, natural, mechanical or evaporative cooling/ventilation. One or a combination of these are utilised in areas that have high average temperatures for parts of the year [5]. All production in greenhouses requires irrigation for which there are a variety of systems, generally powered through fossil fuels directly or via the electricity network [5]. Other areas that consume direct energy include lighting and machinery use. Greenhouses generally are also dependent on a number of indirect sources of energy; energy that is not directly used in agricultural production but can clearly be assigned to the agricultural sector. Indirect energy use includes energy use associated with the building of greenhouses and greenhouse machinery, as well as energy embedded in the production of fertilizers and pesticides [15]. There are a number of trends and parameters that affect the energy inputs of greenhouses. Multiple studies highlight that older systems are generally less energy efficient and require higher energy inputs per output [16][17]. Geography and climate conditions also clearly play an important role [18], while the type and philosophy of agricultural practices and techniques-conventional, organic, conservation, soilless cultivation, hydroponic, etc., employed in greenhouses are also likely to impact energy inputs. In practice, greenhouse systems in the EU vary significantly ranging from commercial large-scale systems to small-scale subsistence systems and their design and structure varies considerably, having large implications on energy use and energy sources [5]. The extent of greenhouse production per country is not well documented. For most EU countries, other than the Netherlands, there are rough estimates on the extent of greenhouse cultivation, in particular regarding greenhouses with a low technological profile. Eurostat used to provide an indicator on the area of vegetables, flowers, and permanent crops under glass EU-27 (ha), this has now been discontinued. Based on the data presented in Table 1, from Eurostat, the countries cover around 72% of the total area under glass in the EU.Table 1. Area of vegetables, flowers, and permanent crops under glass EU-27 (ha) [19].
3. Energy Use for Greenhouses in the EU Per Country and Crop
3.1. Overview
The following section provides a review of energy use data for Spain, Greece, Italy, The Netherlands, and Germany, as well as according to tomato production in the EU. Overall, the data presented illustrates significant variation between varying production systems with significant ranges depending on the type of greenhouse, geographical area, and crop grown (Table 2).Table 2. Range of energy consumption per category in EU greenhouses (%).
| Energy Consumption per Category | Range of Total Energy Consumption |
|---|---|
| Heating and cooling | 0–99% |
| Irrigation | 1–19% |
| Fertilizers | 1–27% |
| Pesticides | 0–6% |
| Lighting | 1% |
| Country | 2005 | 2007 | 2010 | 2013 |
|---|---|---|---|---|
| Belgium | 2140 | 2120 | 2060 | 1800 |
| Bulgaria | 900 | 1140 | 1090 | 1080 |
| Czechia | 180 | 190 | 0 | 0 |
| Denmark | 450 | 470 | 460 | 400 |
| Germany (until 1990 former territory of the FRG) | 3370 | 3430 | 3170 | 3110 |
| Estonia | 60 | 60 | 40 | 40 |
| Ireland | 60 | 30 | 60 | 180 |
| Greece | 4670 | 5340 | 4290 | 4730 |
| Spain | 52,170 | 52,720 | 45,700 | 45,200 |
| France | 9620 | 9790 | : | 11,190 |
| Croatia | : | 250 | 410 | 500 |
| Italy | 28,640 | 26,500 | 39,100 | 38,910 |
| Cyprus | 420 | 430 | 450 | 420 |
| Latvia | 110 | 80 | 50 | 40 |
| Lithuania | 1010 | 450 | 310 | 330 |
| Luxembourg | 0 | 10 | 0 | 0 |
| Hungary | 1910 | 1760 | 1960 | 2260 |
| Malta | 70 | 70 | 80 | 100 |
| Netherlands | 10,540 | 10,370 | 9820 | 9330 |
| Austria | 290 | 580 | 620 | 720 |
| Poland | 7170 | 7560 | 6630 | 8080 |
| Portugal | 2310 | 2220 | 2360 | 2490 |
| Romania | 2790 | 3250 | 3020 | 3300 |
| Slovenia | 170 | 180 | 170 | 160 |
| Slovakia | 250 | 190 | 150 | 100 |
| Finland | 450 | 440 | 420 | 400 |
| Sweden | 420 | 180 | 200 | 260 |
| Total | 130,170 | 129,810 | 122,620 | 135,130 |
3.2. Spain
Spain has the largest greenhouse sector by area in the EU with an estimated 43,964 hectares under greenhouse production and is the largest supplier of greenhouse vegetables in Europe. In total, 60% of Spain’s greenhouses (approximately 30,000 ha) are located in Almeria [20][21], which constitutes the largest concentration of greenhouses in the world. The main types of crops cultivated in these greenhouses are tomato with 26% of total area, pepper (22%), zucchini (16%), cucumber (11%), aubergine (4.5%), and green bean (3%) [22]. There is variation in the type of greenhouses, with a mixture of intensive and non-intensive greenhouses, while the average holding sizes are relatively small. Two studies that document energy use in Spanish greenhouses were located; Baptista et al. (2012), which provides data on the heating and cooling greenhouses with tomato production [23], and Alonso and Guzman (2010), who investigate energy use in a range of Spanish production systems [24]. In Baptista et al.’s (2012) study, the greenhouses studied are heavily climatically controlled and exhibit large energy inputs (Figure 1 and Table A1), while the greenhouses covered by Alonso and Guzman (2010) are less climate-controlled and exhibit considerably—up to 150 times—less energy inputs per hectare (Figure 2 and Table A2). The largest energy use category for these greenhouses is the category ‘others,’ unfortunately the study does not provide a breakdown of what inputs/activities this refers to. The category likely refers to ventilation and lighting.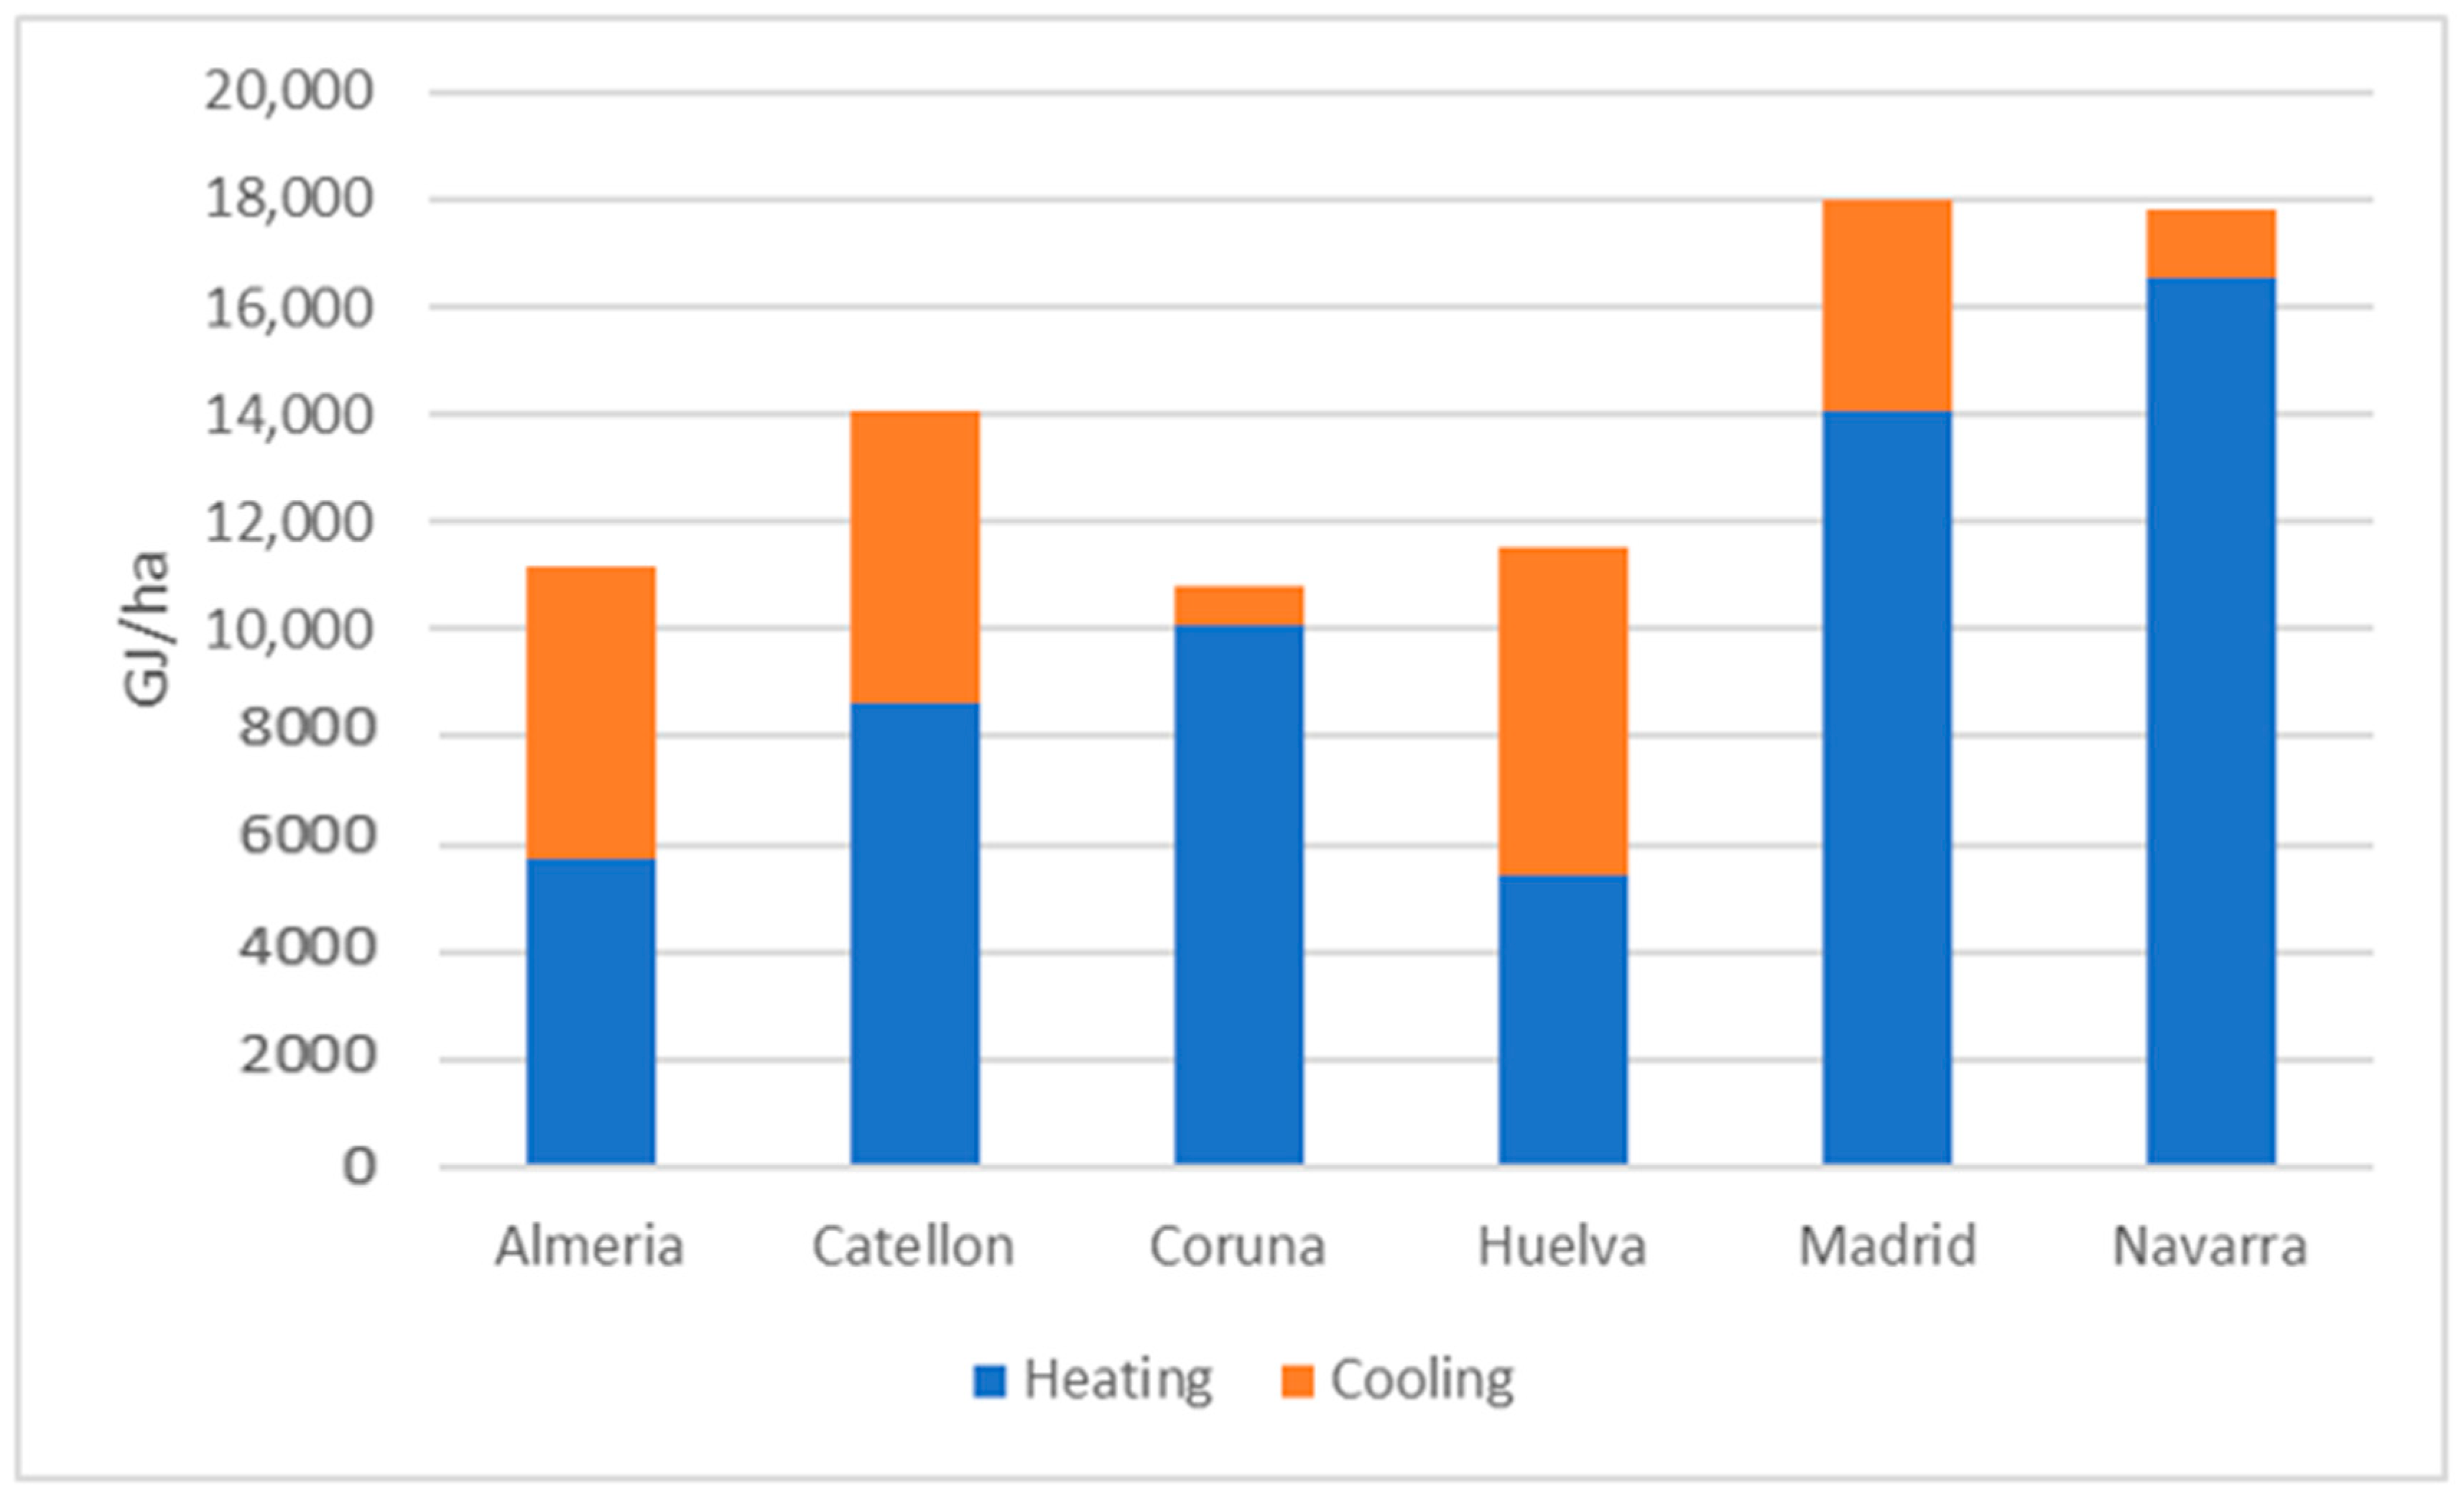
Figure 1. Energy consumption in high energy intensity tomato greenhouse production in Spain (GJ/ha) (based on [23]).
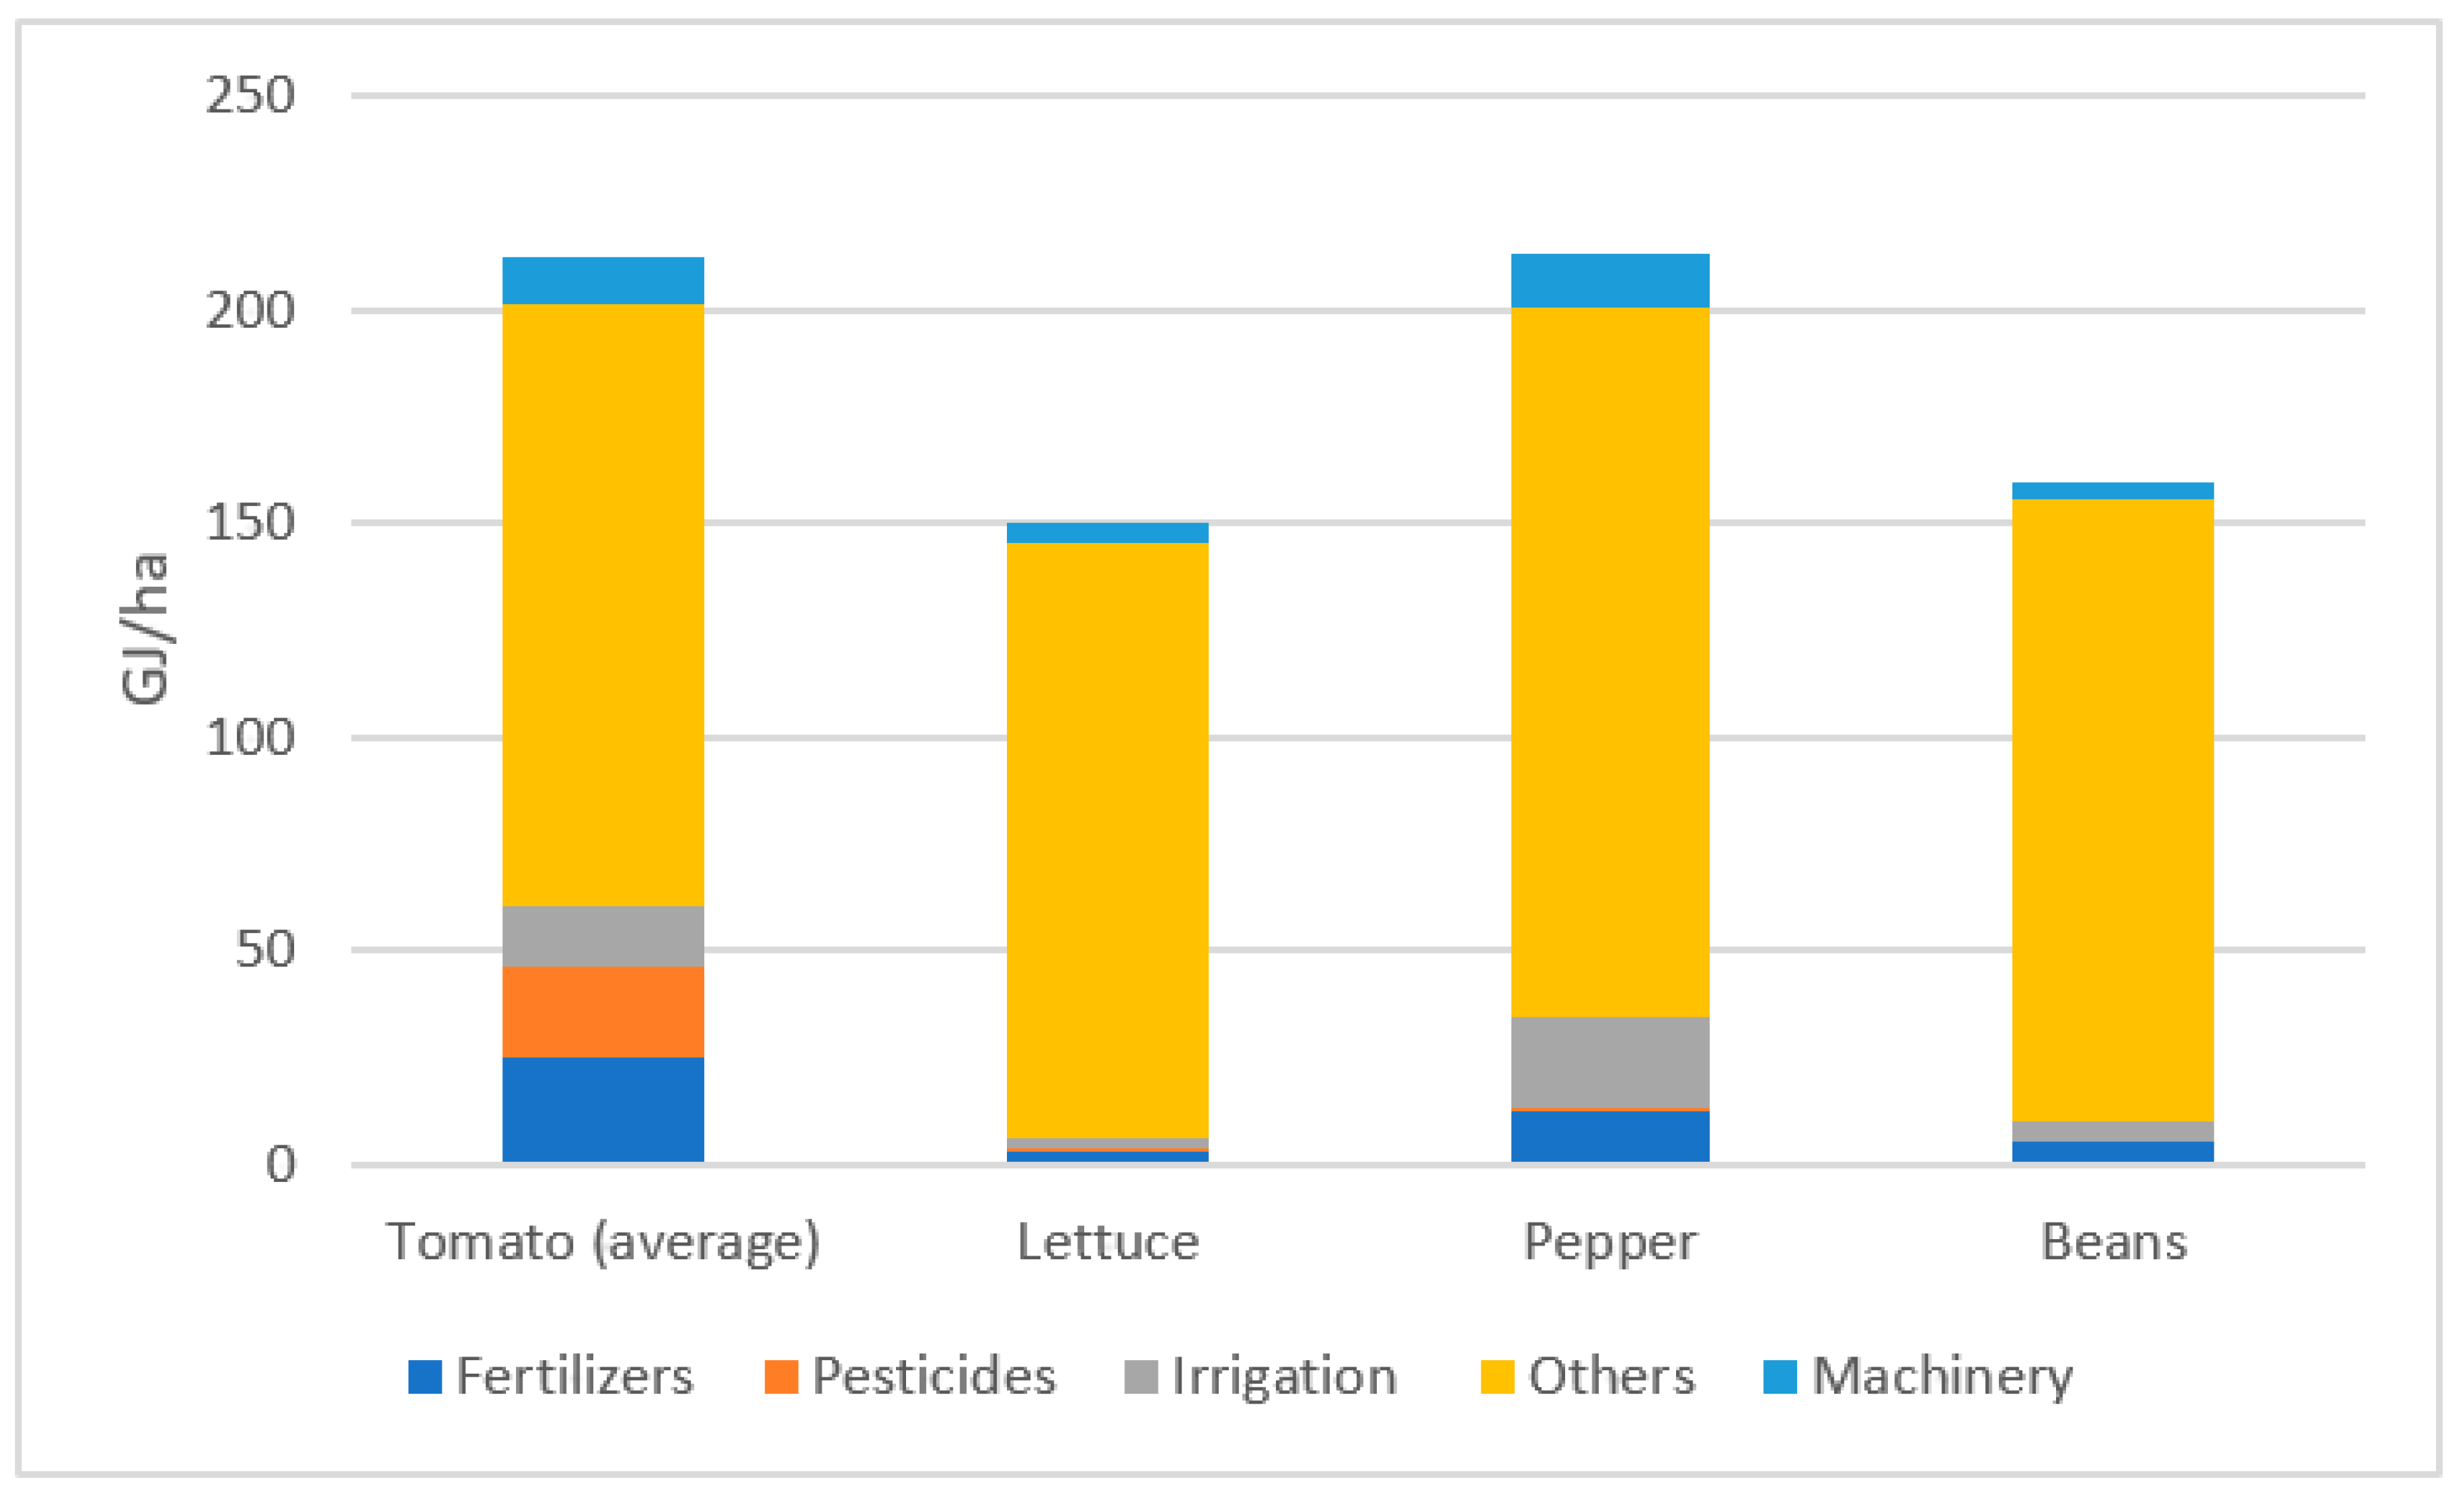
Figure 2. Energy consumption in low energy intensity greenhouse production in Spain (GJ/ha) (based on [24]).
3.3. Greece
In Greece, the area under greenhouse cultivation is approximately 5600 ha, which represents around 0.12% of the country’s total cultivated land area. The majority of this area, around 92%, is allocated to vegetable production, whereas the remaining 8% is allocated to the production of ornamental crops. The most common vegetable crops grown in Greek greenhouses are tomato, cucumber, and pepper. Geographically, Crete has the largest area of greenhouse production with 2166.5 ha (38.7%), followed by the Peloponnese with 1185.9 ha (21.2%) and Macedonia with 698 ha (12.5%) [25]. Around 93% of the total area are plastic covered greenhouses, whereas glasshouses are mainly used in floriculture. The limited use of glass coverage is due to two main factors; the very low mean area per greenhouse enterprise at 0.48 ha for vegetables, and the fact that the majority of the greenhouse area used for vegetables is occupied by high tunnels. Greenhouses in Greece are characterized by a relatively low level of automation. Generally, the productivity of Greek greenhouses has been shown to benefit from both heating and cooling systems. However, the cost of greenhouse heating fuel and cooling in Greece is relatively high and is a major barrier to the implementation of these systems [25]. Four studies were located that provide data on energy use in greenhouse production in Greece; De Visser et al. (2012) conduct two LCAs for low energy intensity greenhouse production [15] (Figure 3), while Kittas et al. (2014) [26], Trypanagnostopoulos et al. (2017) [27] and Vourdoubas (2015) [28] each provide data on energy use for a specific crop—tomato, lettuce, flowers—in a high energy intensity production (Figure 3 and Table A3). Figure 4 illustrates that for low energy intensive greenhouses, demand for energy inputs is spread across fertilizers, materials, irrigation, pesticide, lighting, heating, and cooling (Table A4). By contrast, in high energy intensity greenhouses, energy used for heating dominates the consumption. For both crops covered in the low energy intensity greenhouses, the energy inputs are around 250 GJ/ha, whereas in high energy intensity greenhouses they are many times higher, ranging from around 7000 GJ/ha to 11,500 GJ/ha.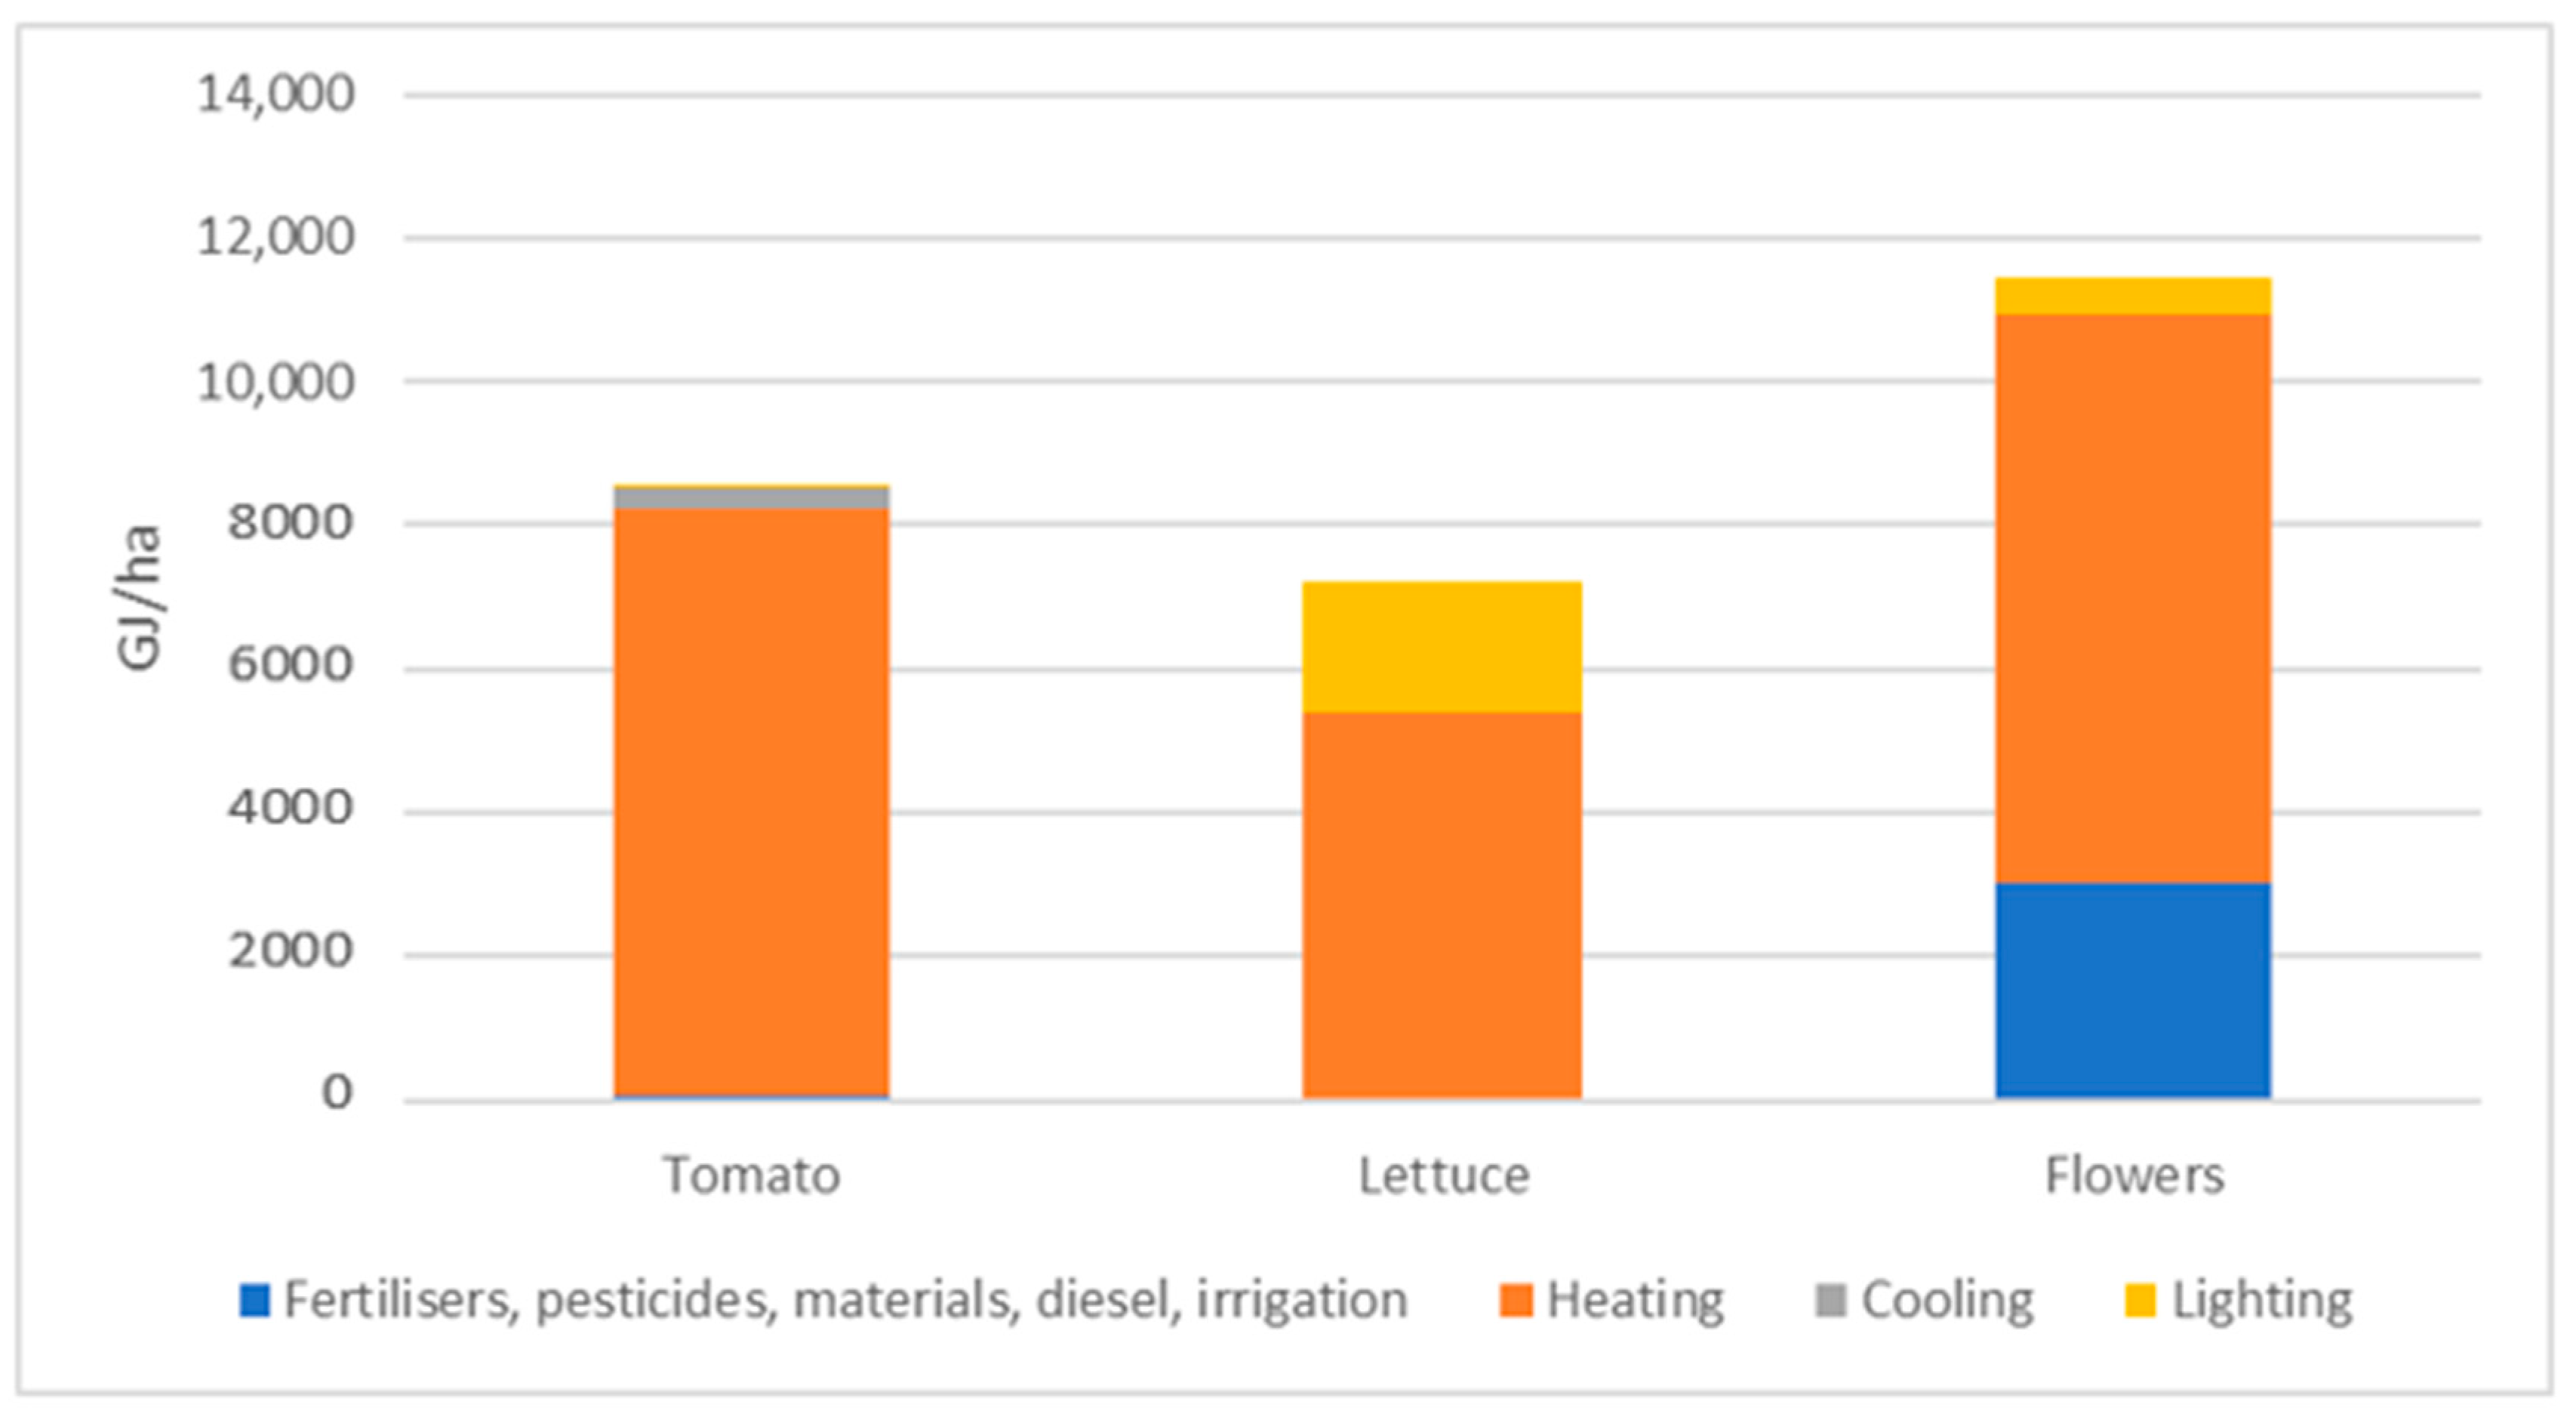
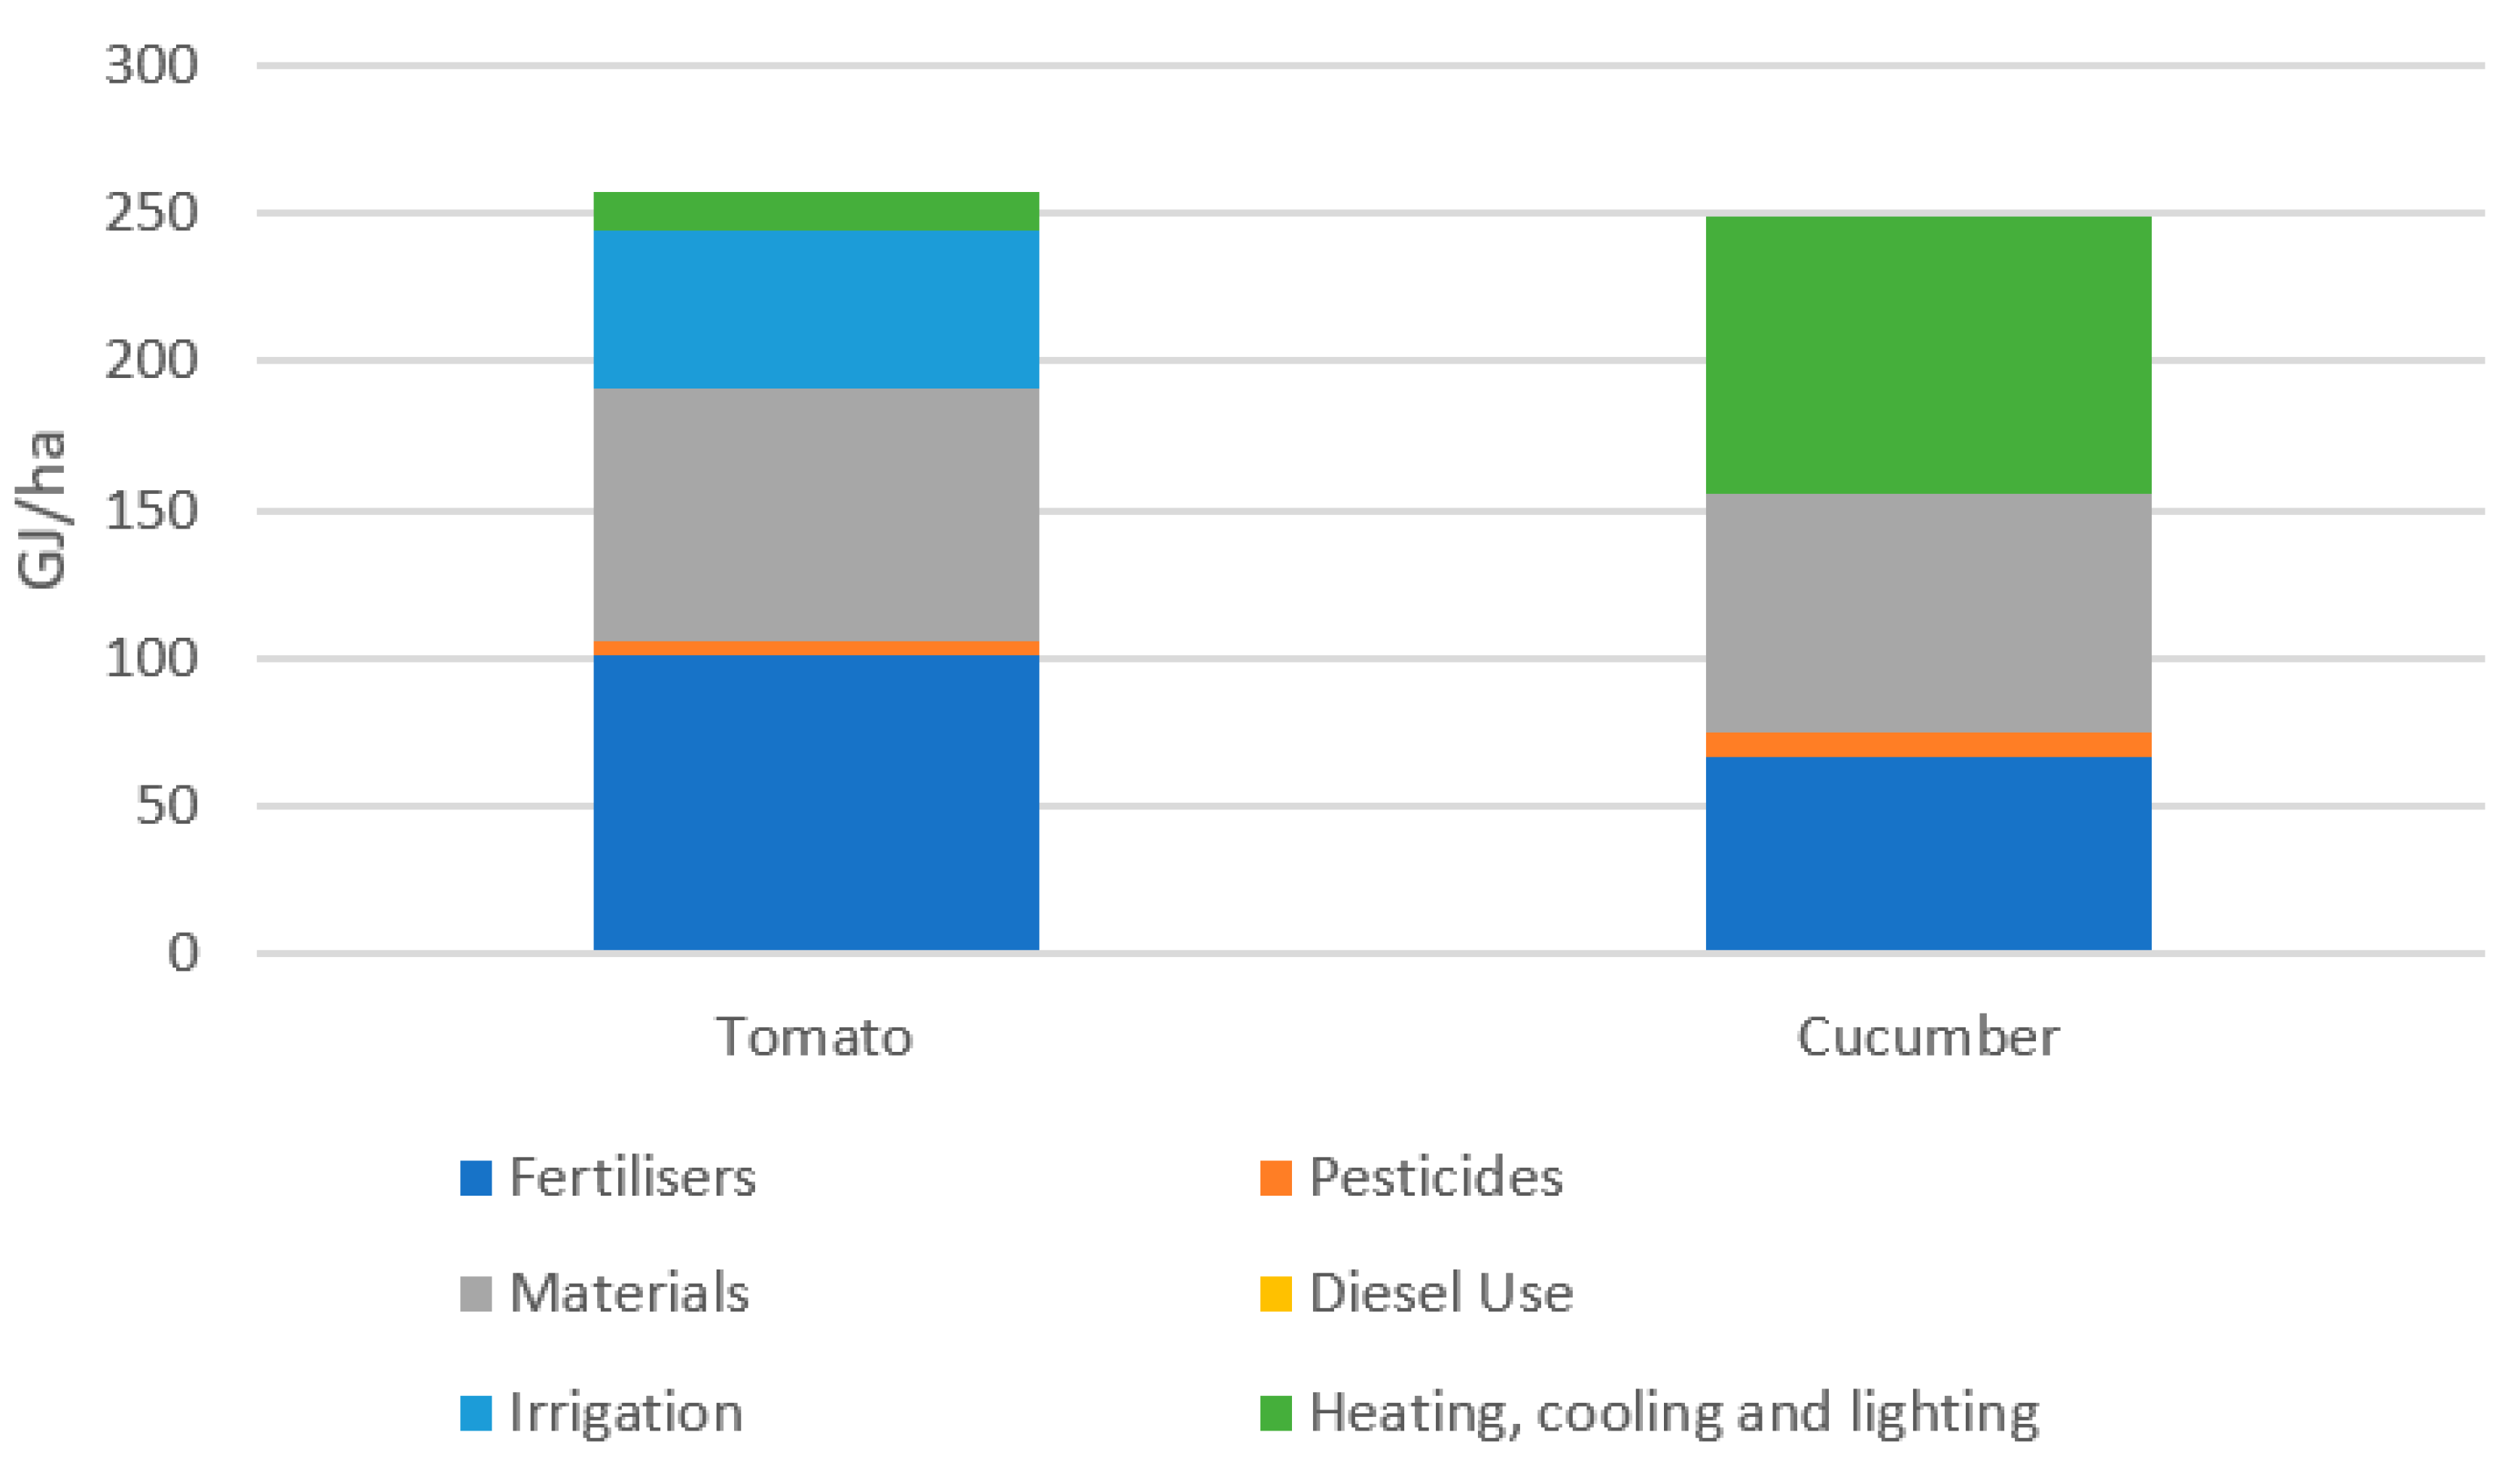
Figure 4. Energy consumption in low energy intensity greenhouse production in Greece (GJ/ha) (based on [15]).
3.4. Italy
The area under greenhouse cultivation in Italy is approximately 30,000 ha, with 6000 ha serving as permanent greenhouse structures [20]. The greenhouses in Italy are distributed all over the Italian peninsula with the majority, about 60%, located in southern regions. There are different types of greenhouses used, ranging from simple structures covered by plastic films to fully automated glass structures [29]. The former greenhouse type is predominant in southern regions due to favourable climatic conditions, which allow for the use of simple and inexpensive structures for winter cropping of warm season species, and are usually equipped with simple heating systems. On the other hand, greenhouses situated in the northern areas of Italy consist, mostly, of structures covered with glass. It is calculated that approximately 20–30% of the Italian greenhouses are equipped with heating and cooling systems [30]. Due to favourable growing conditions and reduced costs, greenhouse cultivation has been moving southward. The cultivation of pot plants occurs in glasshouses and is generally found in northern regions [29]. The Italian greenhouse sector is of considerable economic importance for the national agricultural systems and a significant energy consumer. Even though Italian greenhouse systems only represent around 0.032% of the EU UAA, Italian greenhouse crops account for a turnover of more than EUR 3 billion [31], and according to the Italian Ministry of Economy and Finance, heating for greenhouses powered by fuel accounts for 0.72 millions of tonnes of oil equivalent (Mtoe), which is equivalent to nearly 24% of the direct energy consumption in Italian agriculture, while electricity use in greenhouses accounts for only 0.02 Mtoe [20]. Data for Italy were only located for crops cultivated in low energy intensity greenhouses in central Italy (Figure 5 and Table A5). Within these data, energy use ranges between 60 GJ/ha to 140 GJ/ha and suggest that electricity accounts for around half of all energy inputs, followed by diesel at around a quarter of all energy inputs [32].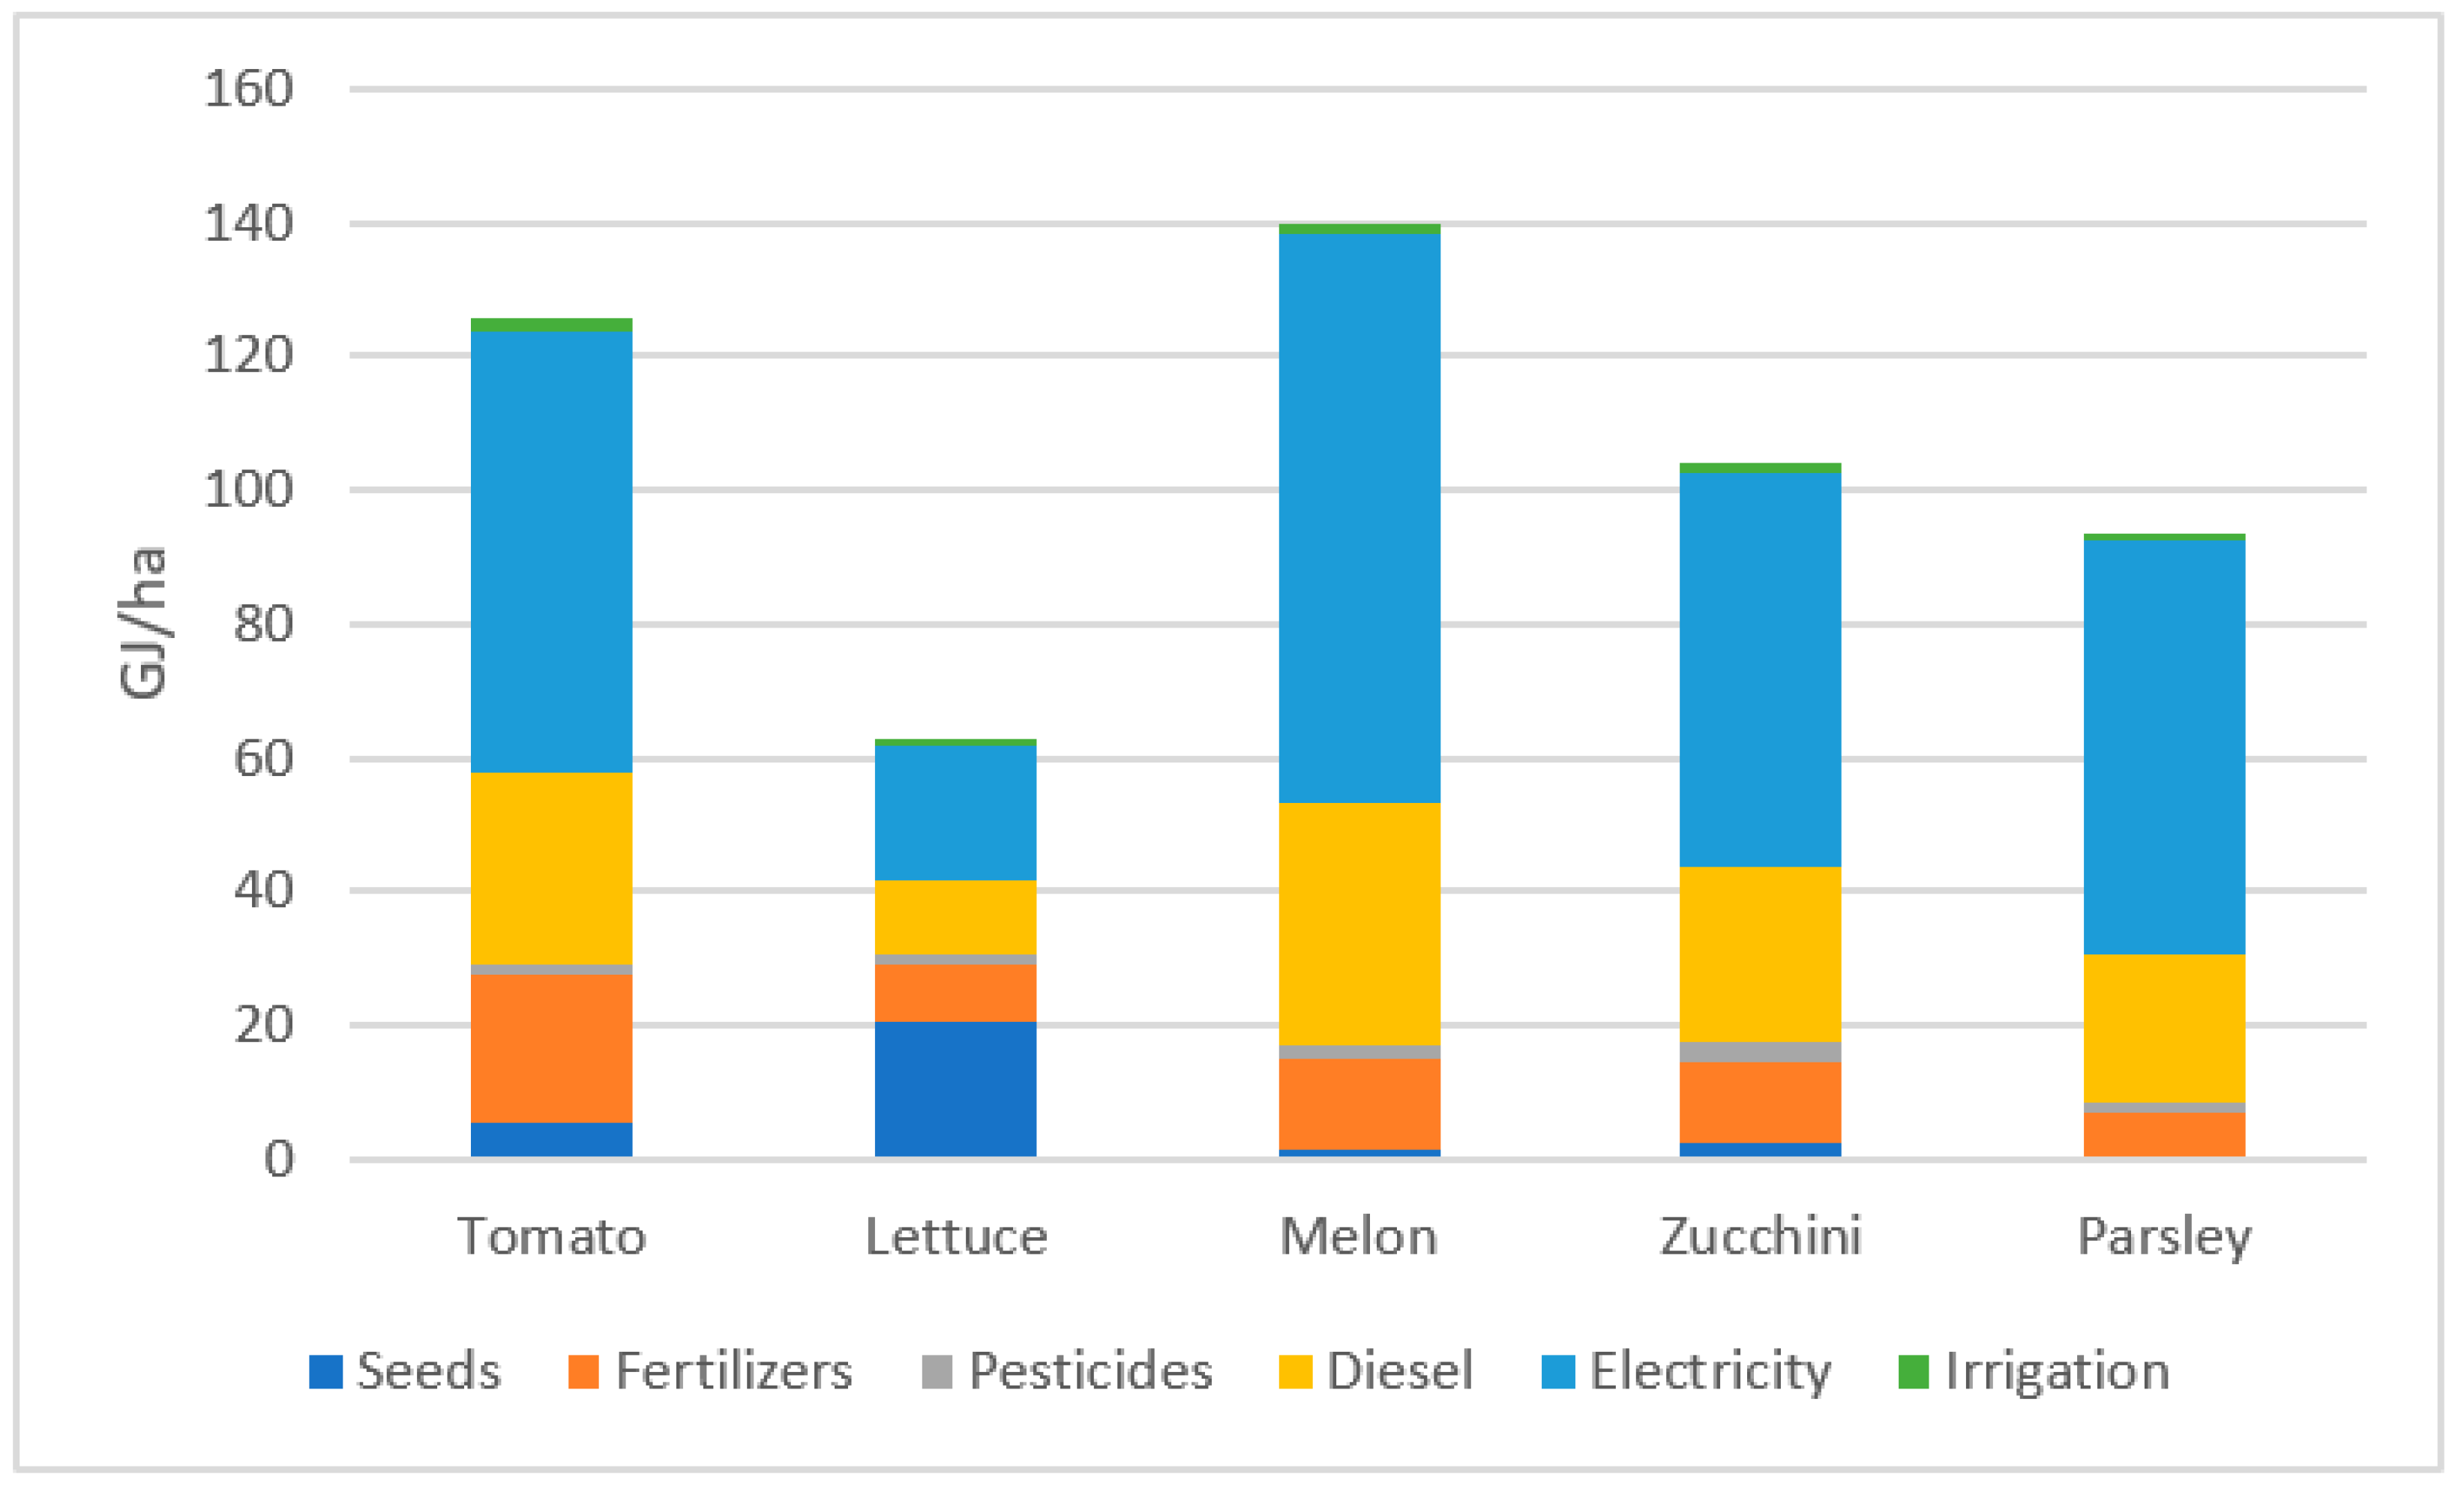
Figure 5. Energy consumption low-energy intensity greenhouse production in Italy (GJ/ha) (based on [32]).
3.5. The Netherlands
In the Netherlands, 9688 ha are covered by greenhouses; around 45% of this is devoted to vegetable production, 25% to flower production, and 15% to fruit production. Production is generally intensive and yields are high, especially as compared to greenhouse production in other countries, with average production per m2 in 2019 at 50 kg for tomatoes and 68 kg for cucumbers [33]. Due to this production intensity, The Netherlands produces 21% of the peppers, 20% of the cucumbers and 17% of the tomatoes grown in Europe [34]. Dutch greenhouses are generally characterized by large permanent structures that are heavily climate controlled, with large scale heating, cooling, lighting, and ventilation facilities. In recent years, large transitions have occurred that have started to improve efficiency and dramatically cut the amounts of inputs used, such as water and pesticides. According to the annual publication of the energy monitor of the Dutch greenhouse sector, the total current energy consumption in the Dutch greenhouse sector stands at 106.8 petajoules (PJ) [9]. Most energy consumption is associated with heating, accounting for around 74% of the total energy inputs, and electricity at 26%. Overall, energy use is dominated by energy from natural gas (accounting for 99.9% of the total fossil sources). Around 58% of electricity was produced at the greenhouses by cogeneration, while 42% was purchased. In 2019, 10 PJ (9.4%) of the energy consumed in the Dutch greenhouse sector came from renewable sources. Energy from renewable sources has been growing rapidly in recent years and increased by 35% between 2017 and 2018. In particular, sustainable (mainly geothermal) heat has been growing rapidly, a trend that is likely to continue [9]. On a per crop basis, for the studies that have detailed data, the vast majority of the total energy inputs are connected with heating, accounting for over 99% of energy use, while other inputs, such as fertilizers, are minor (Figure 6 and Table A6). It is important to note that these energy requirements are amongst the highest recorded for all greenhouses in the EU-27. The most important activities for greenhouses in the Netherlands are heating, ventilation and air circulation, cooling, humidification, irrigation, pesticides, CO2 enrichment, and others [9][35].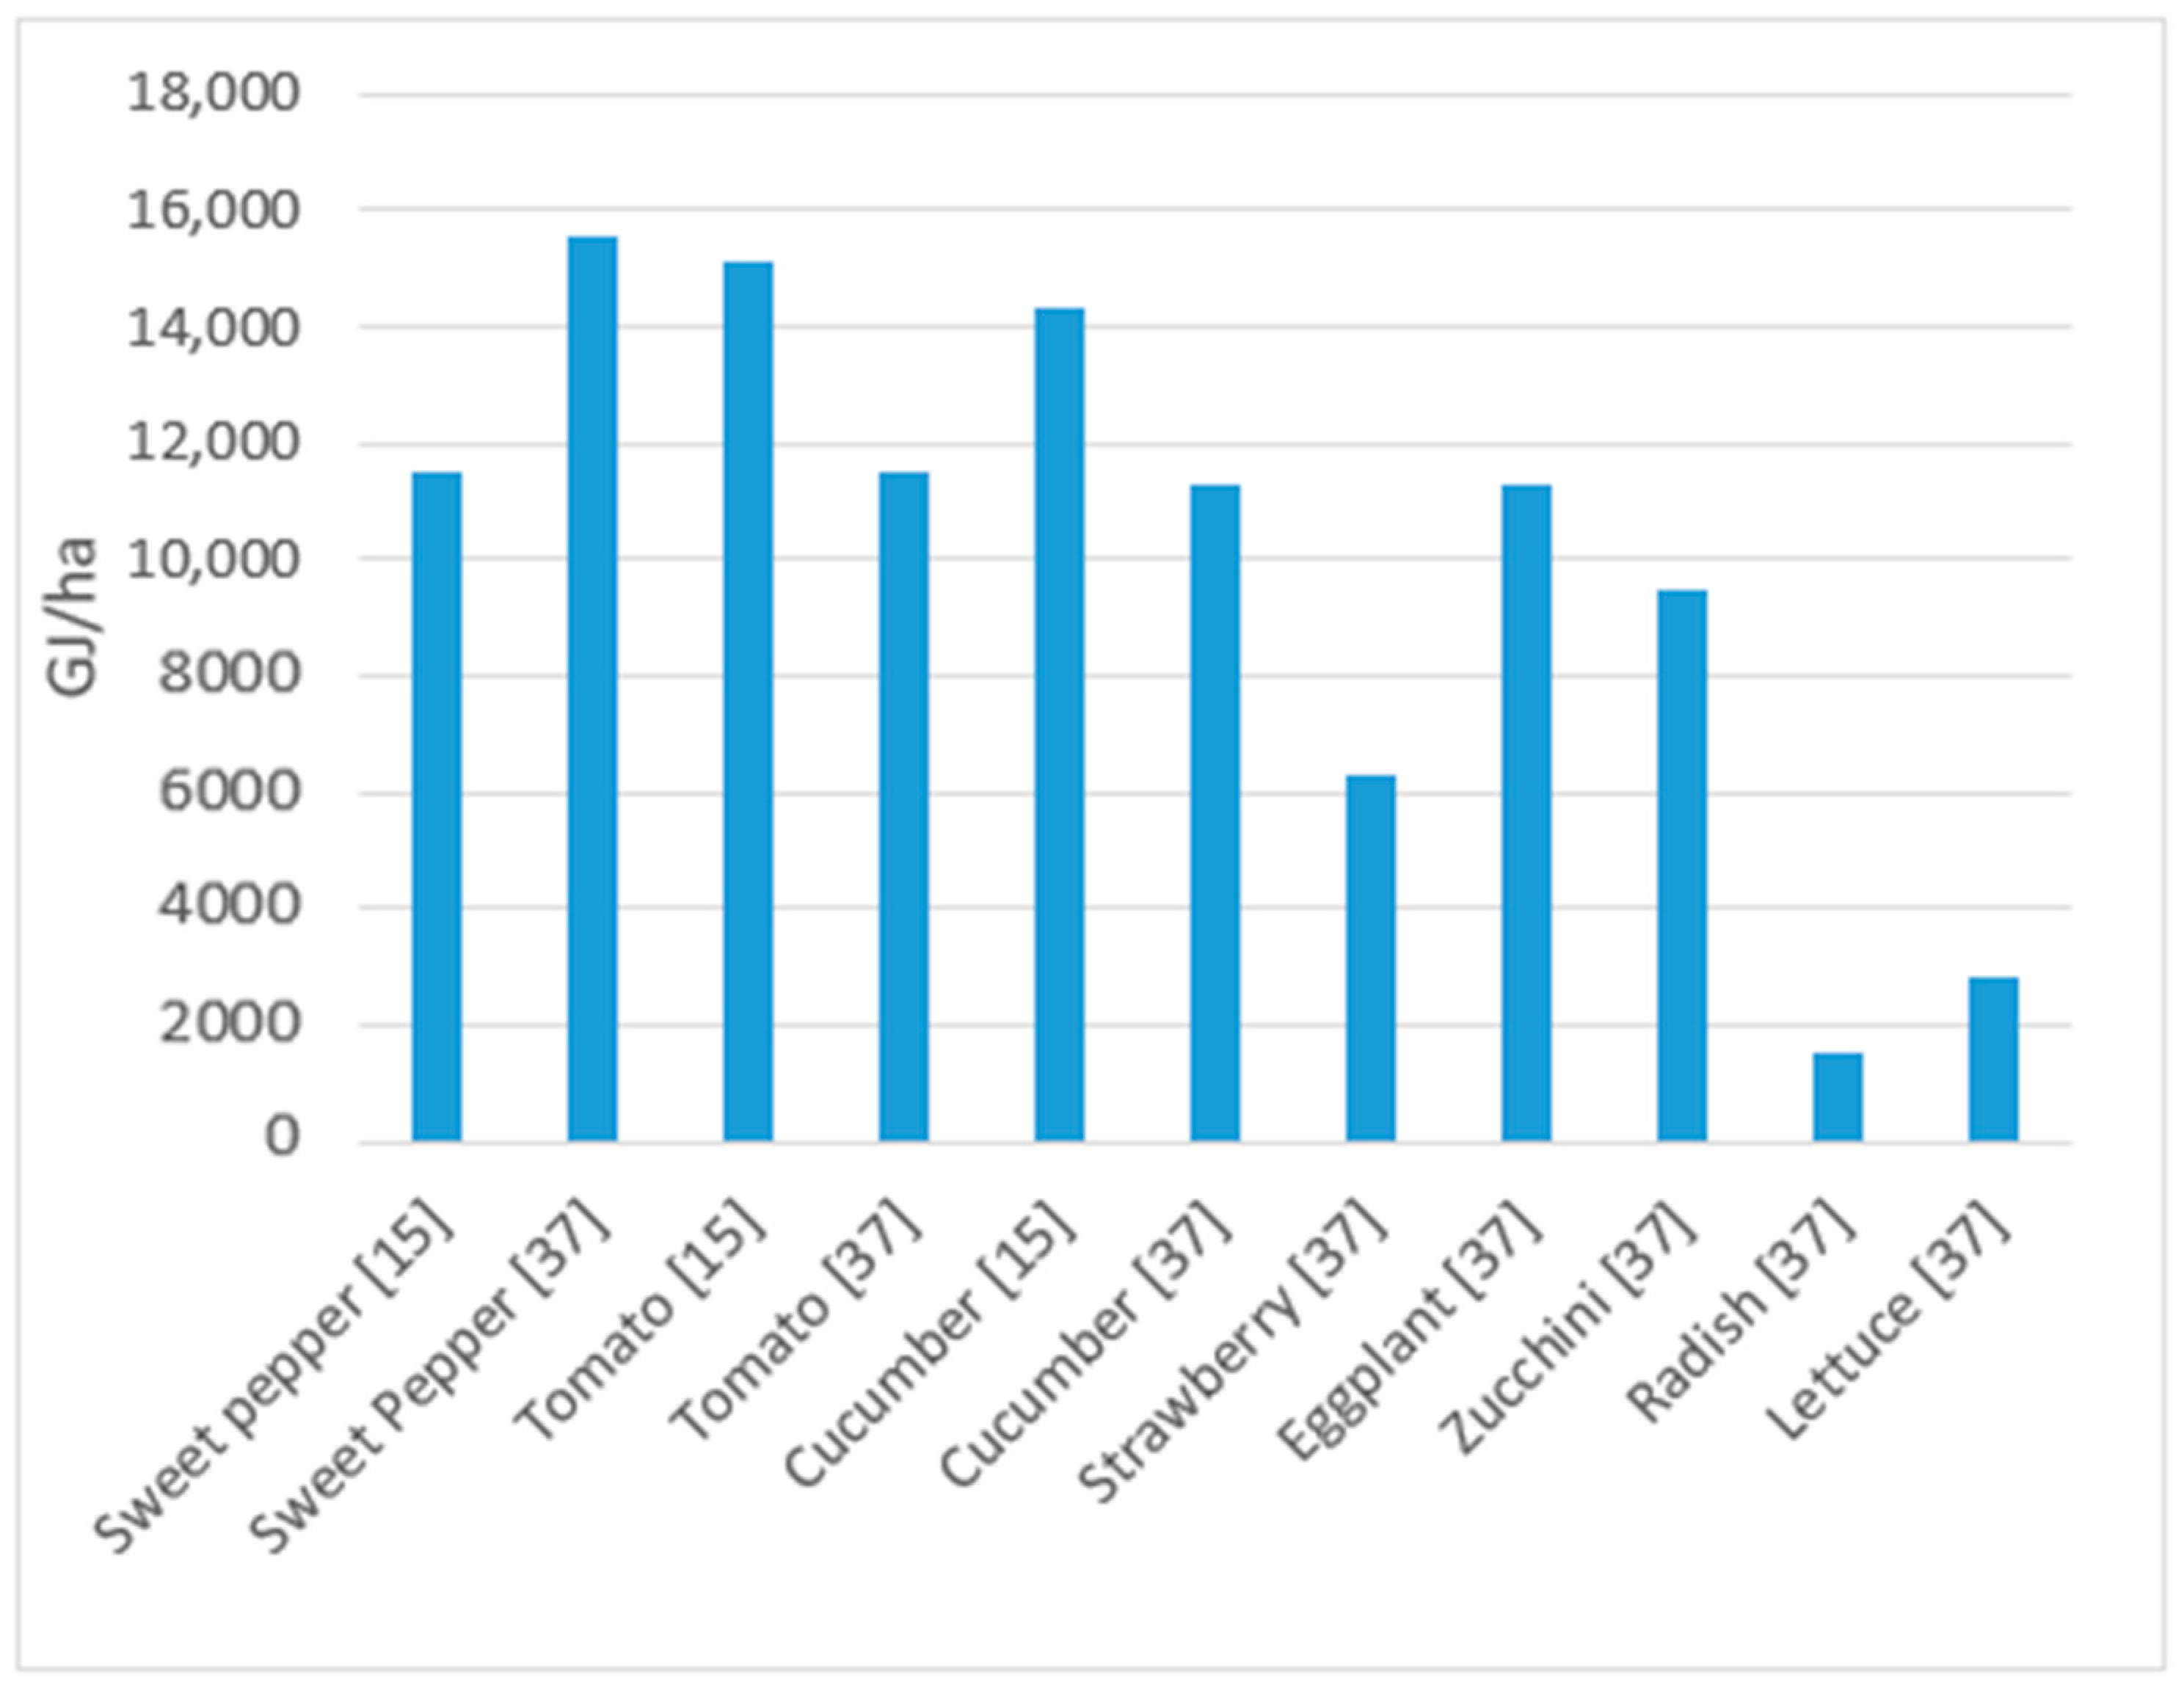
3.6. Germany
Data on greenhouse production in Germany is relatively scarce. Voss (2011) suggest that only 3689 hectares are covered by greenhouses, of which an estimated 80% are glass greenhouses, 15% foil, and 5% stiff plastics, while 2500 hectares are heated [36]. The main crops cultivated in the German greenhouses are tomato, cucumber, certain plants and other crops. It is important to note that most of the facilities are relatively old; 43.1% of the total number of greenhouses, which corresponds to almost 1600 ha, were built before 1982. Even though some of these facilities were upgraded to comply with the modern-day standards, most of them are still outdated and only 10.6% of the total facilities were built after 2000. Furthermore, most of the production area under glass which is specialized for vegetable crops is owned by “small” farmers. Regarding holding size, 3800 facilities are 1000 m2, almost 5600 facilities cover between 1000 m2 and 5000 m2 and the remainder of facilities are larger than 5000 m2 [36]. For Germany, Visser et al. (2012) investigates the energy consumption in greenhouses for tomato and cucumber production. The biggest share of the energy inputs is attributed to heating purposes, whereas a small portion of the energy inputs account for fertilizers (Figure 7). The available data suggest that close to 13,000 GJ/ha are consumed in the greenhouse cultivation of both crops, of which 99.6% accounts for heating purposes. According to Kuntosch et al. (2020), black coal is the largest source of energy for heating purposes followed by natural gas and renewables (Figure 8 and Table A7) [37].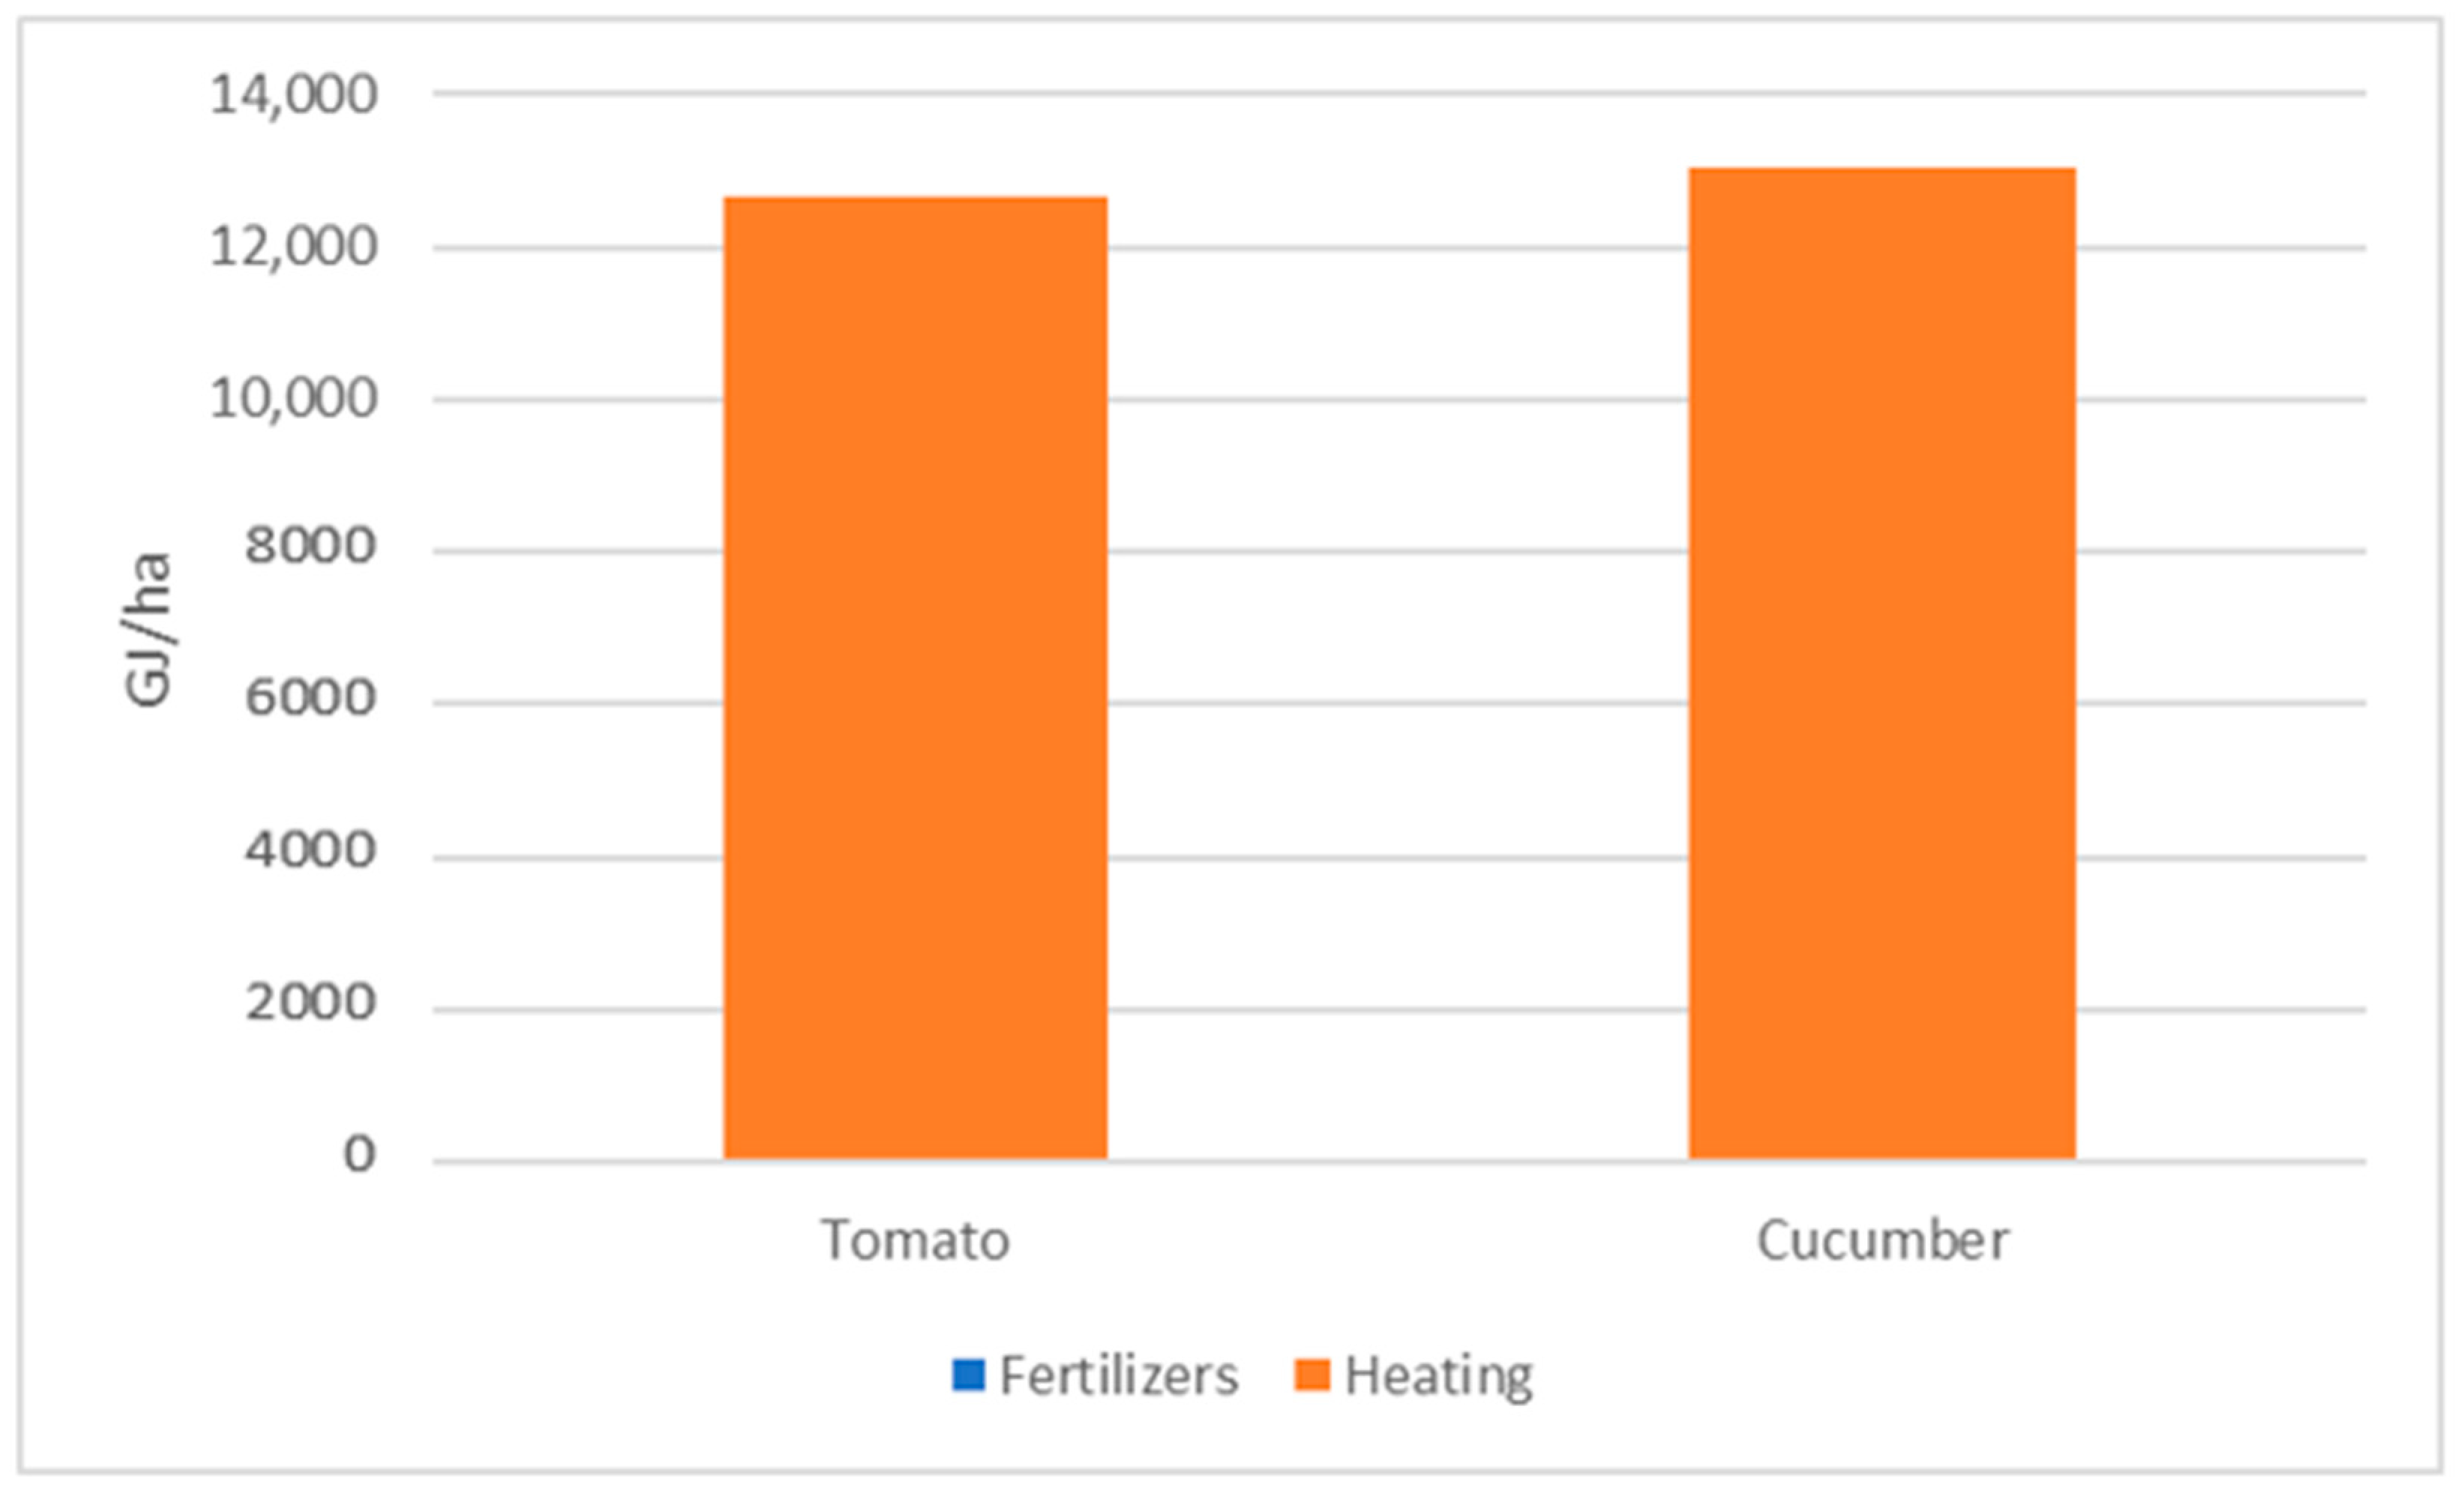
Figure 7. Energy consumption in the German greenhouse sector (GJ/ha) (based on [15]).
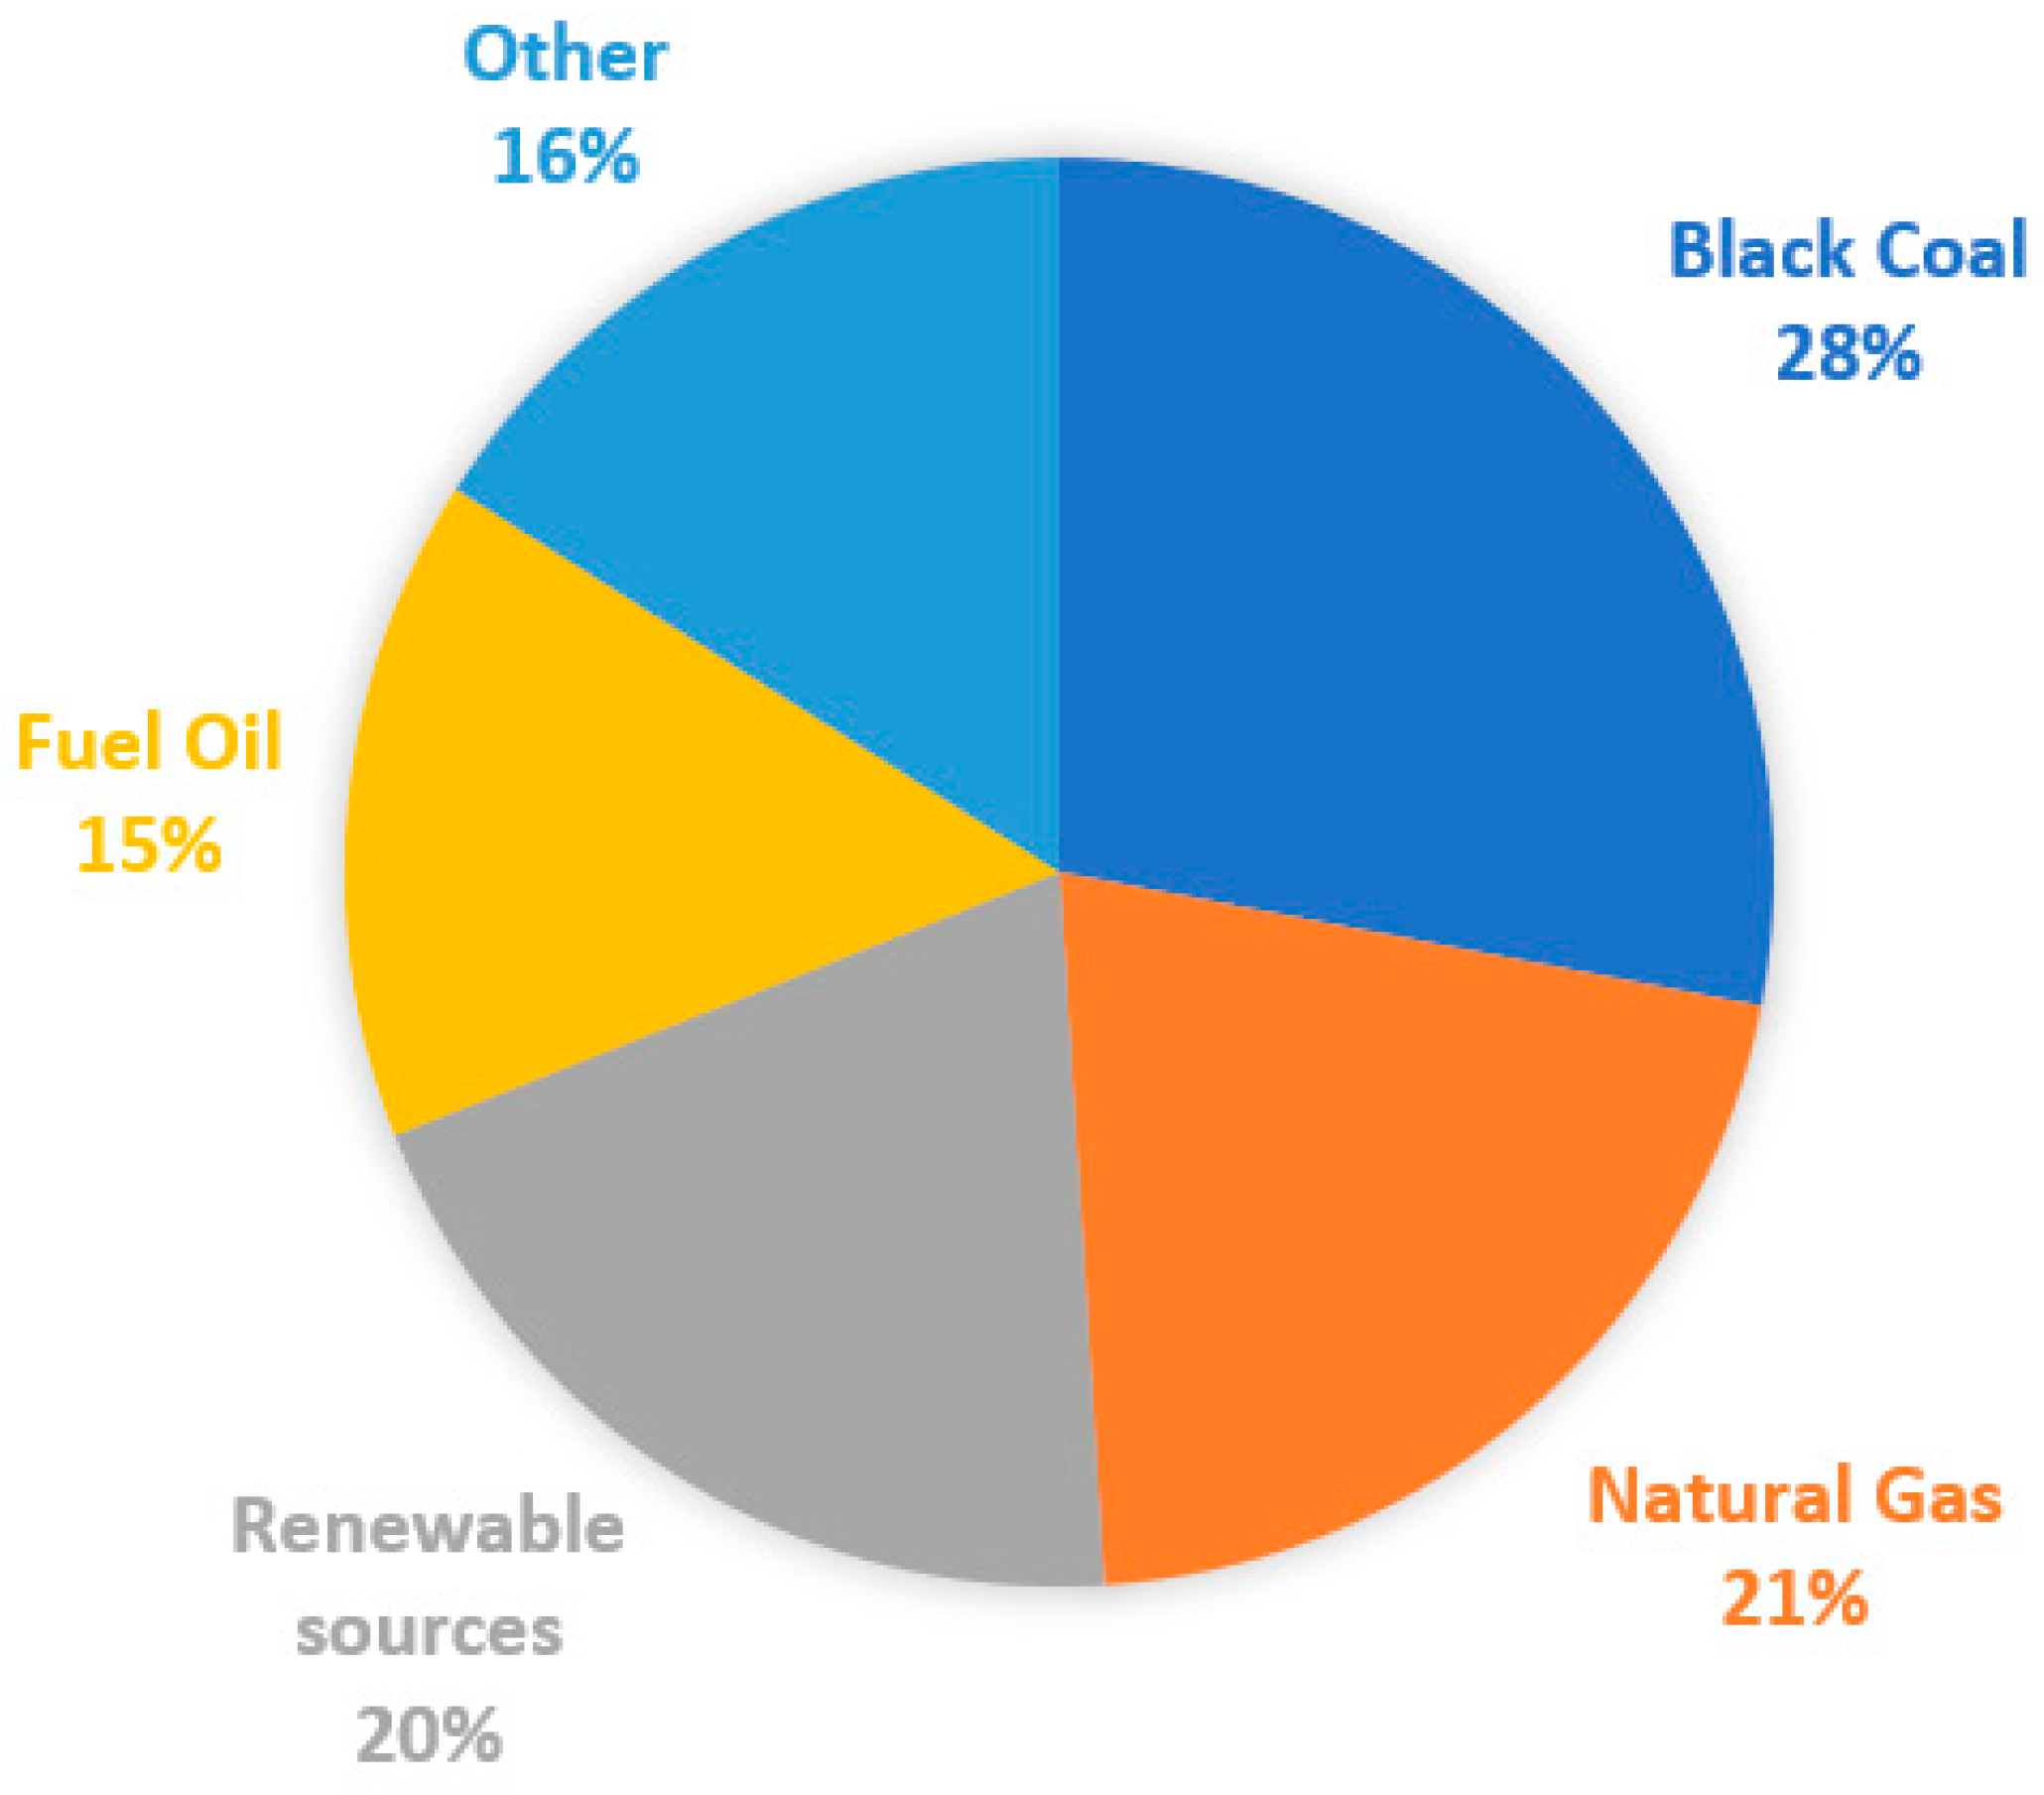
Figure 8. Percentages of the energy sources used for greenhouse heating in Germany (based on [37]).
3.7. Tomatoes
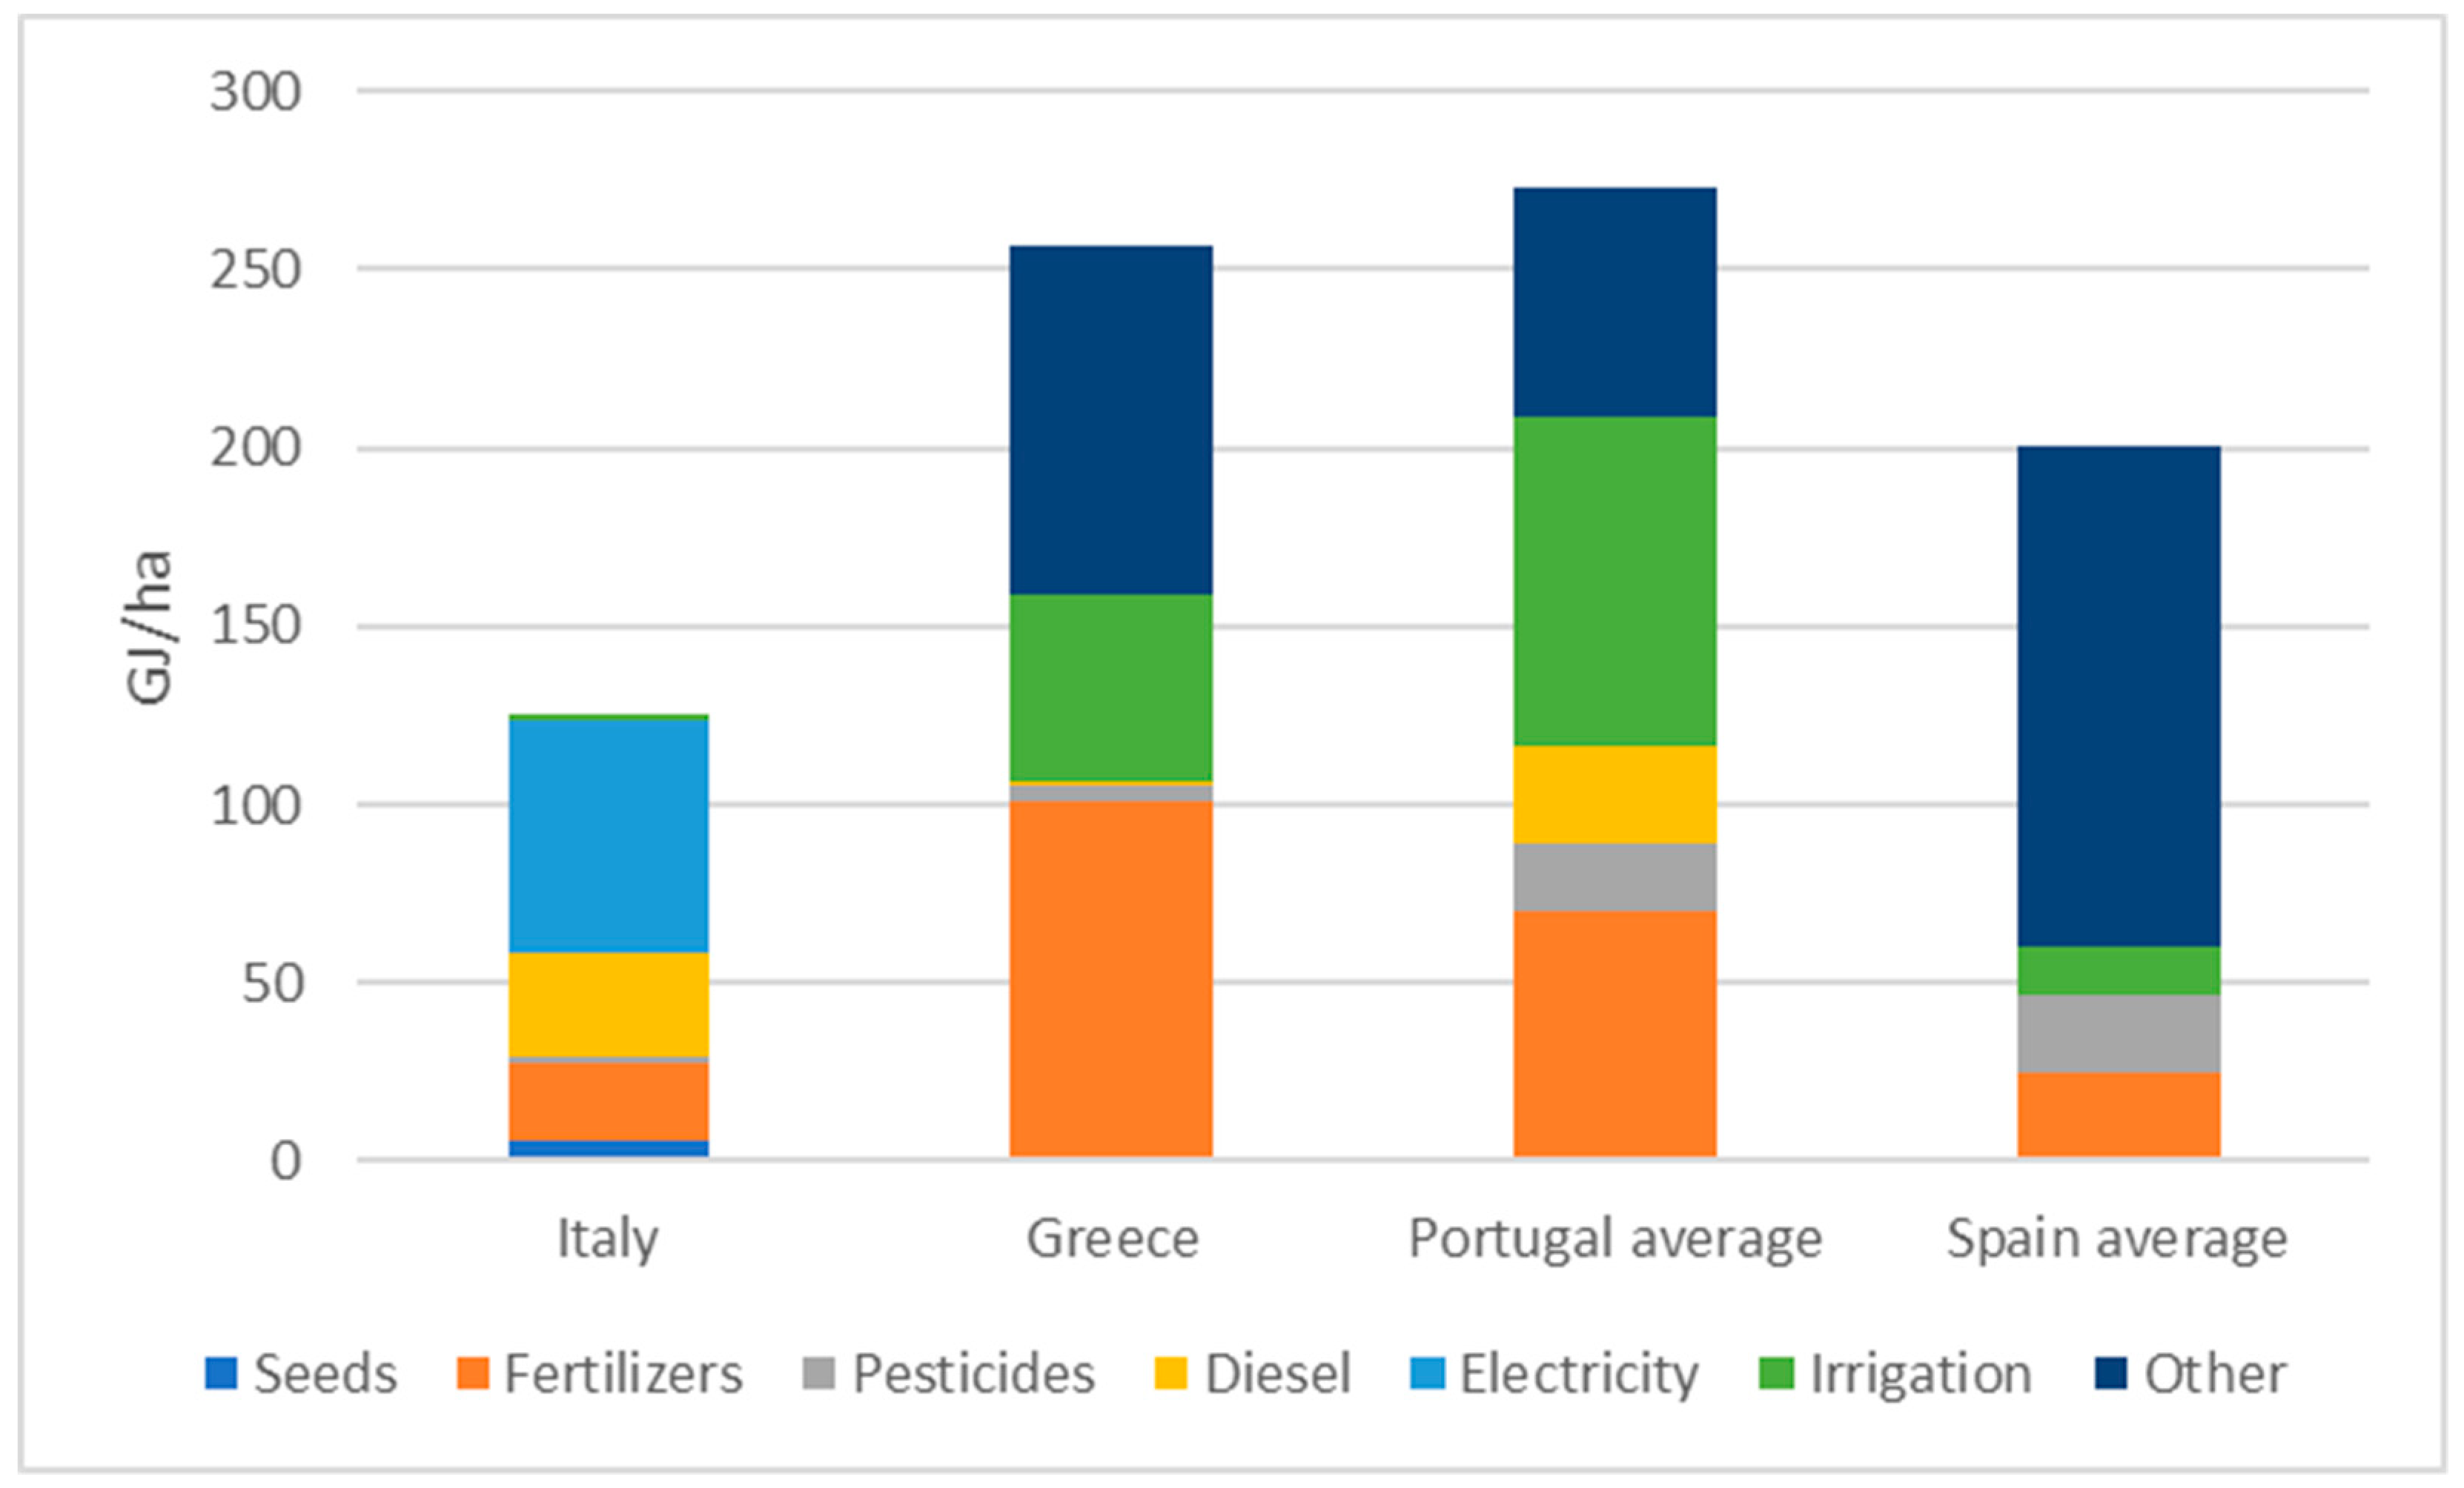
Figure 9 and Figure 10 provide an overview of the energy data of high and low energy intensity greenhouse tomato production. They are presented according to country and in cases where multiple data points are available for one country simple averages were calculated (Table A8 and Table A9). These data show some variations within categories, with energy inputs for high energy systems ranging from around 8000 GJ/ha in Greece to around 15,000 GJ/ha in the Netherlands. In the high energy intensity systems, the vast majority of energy inputs are associated with heating and cooling activities, while in the low energy intensity systems fertilizers are the largest energy inputs. Importantly, this illustrates that energy inputs in high energy intensive tomato production systems are around 50 times greater per hectare than in low energy intensive systems. This energy intensity translates into large differences in final yield, for instance, in the Netherlands the average tomato yield is around 50 kg/m2 while in southern Italy it is 7.6 kg/m2 [18].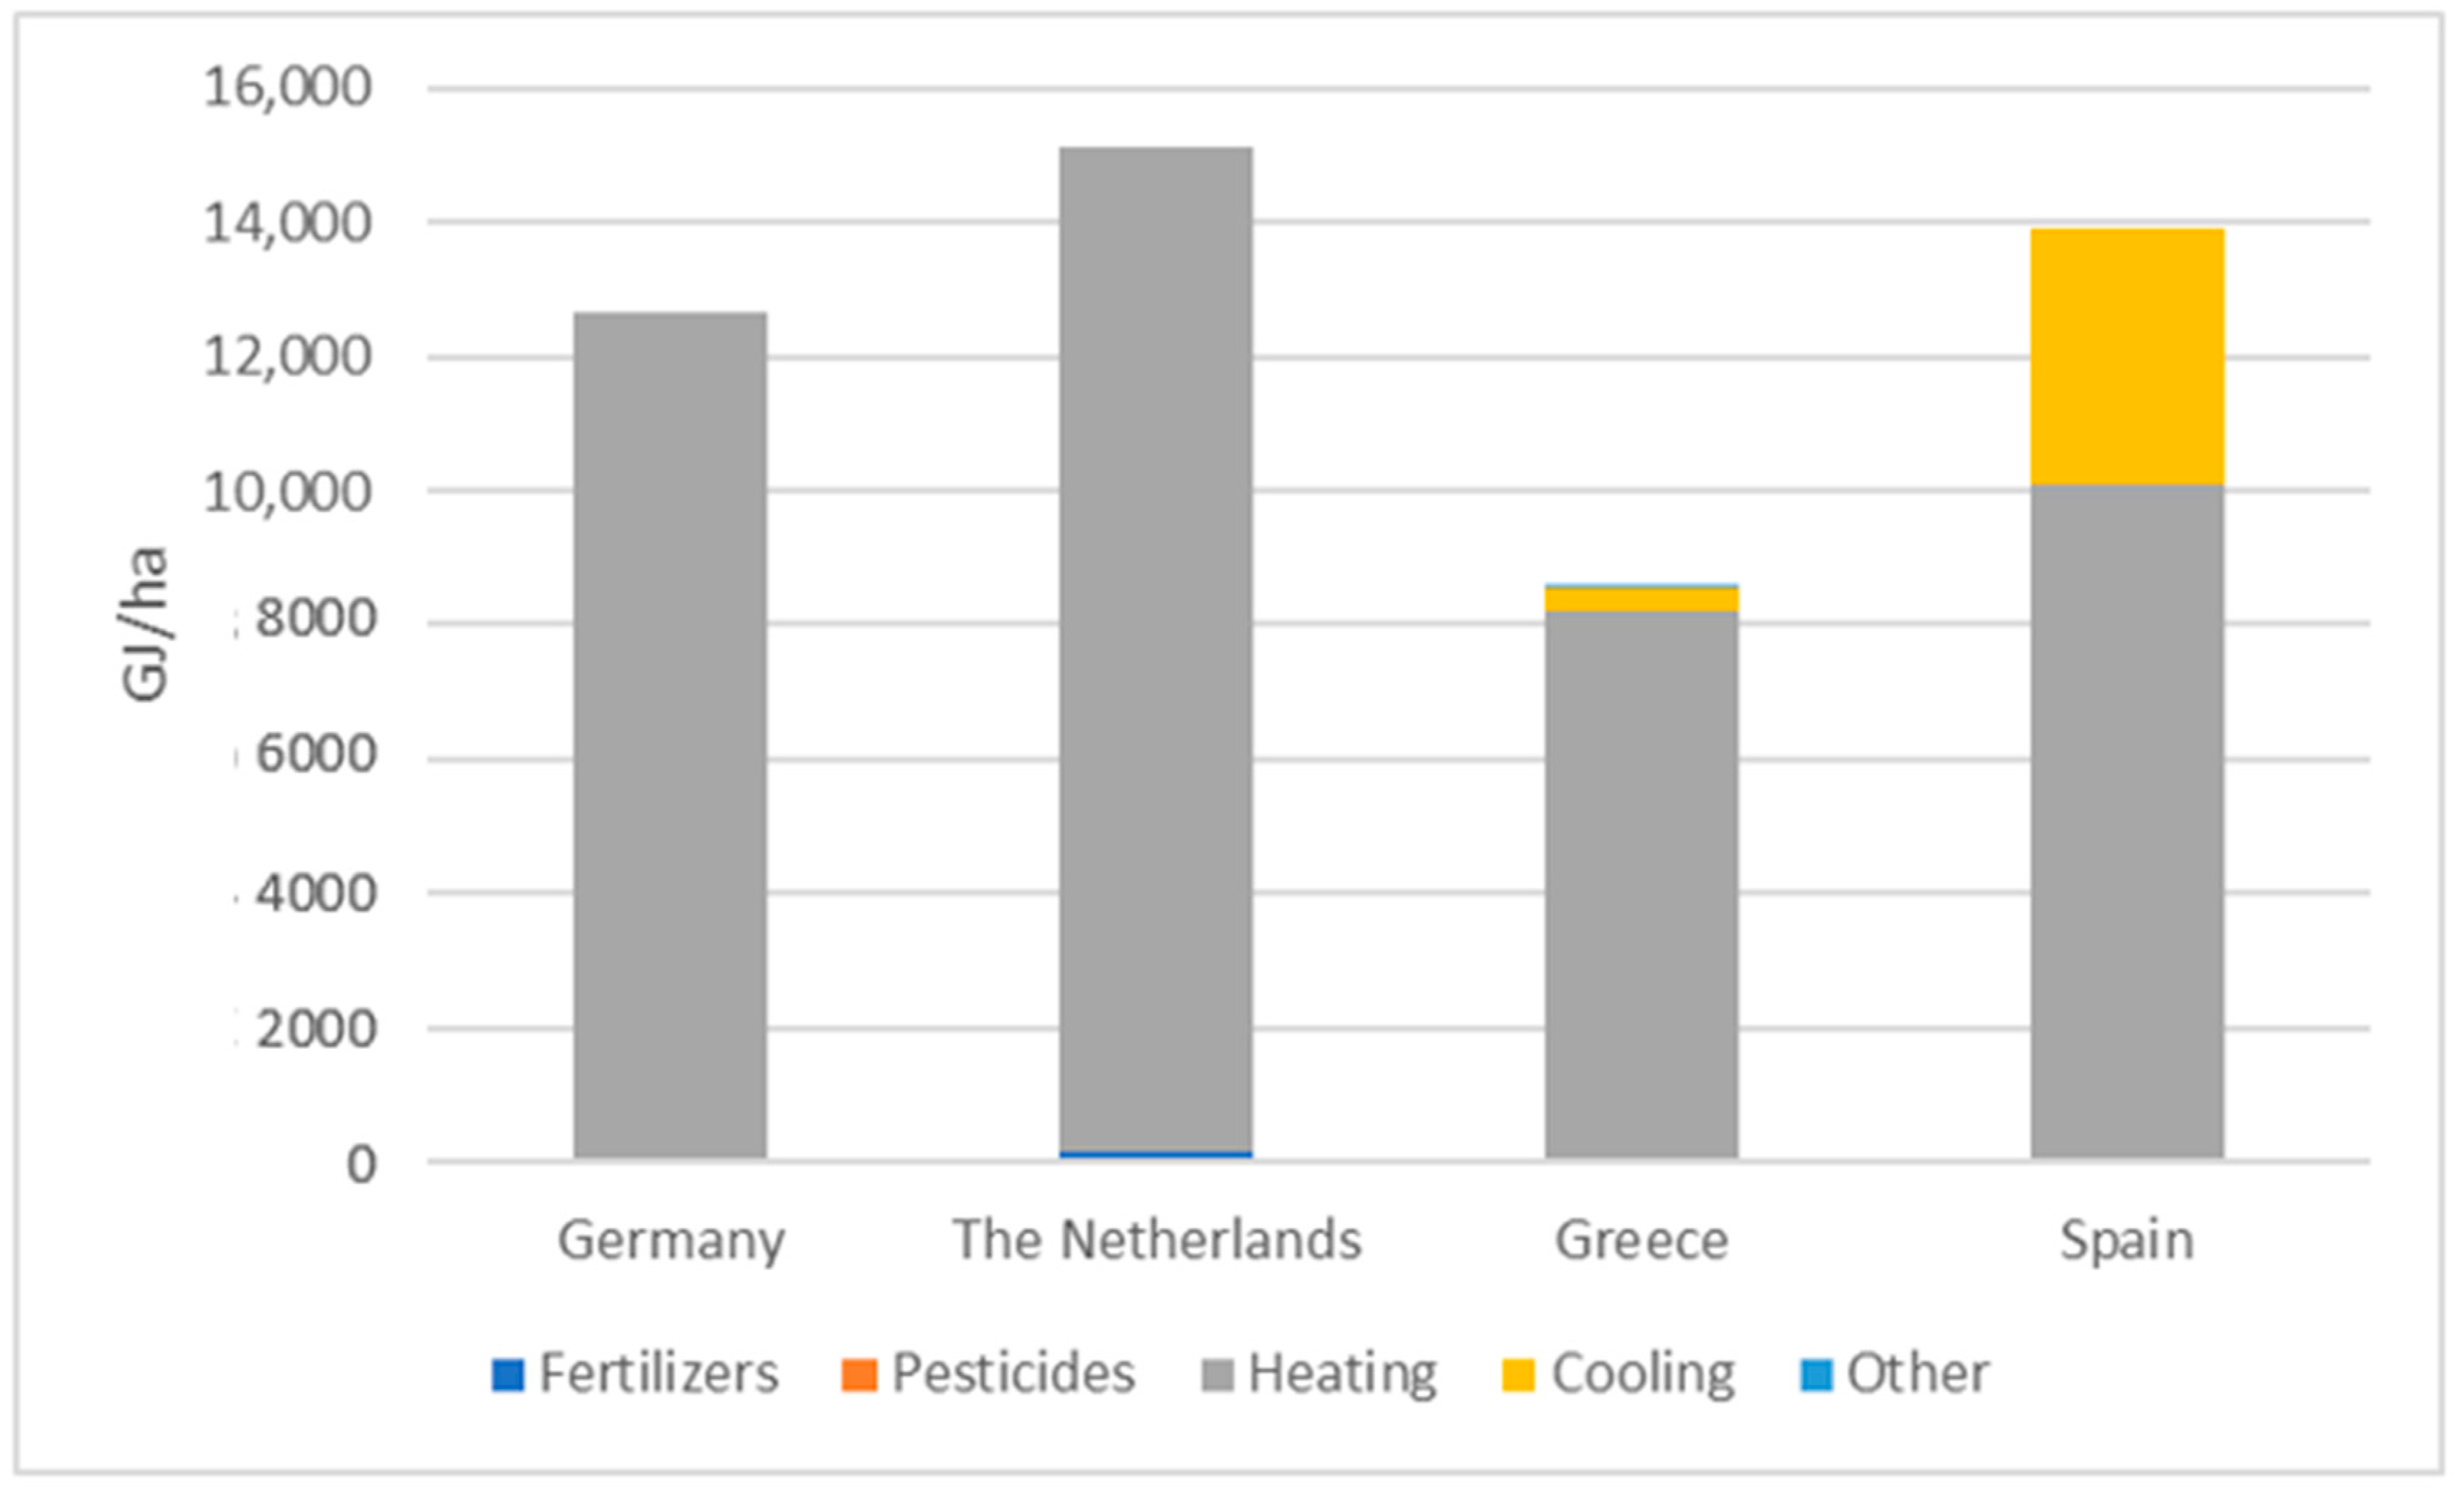
References
- Popsimonova, G.; Benko, B.; Karic, L.; Gruda, N. Production systems in southeastern European greenhouses. Acta Hortic. 2017, 137–144.
- Baudoin, W.; Nersisyan, A.; Shamilov, A.; Hodder, A.; Gutierrez, D.; Nicola, S.; Chairperson, V.; Duffy, R. Good Agricultural Practices for Greenhouse Vegetable Production in the South East European Countries Food and Agriculture Organization of the United Nations Plant Production and Protection Division Principles for Sustainable Intensification of Smallholder Farms; FAO: Rome, Italy, 2017; ISBN 978-92-5-109622-2.
- Eurostat Area under Glass by NUTS 2 Regions. Available online: http://appsso.eurostat.ec.europa.eu/nui/show.do?dataset=ef_lus_unglass&lang=en (accessed on 14 December 2021).
- Tittarelli, F. Organic Greenhouse Production: Towards an Agroecological Approach in the Framework of the New European Regulation—A Review. Agronomy 2020, 10, 72.
- EGTOP. Final Report On Greenhouse Production (Protected Cropping); EGTOP: Brussels, Belgium, 2013.
- Paris, B.; Vandorou, F.; Balafoutis, A.T.; Vaiopoulos, K.; Kyriakarakos, G.; Manolakos, D.; Papadakis, G. Energy use in open-field agriculture in the EU: A critical review recommending energy efficiency measures and renewable energy sources adoption. Renew. Sustain. Energy Rev. 2022, 158, 112098.
- Campiotti, C.; Viola, C.; Alonzo, G.; Bibbiani, C.; Giagnacovo, G.; Scoccianti, M.; Tumminelli, G. Sustainable greenhouse horticulture in europe. J. Sustain. Energy 2012, 3, 159–163.
- Mohamed, E.; Markou, G.; Balafoutis, T.; Papadakis, G.; Michael, P.; Janssen, R. The Cyprus Energy Profile for the Greenhouses Sector: Current Situation and Energy Saving Measures in Combination with RES; European Commission: Brussels, Belgium, 2017.
- Van der Velden, N.; Smit, P. Energiemonitor van de Nederlandse glastuinbouw 2018; Wageningen Economic Research: Wageningen, The Netherlands, 2019.
- Nikolaou, G.; Neocleous, D.; Christou, A.; Polycarpou, P.; Kitta, E.; Katsoulas, N. Energy and Water Related Parameters in Tomato and Cucumber Greenhouse Crops in Semiarid Mediterranean Regions. A Review, Part I: Increasing Energy Efficiency. Horticulturae 2021, 7, 521.
- Eurostat. Agri-Environmental Indicator—Energy Use. Available online: https://ec.europa.eu/eurostat/statistics-explained/index.php?title=Agri-environmental_indicator_-_energy_use&oldid=322997#Analysis_at_EU_and_country_level (accessed on 20 March 2021).
- Von Elsner, B.; Briassoulis, D.; Waaijenberg, D.; Mistriotis, A.; Von Zabeltitz, C.; Gratraud, J.; Russo, G.; Suay-Cortes, R. Review of structural and functional characteristics of greenhouses in European Union countries: Part I, design requirements. J. Agric. Eng. Res. 2000, 75, 1–16.
- Aznar-Sánchez, J.A.; Velasco-Muñoz, J.F.; López-Felices, B.; Román-Sánchez, I.M. An Analysis of Global Research Trends on Greenhouse Technology: Towards a Sustainable Agriculture. Int. J. Environ. Res. Public Health 2020, 17, 664.
- D’Arpa, S.; Colangelo, G.; Starace, G.; Petrosillo, I.; Bruno, D.E.; Uricchio, V.; Zurlini, G. Heating requirements in greenhouse farming in southern Italy: Evaluation of ground-source heat pump utilization compared to traditional heating systems. Energy Effic. 2016, 9, 1065–1085.
- De Visser, C.; de Buisonje, F.; Ellen, H.; Stanghellini, C.; van der Voort, M. State of the Art on Energy Efficiency in Agriculture, Country Data on Energy Consumption in Different Agroproduction Sectors in the European Countries; agrEE: Wageningen, The Netherlands, 2012.
- Anifantis, A.S.; Pascuzzi, S.; Scarascia-Mugnozza, G. Geothermal source heat pump performance for a greenhouse heating system: An experimental study. J. Agric. Eng. 2016, 47, 164–170.
- Fabrizio, E. Energy reduction measures in agricultural greenhouses heating: Envelope, systems and solar energy collection. Energy Build. 2012, 53, 57–63.
- Palmitessa, O.D.; Paciello, P.; Santamaria, P. Supplemental LED increases tomato yield in mediterranean semi-closed greenhouse. Agronomy 2020, 10, 1353.
- Eurostat Crops under Glass: Number of Farms and Areas by Agricultural Size of Farm (UAA) and Size of Crops under Glass Area. Available online: http://appsso.eurostat.ec.europa.eu/nui/show.do?dataset=ef_poglass&lang=en (accessed on 29 April 2022).
- Bibbiani, C.; Fantozzi, F.; Gargari, C.; Campiotti, C.A.; Schettini, E.; Vox, G. Wood Biomass as Sustainable Energy for Greenhouses Heating in Italy. Agric. Agric. Sci. Procedia 2016, 8, 637–645.
- Valera, D.L.; Belmonte, L.J.; Molina-Aiz, F.D.; López, A.; Camacho, F. The greenhouses of Almería, Spain: Technological analysis and profitability. In Proceedings of the Acta Horticulturae; International Society for Horticultural Science: Leuven, Belgium, 2017; Volume 1170, pp. 219–226.
- Aguilar, M.; Vallario, A.; Aguilar, F.; Lorca, A.; Parente, C. Object-Based Greenhouse Horticultural Crop Identification from Multi-Temporal Satellite Imagery: A Case Study in Almeria, Spain. Remote Sens. 2015, 7, 7378–7401.
- Baptista, F.J.; Silva, A.T.; Navas, L.M.; Guimarães, A.C.; Meneses, J.F. Greenhouse energy consumption for tomato production in the Iberian Peninsula countries. In Proceedings of the Acta Horticulturae; International Society for Horticultural Science: Leuven, Belgium, 2012; Volume 952, pp. 409–416.
- Alonso, A.M.; Guzmán, G.J. Comparison of the Efficiency and Use of Energy in Organic and Conventional Farming in Spanish Agricultural Systems. J. Sustain. Agric. 2010, 34, 312–338.
- Savvas, D.; Ropokis, A.; Ntatsi, G.; Kittas, C. Current situation of greenhouse vegetable production in Greece. Acta Hortic. 2016, 1142, 443–448.
- Kittas, C.; Elvanidi, A.; Katsoulas, N.; Ferentinos, K.P.; Bartzanas, T. Reflectance indices for the detection of water stress in greenhouse tomato (Solanum lycopersicum). In Proceedings of the Acta Horticulturae; International Society for Horticultural Science: Leuven, Belgium, 2016; Volume 1112, pp. 63–70.
- Trypanagnostopoulos, G.; Kavga, A.; Souliotis, M.; Tripanagnostopoulos, Y. Greenhouse performance results for roof installed photovoltaics. Renew. Energy 2017, 111, 724–731.
- Vourdoubas, J. Overview of Heating Greenhouses with Renewable Energy Sources a Case Study in Crete-Greece. J. Agric. Environ. Sci. 2015, 4, 2334–2412.
- Pardossi, A.; Tognoni, F. Greenhouse industry in Italy. Acta Hortic. 1999, 481, 769–770.
- Carlini, M.; Honorati, T.; Castellucci, S. Photovoltaic greenhouses: Comparison of optical and thermal behaviour for energy savings. Math. Probl. Eng. 2012, 2012, 743764.
- Campiotti, C.A.; Latini, A.; Scoccianti, M.; Viola, C. Certificati Bianchi Guida Operativa per la Scheda 40E; ENEA: Rome, Italy, 2014.
- Campiglia, E.; Colla, G.; Mancinelli, R.; Rouphael, Y.; Marucci, A. Energy balance of intensive vegetable cropping systems in central Italy. In Proceedings of the Acta Horticulturae; International Society for Horticultural Science: Leuven, Belgium, 2007; Volume 747, pp. 185–191.
- FAOSTAT. FAOSTAT Crops. Available online: http://www.fao.org/faostat/en/#data/QC/ (accessed on 17 March 2021).
- Lambregts, E.; Bakker, R.; Van Hoof, V. Intensive Horticulture in the Netherlands and Europe; Berenschot Groep B.V.: Utrecht, The Netherlands, 2019.
- Stanghellini, C.; Baptista, F.; Eriksson, E.; Gilli, C.; Giuffrida, F.; Kempkes, F.; Muñoz, P.; Stepowska, A.; Ignacio Montero, J.; Arkestijn, P.; et al. Sensible use of primary energy in organic greenhouse production. BioGreenhouse COST Action 2016, 1105, 1–54.
- Voss, J. Market Special: Greenhouse Farming in Germany; EVD International: Hague, The Netherlands, 2011.
- Kuntosch, A.; König, B.; Bokelmann, W.; Doernberg, A.; Siebert, R.; Schwerdtner, W.; Busse, M. Identifying system-related barriers for the development and implementation of eco-innovation in the german horticultural sector. Horticulturae 2020, 6, 33.
- Kittas, C.; Katsoulas, N.; Bartzanas, T.; Bakker, J.C. Greenhouse Climate Control and Energy Use; FAO: Rome, Italy, 2013; pp. 63–95.
More