Oncolytic virotherapy is a promising antitumor therapeutic strategy. It is based on the ability of viruses to selectively kill cancer cells and induce host antitumor immune responses. However, the clinical outcomes of oncolytic viruses (OVs) vary widely. Therefore, we performed a meta-analysis to illustrate the efficacy and safety of oncolytic viruses. The Cochrane Library, PubMed, and EMBASE databases were searched for randomized controlled trials (RCTs) published up to January 31, 2020. The data for objective response rate (ORR), overall survival (OS), progression-free survival (PFS), and adverse events (AEs) were independently extracted by two investigators from 11 studies that met the inclusion criteria. In subgroup analyses, the objective response rate benefit was observed in patients treated with oncolytic DNA viruses (odds ratio (OR) = 4.05; 95% confidence interval (CI): 1.96–8.33; p = 0.0002), but not in those treated with oncolytic RNA viruses (OR = 1.00, 95% CI: 0.66–1.52, p = 0.99). Moreover, the intratumoral injection arm yielded a statistically significant improvement (OR = 4.05, 95% CI: 1.96–8.33, p = 0.0002), but no such improvement was observed for the intravenous injection arm (OR = 1.00, 95% CI: 0.66–1.52, p = 0.99). Among the five OVs investigated in RCTs, only talimogene laherparepvec (T-VEC) effectively prolonged the OS of patients (hazard ratio (HR), 0.79; 95% CI: 0.63–0.99; p = 0.04). None of the oncolytic virotherapies improved the PFS (HR = 1.00, 95% CI: 0.85–1.19, p = 0.96). Notably, the pooled rate of severe AEs (grade ≥3) was higher for the oncolytic virotherapy group (39%) compared with the control group (27%) (risk difference (RD), 12%; risk ratio (RR), 1.44; 95% CI: 1.17–1.78; p = 0.0006). This review offers a reference for fundamental research and clinical treatment of oncolytic viruses. Further randomized controlled trials are needed to verify these results.溶瘤病毒疗法是一种有前途的抗肿瘤治疗策略。它基于病毒选择性杀死癌细胞并诱导宿主抗肿瘤免疫反应的能力。但是,溶瘤病毒(OVs)的临床结果差异很大。因此,我们进行了荟萃分析以说明溶瘤病毒的功效和安全性。搜索Cochrane库,PubMed和EMBASE数据库,以查找截至2020年1月31日发布的随机对照试验(RCT)。这些数据包括客观缓解率(ORR),总生存期(OS),无进展生存期(PFS),两名研究者从符合纳入标准的11项研究中独立提取了不良反应和不良事件(AE)。在亚组分析中,在溶瘤DNA病毒治疗的患者中观察到客观缓解率获益(优势比(OR)= 4.05;95%置信区间(CI):1.96-8.33;p = 0.0002),但溶瘤性RNA病毒治疗者则不然(OR = 1.00,95%CI:0.66-1.52,p = 0.99)。此外,瘤内注射组产生了统计学上的显着改善(OR = 4.05,95%CI:1.96–8.33,p = 0.0002),但对于静脉注射组没有观察到这种改善(OR = 1.00,95%CI:0.66 –1.52,p = 0.99)。在RCT中调查的五个OV中,只有talimogene laherparepvec(T-VEC)有效延长了患者的OS(危险比(HR)为0.79; 95%CI:0.63-0.99; p = 0.04)。没有一种溶瘤病毒疗法改善了PFS(HR = 1.00,95%CI:0.85-1.19,p = 0.96)。值得注意的是,溶瘤病毒治疗组(39%)的严重不良事件(≥3级)的合并率高于对照组(27%)(风险差异(RD)为12%;风险比(RR)为1.44) ; 95%CI:1.17-1.88;p = 0.0006)。
- oncolytic viruses
- oncolytic virotherapy
- efficacy
- adverse events
- systematic review
- meta-analysis
1. Introduction
- 介绍
Cancer is a common disease globally that seriously affects human health. The USA, for instance, projects to have 1,806,590 and 606,520 new cancer cases and cancer deaths, respectively, in 2020 [1]. Although traditional treatment methods such as radiotherapy, chemotherapy, and targeted drugs are preferred in cancer treatment, their disadvantages include severe adverse events, development of drug resistance, and cross-resistance [2][3]. Therefore, the development of more effective cancer treatment strategies is urgently needed. Oncolytic viruses (OVs) are natural or artificially modified viruses that selectively replicate in and destroy cancer cells; hence, they represent a promising approach for antitumor therapy [4][5]. Oncolytic viruses generally exert antitumor effects by two mechanisms, namely, the selective killing of tumor cells, and induction of antitumor immunity [6]. To achieve specificity for tumor cells, key proteins required by OVs to infect the host are first modified to reduce infection of normal tissues [7][8]. Besides, oncolytic viruses utilize signaling pathways such as p53, epidermal growth factor receptor (EGFR)/Ras, and protein kinase R (PKR) to target tumor cells for selective expansion [9][10][11][12]. OVs can also kill tumor cells by triggering the expression of the suicide gene [13][14]. The key steps employed by OVs to transform “cold tumors” into “hot tumors” and activate antitumor immune responses include targeted replication, the release of tumor-associated antigens through oncolysis, upregulation of chemokines and danger signals, recruitment of dendritic cells and lymphoid cells, and upregulation of immune checkpoint molecules [15][16][17].癌症是一种严重影响人类健康的全球性常见疾病。例如,美国计划在2020年分别新增1,806,590和606,520例新癌症病例和癌症死亡病例[1]。尽管传统的治疗方法(例如放疗,化学疗法和靶向药物)在癌症治疗中是首选,但它们的缺点包括严重的不良事件,耐药性的产生和交叉耐药性[2,3]。因此,迫切需要开发更有效的癌症治疗策略。溶瘤病毒(OVs)是天然的或人工修饰的病毒,可选择性地复制并破坏癌细胞。因此,它们代表了一种有前途的抗肿瘤治疗方法[4,5]。溶瘤病毒通常通过两种机制发挥抗肿瘤作用,即选择性杀死肿瘤细胞,和诱导抗肿瘤免疫[6]。为了达到对肿瘤细胞的特异性,OVs感染宿主所需的关键蛋白首先经过修饰,以减少正常组织的感染[7-9]。此外,溶瘤病毒利用p53,表皮生长因子受体(EGFR)/ Ras和蛋白激酶R(PKR)等信号通路靶向肿瘤细胞进行选择性扩增[10-13]。OV也可以通过触发自杀基因的表达来杀死肿瘤细胞[14,15]。OVs将“冷肿瘤”转变为“热肿瘤”并激活抗肿瘤免疫反应的关键步骤包括靶向复制,通过溶瘤释放肿瘤相关抗原,趋化因子和危险信号上调,树突状细胞和淋巴样细胞的募集,以及免疫检查点分子的上调[16-18]。为了达到对肿瘤细胞的特异性,OVs感染宿主所需的关键蛋白首先经过修饰,以减少正常组织的感染[7-9]。此外,溶瘤病毒利用p53,表皮生长因子受体(EGFR)/ Ras和蛋白激酶R(PKR)等信号通路靶向肿瘤细胞进行选择性扩增[10-13]。OV还可以通过触发自杀基因的表达来杀死肿瘤细胞[14,15]。OVs将“冷肿瘤”转变为“热肿瘤”并激活抗肿瘤免疫反应的关键步骤包括靶向复制,通过溶瘤释放肿瘤相关抗原,趋化因子和危险信号上调,募集树突状细胞和淋巴样细胞,以及免疫检查点分子的上调[16-18]。为了达到对肿瘤细胞的特异性,OVs感染宿主所需的关键蛋白首先经过修饰,以减少正常组织的感染[7-9]。此外,溶瘤病毒利用p53,表皮生长因子受体(EGFR)/ Ras和蛋白激酶R(PKR)等信号通路靶向肿瘤细胞进行选择性扩增[10-13]。OV也可以通过触发自杀基因的表达来杀死肿瘤细胞[14,15]。OVs将“冷肿瘤”转变为“热肿瘤”并激活抗肿瘤免疫反应的关键步骤包括靶向复制,通过溶瘤释放肿瘤相关抗原,趋化因子和危险信号上调,募集树突状细胞和淋巴样细胞,以及免疫检查点分子的上调[16-18]。OVs感染宿主所需的关键蛋白首先经过修饰,以减少正常组织的感染[7-9]。此外,溶瘤病毒利用p53,表皮生长因子受体(EGFR)/ Ras和蛋白激酶R(PKR)等信号通路靶向肿瘤细胞进行选择性扩增[10-13]。OV还可以通过触发自杀基因的表达来杀死肿瘤细胞[14,15]。OVs将“冷肿瘤”转变为“热肿瘤”并激活抗肿瘤免疫反应的关键步骤包括靶向复制,通过溶瘤释放肿瘤相关抗原,趋化因子和危险信号上调,募集树突状细胞和淋巴样细胞,以及免疫检查点分子的上调[16-18]。OVs感染宿主所需的关键蛋白首先经过修饰,以减少正常组织的感染[7-9]。此外,溶瘤病毒利用p53,表皮生长因子受体(EGFR)/ Ras和蛋白激酶R(PKR)等信号通路靶向肿瘤细胞进行选择性扩增[10-13]。OV还可以通过触发自杀基因的表达来杀死肿瘤细胞[14,15]。OVs将“冷肿瘤”转变为“热肿瘤”并激活抗肿瘤免疫反应的关键步骤包括靶向复制,通过溶瘤释放肿瘤相关抗原,趋化因子和危险信号上调,募集树突状细胞和淋巴样细胞,以及免疫检查点分子的上调[16-18]。溶瘤病毒利用p53,表皮生长因子受体(EGFR)/ Ras和蛋白激酶R(PKR)等信号通路靶向肿瘤细胞进行选择性扩增[10-13]。OV也可以通过触发自杀基因的表达来杀死肿瘤细胞[14,15]。OVs将“冷肿瘤”转变为“热肿瘤”并激活抗肿瘤免疫反应的关键步骤包括靶向复制,通过溶瘤释放肿瘤相关抗原,趋化因子和危险信号上调,树突状细胞和淋巴样细胞的募集,以及免疫检查点分子的上调[16-18]。溶瘤病毒利用p53,表皮生长因子受体(EGFR)/ Ras和蛋白激酶R(PKR)等信号通路靶向肿瘤细胞进行选择性扩增[10-13]。OV也可以通过触发自杀基因的表达来杀死肿瘤细胞[14,15]。OVs将“冷肿瘤”转变为“热肿瘤”并激活抗肿瘤免疫反应的关键步骤包括靶向复制,通过溶瘤释放肿瘤相关抗原,趋化因子和危险信号上调,募集树突状细胞和淋巴样细胞,以及免疫检查点分子的上调[16-18]。OV还可以通过触发自杀基因的表达来杀死肿瘤细胞[14,15]。OVs将“冷肿瘤”转变为“热肿瘤”并激活抗肿瘤免疫反应的关键步骤包括靶向复制,通过溶瘤释放肿瘤相关抗原,趋化因子和危险信号上调,树突状细胞和淋巴样细胞的募集,以及免疫检查点分子的上调[16-18]。OV也可以通过触发自杀基因的表达来杀死肿瘤细胞[14,15]。OVs将“冷肿瘤”转变为“热肿瘤”并激活抗肿瘤免疫反应的关键步骤包括靶向复制,通过溶瘤释放肿瘤相关抗原,趋化因子和危险信号上调,募集树突状细胞和淋巴样细胞,以及免疫检查点分子的上调[16-18]。
Oncolytic viruses are either RNA or DNA viruses. RNA viruses such as reoviruses, paramyxoviruses, and picornaviruses, which encode only a few genes, often undergo rapid proliferation and lysis of tumor cells [5][17][18][19]. On the other hand, oncolytic DNA viruses such as herpes viruses, adenovirus, or poxviruses allow for the insertion of multiple foreign genes but are slower in replication and amplification [5][20][21]. The structure, gene components, expression strategies, and antineoplastic mechanisms are therefore different between the two types [22]. Talimogene laherparepvec (T-VEC), which is an oncolytic herpes virus type I, is presently the only oncolytic virus approved by the Food and Drug Administration. The success of T-VEC in the treatment of melanoma has further promoted the research of oncolytic viruses. With the increased number of clinical studies on oncolytic viruses, the efficacy and safety of oncolytic viruses have drawn much attention. Clinical trials of oncolytic viruses in combination with chemotherapeutic drugs, radiotherapy, and immune checkpoint inhibitors have shown massive progress in cancer treatment [5][15][23]. In particular, the combination of oncolytic virus and immune checkpoint inhibitors has yielded good results in melanoma [24]. Although many oncolytic viruses exist, a real champion among the oncolytic viruses has not yet emerged. In addition, no systematic review has been conducted on the efficacy and safety of oncolytic viruses in randomized controlled trials.溶瘤病毒是RNA或DNA病毒。RNA病毒,如呼肠孤病毒,副粘病毒和小核糖核酸病毒,仅编码少数几个基因,它们通常会迅速增殖并裂解肿瘤细胞[5,18-20]。另一方面,溶瘤性DNA病毒(例如疱疹病毒,腺病毒或痘病毒)允许插入多个外源基因,但复制和扩增速度较慢[5,21,22]。因此,两种类型的结构,基因成分,表达策略和抗肿瘤机制是不同的[23]。Talimogene laherparepvec(T-VEC)是一种溶瘤性疱疹病毒,目前是美国食品药物管理局批准的唯一溶瘤病毒。T-VEC在黑色素瘤治疗中的成功进一步促进了溶瘤病毒的研究。随着溶瘤病毒临床研究的增加,溶瘤病毒的有效性和安全性引起了人们的广泛关注。溶瘤病毒与化学治疗药物,放疗和免疫检查点抑制剂联合使用的临床试验显示,癌症治疗取得了巨大进展[5,16,24]。特别是,溶瘤病毒和免疫检查点抑制剂的组合已在黑色素瘤中产生了良好的效果[25]。尽管存在许多溶瘤病毒,但溶瘤病毒中真正的拥护者尚未出现。此外,在随机对照试验中,尚未对溶瘤病毒的功效和安全性进行系统评价。溶瘤病毒与化学治疗药物,放疗和免疫检查点抑制剂联合使用的临床试验显示,癌症治疗取得了巨大进展[5,16,24]。特别是,溶瘤病毒和免疫检查点抑制剂的组合已在黑色素瘤中产生了良好的效果[25]。尽管存在许多溶瘤病毒,但溶瘤病毒中真正的拥护者尚未出现。此外,在随机对照试验中,尚未对溶瘤病毒的功效和安全性进行系统评价。溶瘤病毒与化学治疗药物,放疗和免疫检查点抑制剂联合使用的临床试验显示,癌症治疗取得了巨大进展[5,16,24]。特别是,溶瘤病毒和免疫检查点抑制剂的组合已在黑色素瘤中产生了良好的效果[25]。尽管存在许多溶瘤病毒,但溶瘤病毒中真正的拥护者尚未出现。此外,在随机对照试验中,尚未对溶瘤病毒的功效和安全性进行系统评价。溶瘤病毒中真正的冠军尚未出现。此外,在随机对照试验中,尚未对溶瘤病毒的功效和安全性进行系统评价。溶瘤病毒中真正的冠军尚未出现。此外,在随机对照试验中,尚未对溶瘤病毒的功效和安全性进行系统评价。
In this meta-analysis, we included the following viruses: T-VEC (herpes virus) [25][26], pelareorep (reovirus) [27][28][29][30][31][32], NTX-010 (seneca valley virus; picornavirus) [18], Ad5-yCD/mutTKSR39rep-ADP (adenovirus) [33], and pexastimogene devacirepvec (Pexa-Vec; poxvirus) [34]. We first evaluated the efficacy of oncolytic virus from objective response rate (ORR), overall survival (OS), and progression-free survival (PFS); then we analyzed severe adverse events (grade ≥3) and detailed adverse events (AEs). Overall, we conducted this meta-analysis to investigate the effectiveness and safety of oncolytic viruses in randomized controlled trials to provide insights for fundamental research and clinical treatment.在本荟萃分析中,我们包括以下病毒:T-VEC(疱疹病毒)[26,27],pelareorep(呼肠孤病毒)[28-33],NTX-010(塞内卡谷地病毒;小核糖核酸病毒)[19],Ad5 -yCD / mut TK SR39 rep -ADP(腺病毒)[34]和pexastimogene devacirepvec(Pexa-Vec;痘病毒)[35]。我们首先从客观应答率(ORR),总生存期(OS)和无进展生存期(PFS)评估溶瘤病毒的疗效;然后我们分析了严重不良事件(≥3级)和详细不良事件(AE)。
2. Methods
- 讨论区
2.1. Literature Search Strategy
溶瘤病毒具有杀死癌细胞的潜力(溶瘤作用);它们还通过多种机制诱导抗肿瘤免疫反应[42,43]。这些特征使溶瘤病毒疗法成为癌症患者的有希望的免疫治疗方法。但是,临床试验表明,血液中存在中和抗体会阻止溶瘤病毒(呼肠孤病毒除外)复制;免疫系统的激活导致溶瘤病毒的快速消除,并且溶瘤病毒由于物理参数而无法靶向肿瘤[5,44,45]。此外,最佳溶瘤病毒,给药途径,患者的预后以及不良反应仍存在争议。
A systematic search was conducted in EMBASE, PubMed, and Cochrane databases for studies published up to 30/1/2020. The search terms included: “oncolytic viruses”, or “viruses, oncolytic”, or “oncolytic virus”, or “virus, oncolytic”, or “oncolytic virotherapy”, or “oncolytic virotherapies”, or “virotherapies, oncolytic”, or “virotherapy, oncolytic”, or “oncolytic virus therapy”, or “oncolytic virus therapies”, or “therapies, oncolytic virus”, or “therapy, oncolytic virus”, or “virus therapies, oncolytic”, or “virus therapy, oncolytic”. There was a language restriction of English in the search, and we followed the PRISMA guidelines for randomized controlled trials (RCTs) to conduct the meta-analysis [35].在这项研究中,我们提取了客观缓解率(ORR),总生存期(OS)和无进展生存期(PFS)的数据,以深入分析溶瘤病毒疗法的有效性。通常,T-VEC(OR = 4.05,95%CI:1.96–8.33)显示出显着的ORR临床疗效。有趣的是,在溶瘤性DNA病毒治疗的患者(OR = 4.05,95%CI:1.96–8.33)中观察到客观缓解率获益,但在溶瘤性RNA病毒治疗的患者(OR = 1.00,95%CI:0.66-1.52)中观察不到)。这可能是因为DNA病毒携带许多具有重要免疫调节作用的外部基因。另外,DNA病毒表达高保真DNA聚合酶,可维持病毒基因组的完整性和足够的扩增[16,43]。越来越多的证据表明,溶瘤病毒的抗肿瘤作用不仅取决于单纯的溶瘤作用,还取决于病毒诱导的抗肿瘤免疫力[16,46,47]。溶瘤病毒破坏免疫耐受的三个机制包括:(1)在病毒感染肿瘤细胞后,它诱导抗原呈递细胞(APC)渗透到肿瘤感染部位;(2)病毒裂解肿瘤细胞后释放的肿瘤抗原,增强APCs的抗原呈递能力,从而产生针对肿瘤抗原的特异性免疫应答,形成长期的抗肿瘤免疫应答;(3)尽管OVs在肿瘤中复制,但它们也表达免疫调节因子,并共同参与抗肿瘤免疫力的进一步扩增[48,49]。由于RNA病毒通常快速复制且仅具有很少的外源基因[16,23],因此其抗肿瘤作用主要取决于溶瘤作用而不是免疫活化作用。就注射方式而言,癌症患者通过瘤内注射获得了显着的客观缓解率(OR = 4.05,95%CI:1.96–8.33)。由于物理参数和病毒稀释度的原因,静脉注射的靶向性和效果均不理想[5]。尽管肿瘤内注射可以避免上述问题,但也受到肿瘤类型的限制。静脉注射的靶向作用和效果均不理想[5]。尽管肿瘤内注射可以避免上述问题,但也受到肿瘤类型的限制。静脉注射的靶向作用和效果均不理想[5]。尽管肿瘤内注射可以避免上述问题,但也受到肿瘤类型的限制。
2.2. Inclusion and Exclusion Criteria
从生存数据来看,只有T-VEC(HR = 0.79,95%CI:0.63-0.99,p = 0.04)可以有效地延长癌症患者的总生存期。Pelareorep,Pexa-Vec和NTX-010对OS而言没有统计学意义。此外,没有溶瘤病毒影响无进展生存期(PFS)(HR = 1.00,95%CI:0.85-1.19)。在转移性乳腺癌患者中,接受培拉瑞普治疗的实验组中位生存时间(17.4个月)明显比对照组(10.4个月)更长。总体生存的HR为0.65(80%CI:0.46-0.91,p = 0.10)。这表明佩拉瑞普可能是转移性乳腺癌的一种有希望的新药。但是,需要更多的RCT进行验证。
We included studies in the meta-analysis if they met the following inclusion criteria: (1) the studies were randomized controlled trials in cancer patients treated with an oncolytic virus; (2) the articles had at least one of the following outcomes: objective response rate (ORR), overall survival (OS), progression-free survival (PFS), or adverse events (AEs); (3) cancer patients in the control group received the control regimen without oncolytic virus. However, articles were excluded if: (1) they were conference abstracts, case reports, letters, meta-analyses, cohort studies, single-arm studies, reviews, animal studies, or in vitro studies; (2) patients in the control group received oncolytic virotherapy; (3) they included literatures with overlapping patients. Two independent investigators screened the potentially eligible articles by reading the titles and abstracts. Thereafter, the full text of all remaining studies was read to determine if they met the set eligibility criteria. Disagreements on study selection were resolved by discussion with other investigators.溶瘤病毒通常被认为是安全的。但是,溶瘤病毒疗法与该荟萃分析中的特定风险有关。严重不良事件(AE)的合并风险比(RR)和风险差异(RD)为1.44(95%CI:1.17-1.78,p = 0.0006)和0.12(95%CI:0.06-0.18,p= 0.0002),分别表明此类疗法具有不容忽视的风险。发生率高于10%的任何级别的AE包括发烧(48.90%),中性粒细胞减少症(63.01%),发热性中性粒细胞减少症(25.18%),白细胞减少症(71.23%),腹泻(28.78%),恶心(45.24%),呕吐(27.84%),发冷(45.84%),疲劳(55.35%),类似流感的症状(31.29%),食欲/厌食症减少(25.91%),关节痛(19.01%),肌痛(18.42%),极度疼痛( 20.98%),头痛(24.11%),咳嗽(21.66%)和血小板减少症(54.79%)。发生率高于5%的严重AE包括中性粒细胞减少症(40.36%),发热性中性粒细胞减少症(15.52%)白细胞减少症(26.61%),疲劳(6.836%)和血小板减少症(10.09%)。在一项单方面测试中,高等级感冒样症状(1.23%),任何等级的蜂窝组织炎(5.822%)和食欲/厌食症减少的统计学意义(25。观察到91%的任何等级。尚未报告详细的严重不良事件,可能是由于缺乏随访,导致低估了。
2.3. Data Extraction
Two investigators independently read full texts of the included literatures and extracted the data. Any divergence of opinions concerning the extracted data was resolved through consultation. The extracted data included first author, publication, year, country, treatment, injection mode of OVs, types of cancer, the total number of patients, and clinical endpoints. The primary endpoints were ORR, OS, and PFS, while secondary endpoints included adverse events, which were evaluated using the National Cancer Institute—Common Terminology Criteria for Adverse Events (version 3.0 or 4.0). In addition, we carefully read supplementary materials of the included literatures to prevent any loss of information.
2.4. Quality Assessment
Quality assessment was done by two independent investigators using the Cochrane risk of bias tool. The risk of bias parameters included the random sequence generation (selection bias), allocation concealment (selection bias), blinding of participants and personnel (performance bias), blinding of outcome assessment (detection bias), incomplete outcome data (attrition bias), selective reporting (reporting bias), and other bias. Each entry was determined as high-risk, low-risk, or unclear. If an item could not be assessed due to lack of information, it was considered as having an unclear risk of bias. Disagreements on quality assessment were resolved by consensus.
2.5. Statistical Analysis
Statistical analyses were performed using Review Manager (RevMan) 5.3 software and STATA 12.0. Results were presented as hazard ratios (HRs), risk ratios (RRs), or odds ratios (ORs) with 95% CI (confidence interval). Heterogeneity among RCTs was assessed by the Chi-square test and index of heterogeneity (I2). A mixed-effects model was used when heterogeneity was not significant (I2 < 50% or p-value > 0.1); otherwise, the random-effects model was performed. Publication bias was evaluated statistically via funnel plots, Begg’s test, and Egger’s test. Statistical significance was set at p < 0.05.
3. Results
3.1. Systematic Review Process and Quality Assessment
A total of 9269 records were retrieved from PubMed, EMBASE, and Cochrane Library. A flow chart of study screenings and the election process is shown in Figure 1. From the remaining 6283 references screened after removing duplicates, 385 potentially eligible references were identified. Eventually, 11 RCTs that met the inclusion criteria were selected for full-text review.
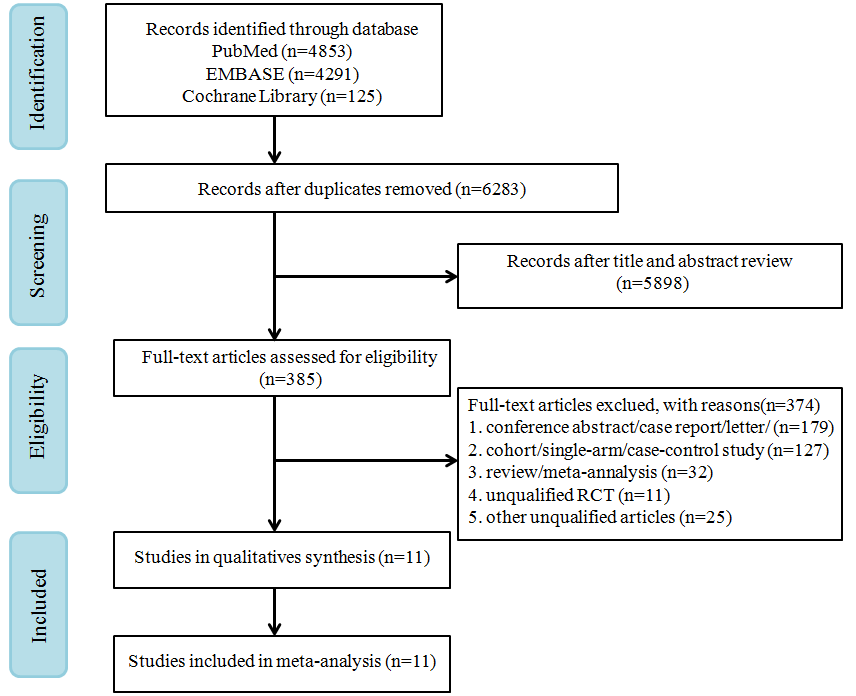
Figure 1. PRISMA flow diagram of randomized controlled trials (RCTs) of patients treated with oncolytic virus.
The risk of bias for the 11 included RCTs is shown in Figure 2. All the included RCTs were open-label trials. Most RCTs mentioned random allocation performed without using the random sequence generation method. Blinding was not performed because of the moral risk associated with the sham injection. In some RCTs [18][28][29][30][31][32][33][34], non-blinding had no significant effect on the efficacy or safety of oncolytic viruses; hence, they were judged as a low-risk factor.
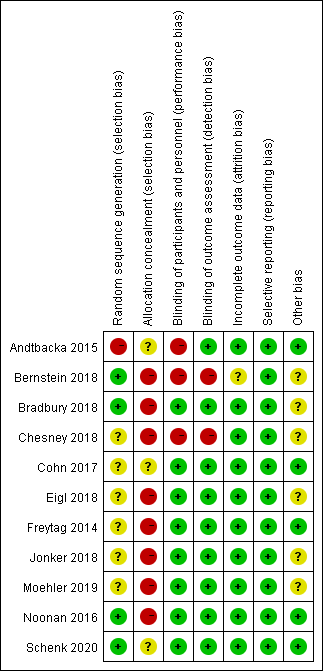
Figure 2. Assessment of risk of bias for 11 included randomized controlled trials.
3.2. Characteristics of Studies
We included eleven studies with a total of 1452 patients in this meta-analysis. The characteristics and outcomes of RCTs are presented in Tables 1 and 2. The OVs used in the included trials were T-VEC (n = 2), pelareorep (n = 6), NTX-010 (n = 1), Ad5-yCD/mutTKSR39rep-ADP (n = 1), and Pexa-Vec (n = 1). The types of tumors included melanoma, breast cancer, lung cancer, prostate cancer, hepatocellular carcinoma, colorectal cancer, pancreatic adenocarcinoma, and ovarian, tubal, or peritoneal cancer. The injection methods were either intratumoral or intravenous. Eleven included clinical trials of oncolytic viruses were conducted in the United States and Canada.
Oncolytic DNA viruses include T-VEC, Pexa-Vec, and Ad5-yCD/mutTKSR39rep-ADP, and they all carry transgenes. T-VEC is modified by deleting the ICP47 gene and ICP34.5 gene (the herpes virus neurovirulence factor) to reduce viral pathogenicity and enhance selective tumor replication [36][37]. In addition, T-VEC could elicit human granulocyte macrophage colony-stimulating factor (GM-CSF) to recruit and activate antigen-presenting cells with subsequent induction of tumor-specific T-cell responses [12]. Pexa-Vec (JX-594) is a thymidine kinase gene-inactivated vaccinia virus engineered by expressing the transgenes, including GM-CSF and β-galactosidase; it selectively targets tumor cells with activation of the Ras/MAPK signaling pathway [34][38]. Ad5-yCD/mutTKSR39rep-ADP is adenovirus carrying two cytotoxic gene systems, cytosine deaminase (cytosine deaminase (CD)/5-fluorocytosine (5-FC) and herpes simplex virus thymidine kinase (HSV-1 TK)/valganciclovir (vGCV), and it can enhance the sensitivity of tumor cells to specific drugs and radiation [33].
Oncolytic RNA viruses include pelareorep and NTX-010. Pelareorep is a human reovirus type 3 Dearing strain, which contains live, replication-competent reovirus, and has specific oncolysis with an activated Ras pathway [30][32]. Direct oncolysis of pelareorep led to release of “danger signals”, such as soluble tumor-associated antigens, viral pathogen-associated molecular patterns, and cell-derived damage-associated molecular patterns [15][39]. Therefore, direct oncolysis could result in generating innate and adaptive immune response to the tumor microenvironment and induces the antitumor immune response. Besides, NTX-010 (seneca valley virus) was a novel oncolytic picornavirus, which could target and lyse tumor cells [18][40].
Table 1. Characteristics of the RCTs included in this meta-analysis.
|
First Author (Year) |
Tumor Type |
Treatment Arm |
Injection Mode |
Age (Years) |
Male, No. (%) |
|
Andtbacka 2015 [25] |
Melanoma |
T-VEC vs. GM-CSF |
IT |
EG: median 63 (22–94) CG: median 64 (26–91) |
EG: 173/295 (59%) CG: 77/141 (55%) |
|
Bernstein 2018 [27] |
Breast cancer |
Pelareorep + paclitaxel vs. paclitaxel |
IV |
EG: median 61 (44–78) CG: median 57 (36–73) |
EG: 0/36 (0%) CG: 0/38 (0%) |
|
Bradbury 2018 [28] |
Non-small cell lung cancer |
Pelareorep + chemotherapy vs. chemotherapy |
IV |
EG-1: median 63 (43–78) EG-2: 64 (23–77) CG-1: median 65 (39–80) CG-2: 64 (41–84) |
EG: 36/77 (47%) CG: 41/75 (55%) |
|
Chesney 2018 [26] |
Melanoma |
T-VEC + ipilimumab vs. ipilimumab |
IT |
EG: median 65 (23–93) CG: median 64 (23–90) |
EG: 62/98 (63%) CG: 55/100 (55%) |
|
Cohn 2017 [29] |
Ovarian, tubal, or peritoneal cancer |
Pelareorep + paclitaxel vs. paclitaxel |
IV |
NR |
EG: 0/54 (0%) CG: 0/54 (0%) |
|
Eigl 2018 [30] |
Prostate cancer |
Pelareorep + docetaxel vs. docetaxel |
IV |
EG: median 69.1 (50.3–83.7) CG: median 68.6 (49.7–86.6) |
EG: 21/21 (100%) CG: 23/23 (100%) |
|
Freytag 2014 [33] |
Prostate cancer |
Ad5-yCD/mutTKSR39rep-ADP + IMRT vs. IMRT |
IT |
EG: mean 68.0 (55–78) CG: mean 65.2 (51–79) |
EG: 41/41 (100%) CG: 44/44 (100%) |
|
Jonker 2018 [31] |
Colorectal cancer |
Pelareorep + FOLFOX6/bevacizumab vs. FOLFOX6/bevacizumab |
IV |
EG: median 60 (34–79) CG: median 59 (31–78) |
EG: 19/51 (37%) CG: 21/52 (40%) |
|
Moehler 2019 [34] |
Hepatocellular carcinoma |
Pexa-Vec + BSC vs. BSC |
IV |
EG: mean 60 ± 11 CG: mean 55 ± 12 |
EG: 72/86 (84%) CG: 33/43 (77%) |
|
Noonan 2016 [32] |
Pancreatic adenocarcinoma |
Pelareorep + paclitaxel/carboplatin vs. paclitaxel/carboplatin |
IV |
EG: median 61.5 (39–84) CG: median 66 (45–81) |
EG: 22/36 (61.1%) CG: 19/37 (51.4%) |
|
Schenk 2020 [18] |
Small cell lung cancer |
NTX-010 vs. placebo |
IV |
EG: median 67 (44–81) CG: median 60 (50–82) |
EG: 14/26 (53.9%) CG:10/24 (41.7%) |
EG, experimental group; CG, control group; NR, not reported; BSC, best supportive care; IMRT, intensity modulated radiation therapy; IT, intratumoral; IV, intravenous.
Table 2. Summary of outcomes in the selected RCTs.
|
First Author (Year) |
Median OS (Months) |
HR (95% CI) for OS |
Median PFS (Months) |
HR (95% CI) for PFS |
ORR |
Severe Adverse Event |
|
Andtbacka 2015 [25] |
EG: 23.3 CG: 18.9 |
0.79 (0.62, 1.00) |
NR |
NR |
EG: 78 CG: 8 |
EG:105 CG: 27 |
|
Bernstein 2018 [27] |
EG: 17.4 CG: 10.4 |
0.61 (0.33, 1.12) |
EG: 3.78 CG: 3.38 |
1.11 (0.64, 1.92) |
EG: 9 CG: 9 |
EG: 18 CG: 18 |
|
Bradbury 2018 [28] |
EG: 7.8 CG: 7.4 |
0.98 (0.72, 1.34) |
EG: 3.0 CG: 2.8 |
0.90 (0.65, 1.25) |
EG: 11 CG: 11 |
NR |
|
Chesney 2018 [26] |
NR |
0.80 (0.44, 1.46) |
EG: 8.2 CG: 6.4 |
0.83 (0.56, 1.23) |
EG: 38 CG: 18 |
EG: 43 CG: 33 |
|
Cohn 2017 [29] |
EG: 12.6 CG: 13.1 |
1.01 (0.64, 1.58) |
EG: 4.4 CG: 4.3 |
1.11 (0.64, 1.91) |
EG: 8 CG: 9 |
NR |
|
Eigl 2018 [30] |
NR |
1.86 (0.97, 3.57) |
NR |
NR |
EG: 11 CG: 18 |
NR |
|
Freytag 2014 [33] |
No death |
NR |
No death |
NR |
NR |
EG: 1 CG: 1 |
|
Jonker 2018 [31] |
EG: 19.2 CG: 20.1 |
1.18 (0.75, 1.87) |
EG: 7.33 CG: 9.13 |
1.65 (1.02, 2.67) |
EG: 27 CG: 18 |
NR |
|
Moehler 2019 [34] |
EG: 4.2 CG: 4.4 |
1.19 (0.77, 1.83) |
EG: 4.94 CG: 5.2 |
NR |
EG: 0 CG: 0 |
EG: 45 CG: 7 |
|
Noonan 2016 [32] |
EG: 7.31 CG: 8.77 |
1.12 (0.66, 1.91) |
EG: 1.7 CG: 1.7 |
0.86 (0.52, 1.43) |
EG: 7 CG: 7 |
NR |
|
Schenk 2020 [18] |
EG: 6.6 CG: 13.2 |
1.49 (0.77, 2.87) |
NR |
1.03 (0.58, 1.83) |
EG: 1 CG: 4 |
EG: 9 CG: 5 |
EG, experimental group; CG, control group; HR, hazard ratio; OS, overall survival; PFS, progression-free survival; NR, not reported; CI, confidence interval.
3.3. Effectiveness
3.3.1. Objective Response Rate
Ten RCTs reported objective response rate (ORR). Since differences were observed in efficacy among various OVs; we performed subgroup analysis on the ORR based on species, oncolytic DNA/RNA viruses, and injection mode. There was a statistically significant difference in ORRs between patients that received T-VEC (n = 2, OR = 4.05, 95% CI: 1.96–8.33, I2 = 52%, p = 0.0002). However, there was no significant difference in ORRs between patients treated with pelareorep (n = 6, OR = 1.06, 95% CI: 0.70–1.58, I2 = 6%, p = 0.79), NTX-010 (n = 1, OR = 0.25, 95% CI: 0.03–2.38, p = 0.23), and Pexa-Vec (n = 1, not estimable) (Figure 3). Objective response rate benefit was observed in patients that received oncolytic DNA viruses (n = 3, OR = 4.05, 95% CI: 1.96–8.33, I2 = 52%, p = 0.0002) but not in those treated with oncolytic RNA viruses (n = 7, OR = 1.00, 95% CI: 0.66–1.52, I2 = 13%, p = 0.99) (Figure 4). In the subgroup analysis for injection methods, results showed that the intratumoral injection arm produced significant improvement (n = 2, OR = 4.05, 95% CI: 1.96–8.33, I2 = 52%, p = 0.0002), but no significant improvement was found for the intravenous injection arm (n = 7, OR = 1.00, 95% CI: 0.66–1.52, I2 = 13%, p = 0.99) (Figure 5).
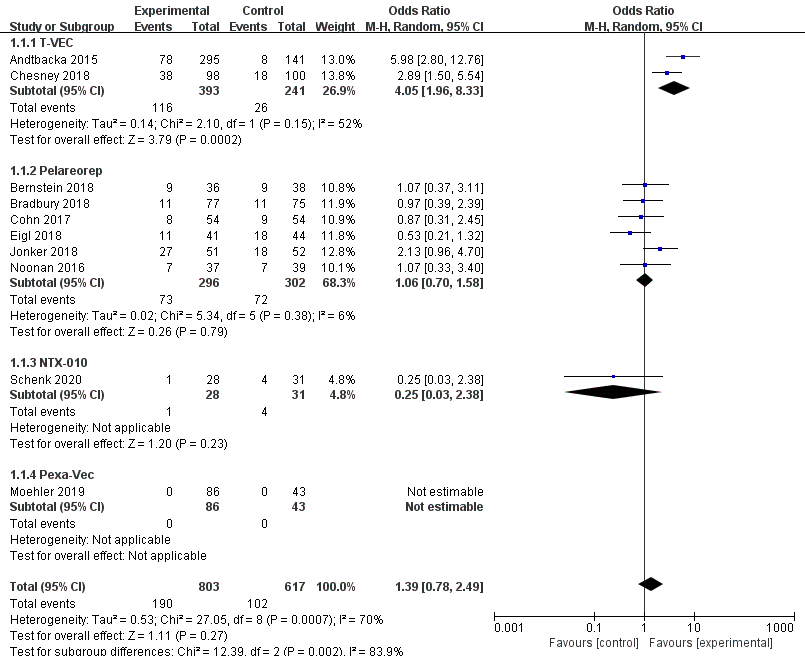
Figure 3. Forest plot of the pooled odds ratios (ORs) for objective response rate (ORR) in different oncolytic virus species.
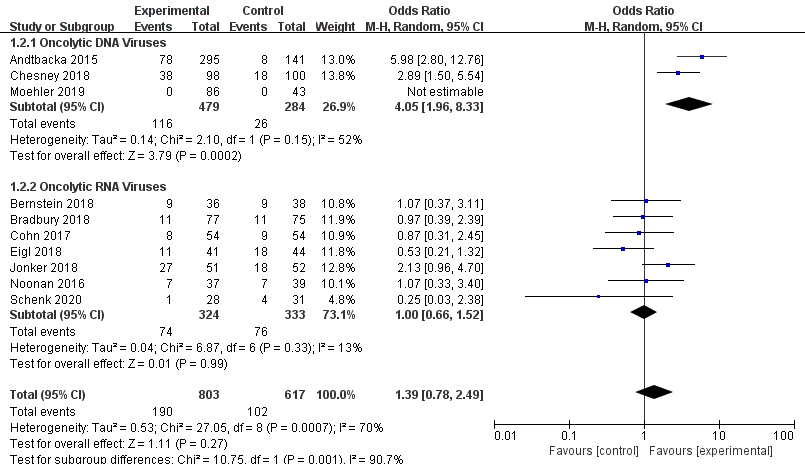
Figure 4. Forest plot of the pooled odds ratios (ORs) for objective response rate (ORR) of oncolytic DNA viruses and oncolytic RNA viruses.
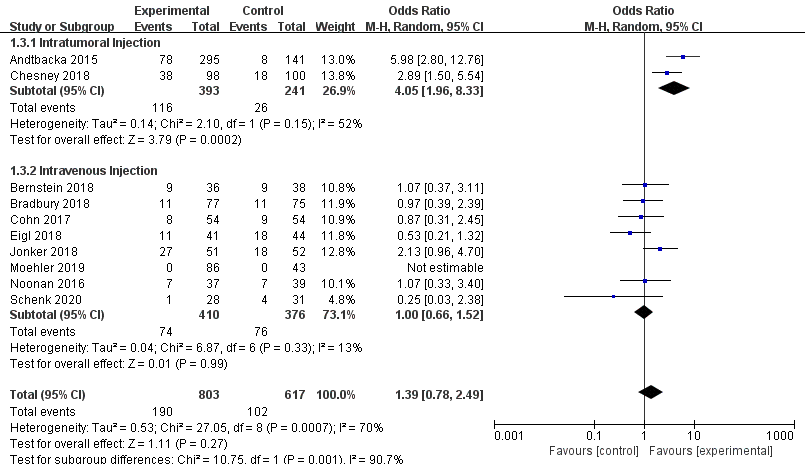
Figure 5. Forest plot of the pooled odds ratios (ORs) for objective response rate (ORR) of intratumoral and intravenous injections.
3.3.2. Overall Survival and Progression-Free Survival
Data regarding overall survival (OS) were available in ten RCTs, seven of which provided data for progression-free survival (PFS). Compared with the control group, patients treated with T-VEC had better OS (n = 2, HR = 0.79, 95% CI: 0.63–0.99, p = 0.04). However, treatment with pelareorep (n = 6, HR = 1.05, 95% CI: 0.84–1.31, p = 0.67), Pexa-Vec (n = 1, HR = 1.19, 95% CI: 0.77–1.83, p = 0.43), and NTX-010 (n = 1, HR = 1.49, 95% CI: 0.77–2.87, p = 0.24) did not improve the OS significantly compared to the control group (Figure 6). In addition, none of the patients benefited from T-VEC (n = 1, HR = 0.83, 95% CI: 0.56–1.23, p = 0.35), pelareorep (n = 5, HR = 1.07, 95% CI: 0.85–1.34, p = 0.59), and NTX-010 treatment (n = 1, HR = 1.03, 95% CI: 0.58–1.83, p = 0.92) in terms of PFS (Figure 7).
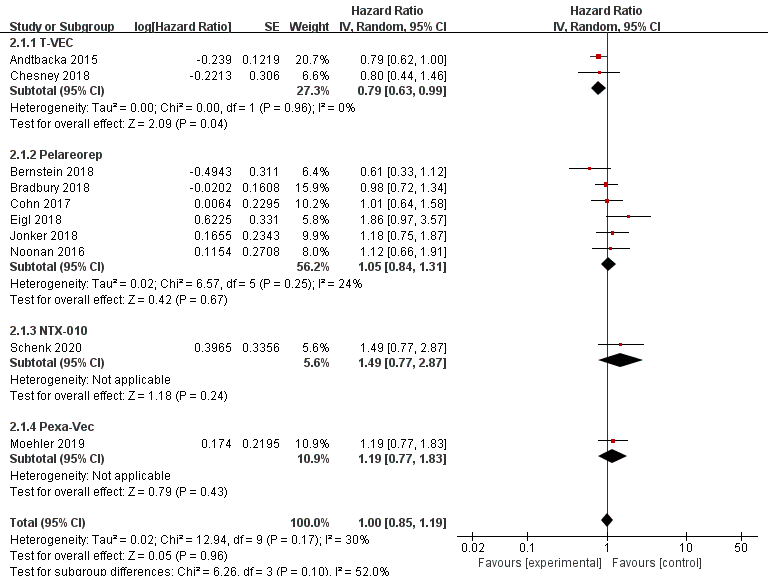
Figure 6. Forest plot of the pooled hazard ratios (HR) for overall survival (OS).
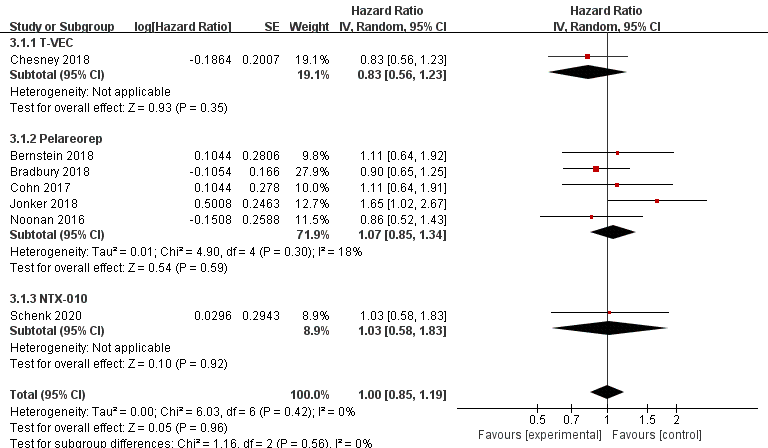
Figure 7. Forest plot of the pooled hazard ratios (HR) for progression-free survival (PFS).
3.4. Safety
Safety of oncolytic viruses remains a concern and most trials evaluate the safety aspect. The pooled risk ratio (RR) of severe adverse events (grade ≥3) was 1.44 (95% CI: 1.17–1.78, p = 0.0006, I2 = 13%) as shown in Figure 8a. The incidence of severe adverse events (AEs) in the oncolytic virus treatment group was higher than the control group (39% vs. 27%), with a pooled risk difference (RD) of severe AEs recorded at 0.12 (95% CI: 0.06–0.18, p = 0.0002, I2 = 37%) (Figure 8b); RD represents the rate of severe AEs attributed to oncolytic virotherapy. Furthermore, we analyzed detailed adverse events that may be associated with oncolytic virus treatment (Table 3). Patients treated with OVs had a higher risk for all-grade AEs such as fever (RR = 3.87, 95% CI: 2.15–6.69, p < 0.00001), neutropenia (RR = 1.66, 95% CI:1.21–2.29, p = 0.002), diarrhea (RR = 1.56, 95% CI:1.26–1.95, p < 0.0001), nausea (RR = 1.49, 95% CI: 1.28–1.74, p < 0.00001), vomiting (RR = 1.65, 95% CI: 1.27–2.14, p = 0.0002), chills (RR = 7.04, 95% CI: 4.64–10.66, p < 0.00001), flu-like symptoms (RR = 4.13, 95% CI:2.15–7.94, p < 0.0001), arthralgia (RR = 1.51, 95% CI: 1.09–2.12, p = 0.01), myalgia (RR = 1.97, 95% CI: 1.32–2.96, p = 0.001), extreme pain (RR = 1.50, 95% CI: 1.06–2.11, p = 0.02), headache (RR = 1.90, 95% CI: 1.42–2.53, p < 0.0001), and thrombocytopenia (RR = 2.74, 95% CI: 1.65–4.57, p = 0.0001). However, only neutropenia treatment yielded statistically significant severe adverse events (RR = 1.36, 95% CI: 1.03–1.80, p = 0.03).
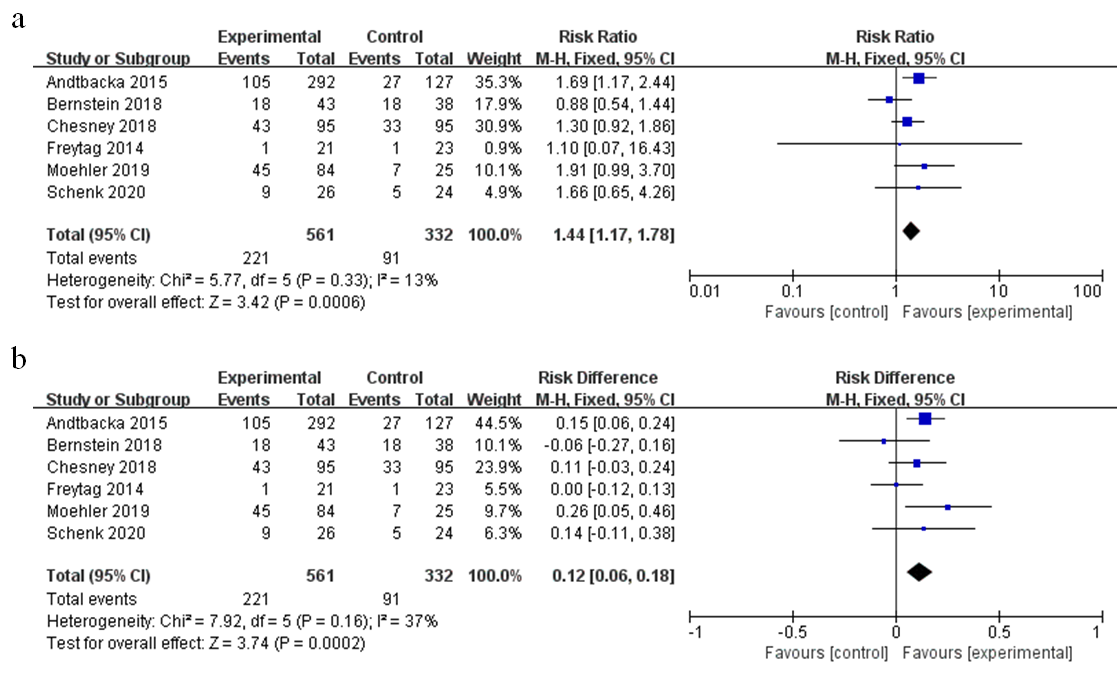
Figure 8. Forest plot of severe adverse events (grade ≥3): (a) the pooled risk ratios (RR); (b) the pooled risk difference (RD).
Table 3. Adverse events of interest.
|
Adverse Event |
All Grades |
Grade ≥3 |
||||||
|
I2 |
RR (95% CI) |
p |
Incidence of EG |
I2 |
RR (95% CI) |
p |
Incidence of EG |
|
|
Fever |
73% |
3.87 (2.15, 6.69) |
< 0.00001 * |
48.90% |
0% |
3.07 (0.62, 15.10) |
0.17 |
1.825% |
|
Neutropenia |
67% |
1.66 (1.21, 2.29) |
0.002 * |
63.01% |
50% |
1.36 (1.03, 1.80) |
0.03 * |
40.36% |
|
Febrile neutropenia |
66% |
1.76 (0.66,4.69) |
0.25 |
25.18% |
3% |
1.19 (0.77, 1.84) |
0.44 |
15.52% |
|
Leukopenia |
36% |
1.21 (0.96, 1.51) |
0.11 |
71.23% |
90% |
1.84 (0.23, 14.36) |
0.56 |
26.61% |
|
Diarrhea |
17% |
1.56 (1.26, 1.95) |
< 0.0001 * |
28.78% |
13% |
1.12 (0.56, 2.22) |
0.75 |
2.178% |
|
Nausea |
35% |
1.49 (1.28, 1.74) |
< 0.00001 * |
45.24% |
0% |
1.05 (0.48, 2.29) |
0.89 |
1.754% |
|
Vomiting |
36% |
1.65 (1.27, 2.14) |
0.0002 * |
27.84% |
5% |
0.68 (0.30, 1.52) |
0.35 |
1.983% |
|
Chills |
32% |
7.04 (4.64, 10.66) |
< 0.00001 * |
45.84% |
NA |
0.92 (0.04, 21.85) |
0.96 |
0.1825% |
|
Fatigue |
85% |
1.22 (0.95, 1.57) |
0.12 |
55.35% |
0% |
1.24 (0.83, 1.85) |
0.29 |
6.836% |
|
Flu-like symptoms |
60% |
4.13 (2.15, 7.94) |
< 0.0001 * |
31.29% |
0% |
4.41 (0.82, 23.81) |
0.08 |
1.23% |
|
Decreased appetite/anorexia |
25% |
1.23 (0.98, 1.56) |
0.08 |
25.91% |
51% |
0.55 (0.17, 1.76) |
0.32 |
0.6048% |
|
Arthralgia |
13% |
1.51 (1.09, 2.12) |
0.01 * |
19.01% |
0% |
0.94 (0.19, 4.67) |
0.94 |
0.6073% |
|
Myalgia |
47% |
1.97 (1.32, 2.96) |
0.001 * |
18.42% |
NA |
1.31 (0.05, 31.96) |
0.87 |
0.2208% |
|
Pain in extremity |
0% |
1.50 (1.06, 2.11) |
0.02 * |
20.98% |
0% |
1.57 (0.40, 6.21) |
0.52 |
1.897% |
|
Headache |
0% |
1.90 (1.42, 2.53) |
< 0.0001 * |
24.11% |
0% |
1.86 (0.47, 7.34) |
0.38 |
1.095% |
|
Cough |
17% |
0.85 (0.67, 1.07) |
0.17 |
21.66% |
NA |
0.32 (0.01, 7.85) |
0.49 |
0 |
|
Cellulitis |
NA |
3.70 (0.87, 15.76) |
0.08 |
5.822% |
NA |
2.64 (0.31, 22.18) |
0.37 |
2.055% |
|
Thrombocytopenia |
0% |
2.74 (1.65, 4.57) |
0.0001 * |
54.79% |
0% |
1.23 (0.58, 2.61) |
0.59 |
10.09% |
*, statistically significant value; 95% CI, 95% confidence interval; RR, risk ratio; NA, not available; I2, index of heterogeneity; EG, experimental group.
3.5. Publication Bias and Sensitivity Analysis
Publication bias was formally assessed using Begg’s test and Egger’s test. OS (Begg’s test, p = 0.283; Egger’s test, p = 0.126), PFS (Begg’s test, p = 0.548; Egger’s test, p = 0.307), and severe AEs (Begg’s test, p = 0.707; Egger’s test, p = 0.966) did not reveal any significant publication bias, but ORR (Begg’s test, p = 0.118; Egger’s test, p = 0.046 <0.1) had significant differences of publication bias. We made a sensitivity analysis by omitting a study to estimate meta-analysis of ORR. It suggested that omitting any one study had little effect on the overall result (each offset is minimal and between the upper CL limit and lower CL limits) (Figure 9). Therefore, the publication bias of ORR had limited impact on our conclusions.
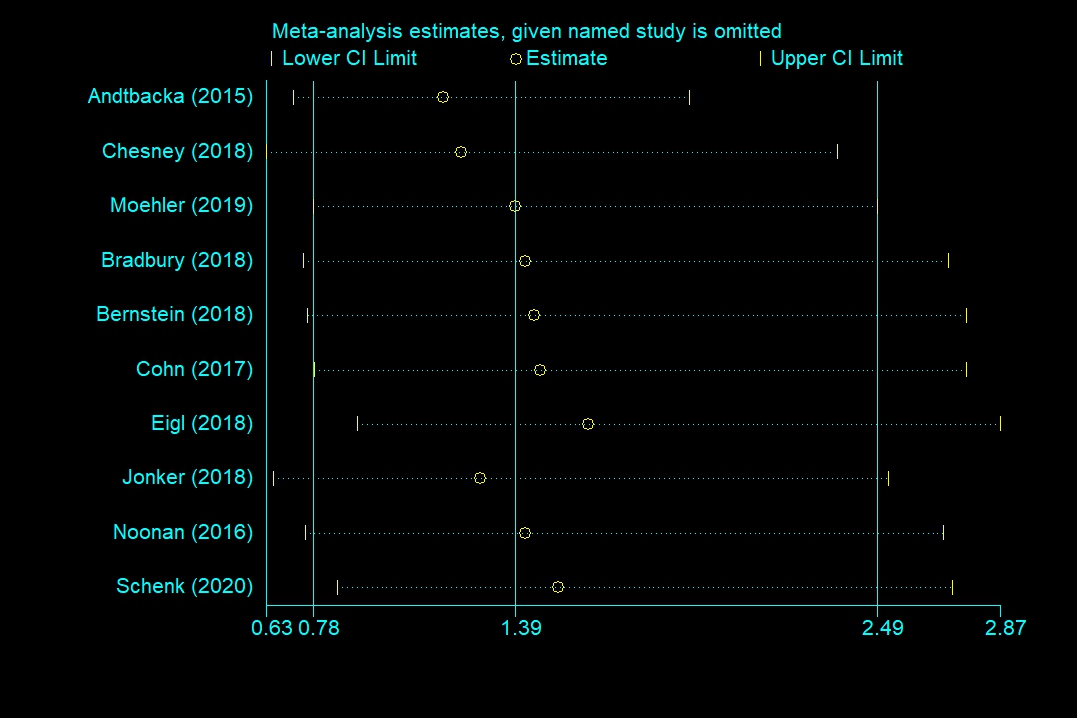
Figure 9. Sensitivity analysis of objective response rate (ORR).
4. Discussion
Oncolytic viruses possess the potential to kill cancerous cells (oncolysis); they also induce antitumor immune response through multiple mechanisms [41][42]. Such characteristics have made oncolytic virotherapy a promising immunotherapeutic approach for cancer patients. However, clinical trials have revealed that the presence of neutralizing antibodies in the blood prevents the oncolytic viruses (except reovirus) from replicating; activation of the immune system leads to rapid elimination of oncolytic viruses, and oncolytic viruses cannot target tumors due to physical parameters [5][43][44]. Furthermore, the best oncolytic virus, route of administration, prognosis of patients, and adverse reactions remain controversial.
In this study, we extracted data for objective response rate (ORR), overall survival (OS), and progression-free survival (PFS) for in-depth analysis of the effectiveness of oncolytic virotherapy. Generally, T-VEC (OR = 4.05, 95% CI: 1.96–8.33) showed remarkable clinical efficacy of ORR. Interestingly, the objective response rate benefit was observed in patients treated with oncolytic DNA viruses (OR = 4.05, 95% CI: 1.96–8.33) but not in those treated with oncolytic RNA viruses (OR = 1.00, 95% CI: 0.66–1.52). This may be because DNA viruses carry many external genes with important immunomodulatory effects. In addition, DNA viruses express high fidelity DNA polymerases, which maintain the integrity of the viral genome and sufficient amplification [15][41]. Increasing evidence suggests that the antitumor effect of oncolytic viruses is not only dependent on pure oncolysis but also virus-induced antitumor immunity [15][45][46]. The three mechanisms in which oncolytic virus breaks the immune tolerance include: (1) after the virus infects tumor cells, it induces antigen-presenting cells (APCs) to infiltrate the tumor infection site; (2) the tumor antigen released after the virus lyses tumor cells and enhances the antigen presentation ability of APCs, thereby generating a specific immune response against the tumor antigen, forming a long-term antitumor immune response; (3) while OVs replicate in the tumor, they also express immunomodulatory factors, and they jointly participate in further amplification of antitumor immunity [47][48]. Since RNA viruses often replicate quickly and only possess few foreign genes [16,23], their antitumor effect is mainly dependent on oncolysis than immune activation. In respect of injection mode, cancer patients gained a significant objective response rate benefit from intratumoral injection (OR = 4.05, 95% CI: 1.96–8.33). Due to physical parameters and virus dilution, the targeting and effect of intravenous injection were unsatisfactory [5]. Although intratumoral injection can circumvent the above-mentioned problems, it is also limited by tumor type.
From the survival data, only T-VEC (HR = 0.79, 95% CI: 0.63–0.99, p = 0.04) could effectively prolong overall survival (OS) of cancer patients. Pelareorep, Pexa-Vec, and NTX-010 were not statistically significant for OS. Moreover, no oncolytic virus affected progression-free survival (PFS) (HR = 1.00, 95% CI: 0.85–1.19). In patients with metastatic breast cancer, the median survival time of the experimental group (17.4 months) treated with pelareorep was remarkably longer than that of the control group (10.4 months). The HR of overall survival was 0.65 (80% CI: 0.46–0.91, p = 0.10). This suggests that pelareorep may be a new promising drug for metastatic breast cancer; more RCTs are, however, needed to validate it.
Oncolytic viruses are generally considered safe. However, the oncolytic virotherapies were associated with specific risks in this meta-analysis. The pooled risk ratios (RR) and risk difference (RD) of severe adverse events (AEs) were 1.44 (95% CI: 1.17–1.78, p = 0.0006) and 0.12 (95% CI: 0.06–0.18, p = 0.0002), respectively, indicating such therapies carry risks that should not be ignored. Any-grade AEs with an incidence greater than 10% included fever (48.90%), neutropenia (63.01%), febrile neutropenia (25.18%), leukopenia (71.23%), diarrhea (28.78%), nausea (45.24%), vomiting (27.84%), chills (45.84%), fatigue (55.35%), flu-like symptoms (31.29%), decreased appetite/anorexia (25.91%), arthralgia (19.01%), myalgia (18.42%), extreme pain (20.98%), headache (24.11%), cough (21.66%), and thrombocytopenia (54.79%). Severe AEs with an incidence greater than 5% included neutropenia (40.36%), febrile neutropenia (15.52%) leukopenia (26.61%), fatigue (6.836%), and thrombocytopenia (10.09%). In the one-sided test, statistically significance of high-grade flu-like symptoms (1.23%), cellulitis (5.822%) of any-grade, and decreased appetite/anorexia (25.91%) of any-grade were observed. Detailed severe AEs have not been reported yet, and may be due to the loss of follow up, leading to underestimation.
Our meta-analysis had the following limitations. First, we did not consider tumor types because of the insufficient number of RCTs to analyze same cancer. Secondly, in the subgroup analysis of objective response rate, there were few RCTs about oncolytic DNA viruses and intratumoral injection, and the conclusion needs more research to verify. Besides, the effective oncolytic virus was T-VEC. Therefore, the analysis results of the objective response rate may be affected by it. Finally, the heterogeneity of adverse events was biased upward since a wide range of oncolytic viruses was included. This review may provide new ideas for further research on oncolytic viruses to address the remaining challenges. We believe that oncolytic virotherapy will play an increasingly important role in cancer therapy with the increase of number of studies conducted.
5.Conclusions
In conclusion, the results of our meta-analysis showed that the objective response rate benefit was observed in oncolytic DNA viruses and intratumoral injections. Currently, only patients treated with T-VEC can prolong overall survival. Besides, our meta-analysis revealed that occurrence of severe adverse events associated with oncolytic virotherapy cannot be ignored. More qualitative RCTs are needed to test the efficacy and safety of oncolytic viruses.我们的荟萃分析具有以下局限性。首先,由于RCT数量不足以分析同一癌症,因此我们未考虑肿瘤类型。其次,在客观反应率的亚组分析中,关于溶瘤DNA病毒和肿瘤内注射的RCT很少,该结论需要更多的研究来验证。此外,有效的溶瘤病毒是T-VEC。因此,客观响应率的分析结果可能会受到影响。最后,由于包括了许多溶瘤病毒,因此不良事件的异质性向上偏移。这篇综述可能为溶瘤病毒的进一步研究提供新的思路,以解决剩余的挑战。我们相信溶瘤病毒疗法将在癌症治疗中发挥越来越重要的作用,随着研究数量的增加。