With the increase of resources and environmental constraints in the world, the environmental cost has become a problem affecting the sustainable development of the logistics industry in all countries. Carbon emissions are an important part of any environmental cost assessment. How to evaluate the impact of green GDP and regional efficiency of the logistics industry, especially under the constraint of carbon emissions, is of great significance for realizing green and sustainable development.
- logistics efficiency
- technological efficiency
1. Introduction
2. Efficiency Spatial Pattern and Analysis of China’s Logistics
2.1. Efficiency Spatial Pattern of China’s Logistics
The tree diagram of system clustering showed the classification of regional logistics efficiency in China. According to the results of system clustering, the logistics in 30 regions were divided into three categories: Category I included 13 regions, namely Hainan, Qinghai, Ningxia, Gansu, Xinjiang, Tianjin, Jiangxi, Guizhou, Anhui, Shaanxi, Guangxi, Chongqing, and Yunnan; Category II included 4 regions, namely Jilin, Heilongjiang, Hubei, and Inner Mongolia; and Hebei and the other 13 areas belonged to Category III. The statistical method of mean comparison was used to determine the classification characteristics. The specific values are shown in Table 1.| Groups and Mean | L | E | C | G | Ca |
|---|---|---|---|---|---|
| 1 | 12.75 | 22.44 | 480.35 | 338.40 | 162.23 |
| N | 13 | 13 | 13 | 13 | 13 |
| 2 | 23.23 | 241.82 | 708.19 | 599.22 | 317.14 |
| N | 4 | 4 | 4 | 4 | 4 |
| 3 | 33.48 | 30.83 | 998.87 | 1128.5 | 396.39 |
| N | 13 | 13 | 13 | 13 | 13 |
| Total | 23.13 | 55.32 | 735.42 | 715.53 | 284.35 |
| N | 30 | 30 | 30 | 30 | 30 |
2.2. Evaluation and Analysis of the Efficiency of China’s Regional Logistics Industry
To gain a deeper understanding of the logistics efficiency of each region, we used MAXDEA ultra 7.9 to measure the logistics efficiency of 30 regions in China from 2003 to 2016. After our calculations, we obtained the average value and ranking of the comprehensive efficiency and created a thermodynamic diagram. Figure 1 shows the distribution of the comprehensive efficiency and means values in 30 regions.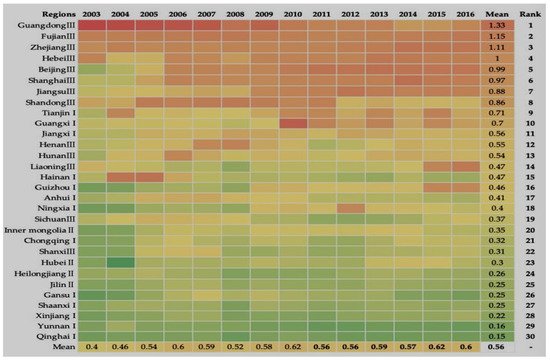
2.2.1. Analysis of the Comprehensive Efficiency of China’s Regional Logistics
Firstly, the comprehensive efficiency of China’s logistics was not high, but it showed a slow upward trend. In general, considering the carbon constraints, the average efficiency of China’s logistics from 2003 to 2016 was 0.56. The highest results were in 2010 and 2015 when it was 0.62. More than one-half of the samples have never reached an industrial efficiency of 1, and among the regions that have, it had not been maintained over a long period. Concerning the national average, the logistics efficiency hovered around 0.5, which means that under this model, the actual output of the logistics in most regions of the sample did not reach 50% year-over-year. Other research during earlier periods under the same conditions did not reach 0.3, so, overall, it has improved, and the mean value of the research interval efficiency showed an upward trend, indicating that the efficiency was gradually increasing. Secondly, the proportion of effective years of regional logistics efficiency was low, but the efficiency of regional logistics was quite different. Of the 420 technological efficiency samples, only 99 were effective (i.e., technological efficiency was greater or equal to 1, marked in red on the thermal diagram), shown in Figure 2. That is, the proportion of technological efficiency in 30 regions was only 23.57% from 2003 to 2016. There were four regions with average effective comprehensive efficiency in the study area, accounting for 13.33%, which were Guangdong, Fujian, Zhejiang, and Hebei. Only Fujian and Zhejiang achieved technological efficiency every year from 2003–to 2016. There were 8 regions that achieved or exceeded 50% technological efficiency, accounting for 26.67%; there were 14 regions that never achieved the technological efficiency, accounting for 46.67%; the remaining 8 regions only achieved the technological efficiency in 1–3 years, accounting for 26.67%. The proportion of units that had not achieved technological efficiency for more than half of the years from 2003 to 2016 reached 73.33%, which indicated that these areas continued to have significant issues in resource allocation capacity and resource utilization efficiency.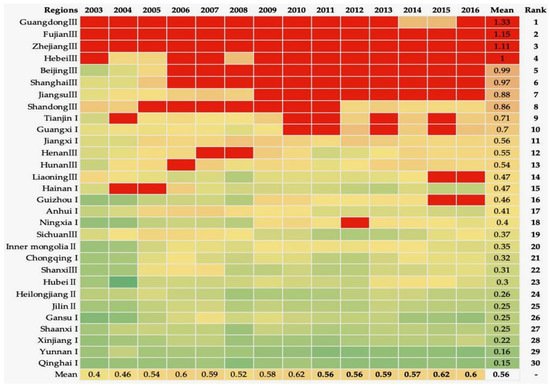
2.2.2. Analysis of the Spatial Pattern Evolution of Regional Logistics Efficiency
The top 10 efficiency rankings were two Category I regions, zero Category II regions, and eight Category III regions; in the 11–20 rankings, there were five Category I regions, one Category II region, and four Category III regions. In the last 10 rankings, there were six Category I regions, three Category II regions, and one Category III region. The overall level of logistics efficiency in Category III was relatively high. Half of the Category I had a medium level of efficiency while the other half, similar to the Category II region, was low. Based on the spatial distribution of regional logistics efficiency, among the 13 regions of Category III, 2 regions (Fujian and Zhejiang) achieved technological efficiency, 6 regions (Guangdong, Hebei, Beijing, Shanghai, Jiangsu, and Shandong) achieved technological efficiency more than half of the time, and the proportion of technological efficiency for more than one year was 61.54%; 3 regions (Henan, Hunan, and Liaoning) only achieved DEA effectiveness in 1–3 years, and the remaining 2 regions (Shanxi and Sichuan) never reached technology effectiveness. While four regions (Inner Mongolia, Hubei, Heilongjiang, and Jilin) in Category II never achieved technology effectiveness, the most effective years in Category I regions were few as well. Tianjin had the most, with an average annual value of 0.71, and for 5 out of 14 years, they achieved technology efficiency. The regions that achieved partial efficiency during the study period were: Guangxi, 4 years; Hainan and Guizhou, 2 years; and Hunan and Ningxia, 1 year. Regions such as Jiangxi, Anhui, Chongqing, Gansu, Shaanxi, Xinjiang, Yunnan, and Qinghai did not achieve this level in any year. Among the three types of regions, the effective proportion of logistics efficiency in the Category III region was the highest, which basically achieved half of the effective years. In the Category I region, only a few years were effective, while in the other half of the region, similar to the Category II region, the logistics efficiency had not reached technological efficiency. Therefore, there was a significant gap in the technological efficiency of logistics. During the statistical period, the technological efficiency in the Category III region was higher than both the average level of the Category II region and the Category I region taken together, and it was also higher than the national average.2.2.3. Time Evolution Analysis on Comprehensive Efficiency of Regional Logistics
To clearly observe the time evolution of regional logistics efficiency, the efficiency trend-charts during the research period are provided. The categories were grouped and sorted in descending order according to their logistics efficiency score based on the results from the system clustering analysis. As shown in Figure 3, the areas with obvious upward trends in logistics efficiency included Beijing, Shanghai, Jiangsu, Liaoning, Guizhou, Anhui, and Beijing; Shanghai and Jiangsu had a more obvious upward trend of efficiency, among which Beijing maintained a stable upward direction since 2008. Whereas Shanghai had a relatively large upward trend in 2003–2006 and then a steady upward state, Jiangsu maintained an 8% efficiency increase rate prior to 2012. There were a few regions showing a downward trend: Guangdong, Shandong, and Henan. Guangdong and Shandong had an efficiency decline, but they began to stabilize and maintain an increasing trend after 2014. The logistics efficiency of the other regions showed a slight increase in fluctuations.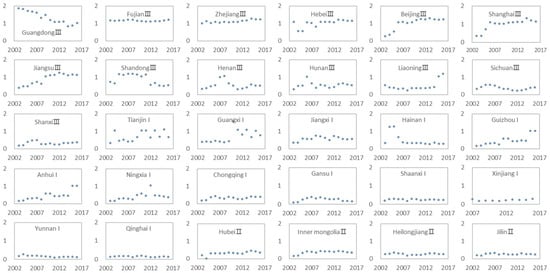
3 Conclusions and Policy Implications
The comprehensive technological efficiency (TE) of each region from 2003 to 2016 was decomposed into pure technological efficiency (PTE) and scale efficiency (SE). And analyze its change trend and regional differences. At the same time, the input redundancy ratio of various elements in each region is analyzed. By projecting the production frontier of the logistics in each region, we could not only understand the use of its factor input, but we could also analyze the reasons for its ineffectiveness and determine the degree of its attribute value for improvement and the ideal value of input-output.
The results show that: The proportion of effective years of regional logistics in comprehensive efficiency was low, and there were obvious deficiencies between regions due to the low level of PTE and low SE in most areas. During the studied time period, the efficiency of logistics in most regions showed an upward trend. In a few areas, there was a slight deterioration inefficiency, or little change whatsoever. However, the comprehensive efficiency of logistics has gradually been improving. According to the technological efficiency decomposition, approximately one-third of China’s logistics achieved PTE optimization, and two-thirds of China’s logistics was lagging behind in terms of logistics management techniques and methods. This has led to wasted logistics resources and inefficient logistics output, with varying degrees of redundancy in labor, capital, and energy inputs. The other 10% of the regions were in the stage of diminishing returns to scale, but they had achieved super-efficient output. At the same time, we found that in the process of logistics development, the low-carbon operations had not been realized. High efficiency, low efficiency, and high emissions existed simultaneously, and the input-output factors need to be balanced.
Therefore, China’s logistics should further encourage the coordinated development of inter-regional logistics. The government should consider the factors involved in high-efficiency and low-emission areas, provide national and regional logistics nodes for the surrounding areas, and promote the interconnection of logistics infrastructure and information-resource sharing. The local government should provide corresponding industrial support policies to improve the developmental environment of logistics, further encourage industrial technology innovation, and accelerate the progress of cutting-edge technology. However, under carbon constraints, the efficiency of the Category III regional logistics was generally high while other regions were relatively low. The difference in technological efficiency between regions continues to deteriorate. It indicates that there are strong mobile barriers between China’s logistics regions. Only a few economically developed regions have benefited from technological progress and efficiency improvements. The transition process has had a stronger divergent trend than the technological progress. If the region cannot break through development barriers such as ineffective government policies, technological efficiency will continue to decline. Therefore, we should encourage innovation while promoting inter-regional industrial technology education and knowledge sharing, which would not only improve the productivity level of logistics in other regions but also increase the return of innovation and generate stronger innovation incentives. By improving the developmental ability of regional logistics, the regional economy will inevitably be improved with complementary advantages and mutual benefits. Therefore, for the areas that have not optimized their technological efficiency and have insufficiently integrated their resource utilization, they should consider the potential existing logistics resources, improve the level of logistics operation, and raise their management level. After the management and technical levels have been addressed, the scale of logistics can be expanded. For areas with low scale efficiency, it may be possible to increase capital and energy input, expand the industrial scale and achieve scale efficiency, and pay attention to the role of management and technology in scale operation, according to the needs of regional development. At the same time, they should focus on the role of management and technology in scale operations. Therefore, the rational use of various elements, the coordination of capital and technology, the reduction in investment redundancy, and the acceleration of the application and development of energy-saving and emission-reduction technologies should be the key turning points for the change from extensive to intensive.
[ 1 ] [ 2 ] [ 3 ] [ 4 ] [ 5 ] [ 6 ] [ 7 ] [ 8 ] [ 9 ] [ 10 ] [ 11 ] [ 12 ] [ 13 ] [ 14 ] [ 15 ] [ 16 ] [ 17 ] ] [ 18 ] [ 19 ] [ 20 ][ 21 ] [ 22 ] [ 23 ] [ 24 ] [ 25 ] [ 26 ] [ 27 ] [ 28 ] [ 29 ] [ 30 ] [ 31 ] [ 32 ] [ 33 ] [ 34 ] [ 35 ] [ 36 ] [ 37 ] [ 38 ] [ 39 ] [ 40 ][ 41 ] [ 42 ] [ 43 ] [ 44 ] [ 45 ] [ 46 ] [ 47 ]References
- Zhang, J.J.; Zhao, Q.L. Review of logistics capability and regional economic development. Technical Economics and Manage-ment Research, 2017, 2, 115-118.
- Knemeyer, A.M.; Murphy, P.R. Evaluating the Performance of Third‐Party Logistics Arrangements: A Relationship Marketing Perspective. Journal of Supply Chain Management, 2004, 40, 35-51.
- Pazirandeh, A.; Jafari, H.; IHH, MaL.; Högskolan, I.J. Making sense of green logistics. International Journal of Productivity and Performance Management, 2013, 62, 889-904.
- Fumero, F.; Vercellis, C. Synchronized development of production, inventory, and distribution schedules. Transportation Sci-ence, 1999, 33, 330-340.
- Hongmei, H.; Haifang, C. Analyzing key influence factors of city logistics development using the fuzzy decision-making trial and evaluation laboratory (DEMATEL) method. African Journal of Business Management, 2012, 6, 11281-93.
- Yu, Y.Z., Wu, P. Empirical study on the efficiency of China's logistics and its influencing factors —analysis of stochastic frontier production function based on Chinese inter-Provincial data. Industrial Economics Research, 2010, 1, 65-71.
- Hamdan, A.(Jamie); Rogers, K.J. Evaluating the efficiency of 3PL logistics operations. International Journal of Production Eco-nomics, 2008, 113, 235-244.
- Saen, R.F. A new model for selecting third-party reverse logistics providers in the presence of multiple dual-role factors. The International Journal of Advanced Manufacturing Technology, 2010, 46, 405-410.
- Martinez-budria, E.; Diaz-armas, R.; Navarro-ibanez, M. A study of the efficiency of Spanish port authorities using data envelopment analysis. International journal of transport economics, 1999, 26, 237-253.
- Tian,Y. Research on logistics efficiency evaluation method. Logistics Technology, 2000, 1, 15-19.
- Liu, M.Z.; Zhou, M. H.; Yang, J. DEA-based urban logistics efficiency evaluation model and empirical. Statistics and Decision, 2009, 6, 50-52.
- Gao, M.J.; Lei ,N. An empirical study on logistics efficiency in Shaanxi Province. Logistics and Procurement in China, 2012, 9, 72-73.
- Yun, J.; Zhang, F. Port logistics efficiency evaluation based on DEA model. Statistics and Decision, 2006, 19, 39-40.
- Liu, S.Y.; Tian, D.G. Analysis of logistics efficiency of the Yangtze River economic belt. Logistics Engineering and Management, 2016, 1, 37-39, 45.
- Kechagias, E.P.; Miloulis, D.M.; Chatzistelios, G.; Gayialis, S.P. & Papadopoulos, G.A. Applying a system dynamics approach for the pharmaceutical industry: simulation and optimization of the quality control process. arXiv e-prints, arXiv-2112. 2021, 17, 983-996.
- Hahn, G. J. Industry 4.0: a supply chain innovation perspective. International Journal of Production Research. 2020, 58, 1425-1441.
- Gayialis, S.P.; Kechagias, E.P. & Konstantakopoulos, G.D. A city logistics system for freight transportation: integrating information technology and operational research. Operational research. 2022, 1-30.
- Gayialis, S.P.; Kechagias, E.P.; Konstantakopoulos, G.D.; Papadopoulos, G.A. & Tatsiopoulos, I.P. An approach for creating a blockchain platform for labeling and tracing wines and spirits. In IFIP International Conference on Advances in Production Management Systems. Springer, Cham. 2021, 81-89.
- Zhong, K.Y. Does the digital finance revolution validate the Environmental Kuznets Curve? Empirical findings from China. PLoS ONE, 2022, 17, 119.
- Zhong, K.Y.; Wang, Y.F.; Pei, J.M.; Tang, S.M.; Han, Z.L. Super Efficiency SBM-DEA and Neural Network for Performance Evaluation. Inf. Process. Manag. 2021, 58, 102728.
- Liu, B.Z.; Yu, Y.Z. An empirical study on the differences of regional efficiency between China's logistics and its influencing factors—based on the data envelopment analysis model and Tobin model. China Circulation Economy, 2010, 26, 18- 21.
- Neto, J.; Bloemhof-Ruwaard, J.M.; Nunen, J.; Heck, E.V. Designing and evaluating sustainable logistics networks. International Journal of Production Economics, 2008, 111, 195-208.
- Lee, D.H.; Dong, M.; Bian, W. The design of sustainable logistics network under uncertainty. International Journal of Production Economics, 2010, 128, 159-166.
- Wei, D. S. Sustainable logistics networks in sparsely populated areas. Journal of Service Science & Management, 2010, 3, 72-77.
- Digiesi, S.; Mossa, G.; Mummolo, G. A loss factor-based approach for sustainable logistics. Production Planning & Control. 2011, 8, 160-170.
- Zhi, H.H. Distribution, transshipment, and sustainable logistics for fashion products. Analytical Modeling Research in Fash-ion Business, 2016, 1, 155–196.
- Knaak, N.; Kruse, S.; Page, B. An agent-based simulation tool for modeling sustainable logistics systems. 2006,8, 1-7.
- Wang, Q.M.; Tan, C.W. An empirical study of logistics efficiency and its Influencing Factors in Xi'an—based on DEA model and Tobit regression model analysis. Soft Science, 2013, 27, 70-74.
- Markovitssomogyi, R.; Bokor, Z. Assessing the logistics efficiency of European countries by using the DEA-PC methodology. Transport, 2014, 29, 137-145.
- Zhai, Z.C.; Jin, J.W.; Wang, J.X. The effectiveness of DEA method and the technical scale of transportation enterprises. High-way Traffic Technology, 1994, 11, 44-50.
- Ni M.; He C.; Yang, S.L. Empirical study on regional logistics efficiency evaluation and its influencing factors. Journal of East China Jiaotong University, 2015, 32, 65-72.
- Yang, L.J.; Wu, W.; Su,Q., Jiang, X.W.; Wei, Y.L. Evaluation of China's highway transportation efficiency from 1997 to 2010 based on SBM-Undesirable model. Progress in Geography, 2013, 32, 1602-1611.
- Zhang, L.G.; Li, D.; Zhou, D.Q. Dynamic changes and regional differences of Carbon Dioxide emission performance in China's logistics—An empirical analysis based on provincial panel data. System Engineering, 2013, 31, 95-102.
- Hai, L.A.; Veeman, T.S. Non-parametric productivity analysis with undesirable outputs: an application to the Canadian pulp and paper industry. American Journal of Agricultural Economics,2001, 83, 605-16.
- Seiford, L.M.; Zhu, J. Modeling undesirable factors in efficiency evaluation. European Journal of Operational Research, 2002, 142,, 16-20.
- Fare, R.; Grosskopf, S.; Pasurka. C.A. Environmental production functions and environmental directional distance functions. Energy, 2007, 32, 1055-1066.
- Wang, B; Zhang, Q. Study on different production efficiency models under environmental constraints. Systems Engineering —Theory & Practice, 2002, 22, 1-8.
- Tone, K. A slacks-based measure of efficiency in data envelopment analysis. European Journal of Operational Research, 2001, 130, 498-509.
- Tone, K. A slacks-based measure of super-efficiency in data envelopment analysis. European Journal of Operational Research, 2002, 143, 32-41.
- Tang, J.R; Lu,L.Z. Analysis of logistics efficiency under low carbon constraints. China's Circulation Economy, 2013, 1, 40-47.
- Min,H; Jong, J.S. Benchmarking the operational efficiency of third party logistics providers using data envelopment analysis. Supply Chain Management, 2006, 11, 259-65.
- Zhang,Y.; Hu,H.Q. Analysis of operation efficiency of Chinese civil airport based on Malmquist productivity index. Systems Engineering, 2006, 1, 44-53.
- Yu,J. Analysis of total factor productivity of China's airline industry based on the Malmquist index. Journal of Beijing Institute of Technology (Social Science Edition), 2007, 12, 58--65.
- Charnes, A.; Cooper, W. Rhodes, E. Measuring the efficiency of decision-making units. European Journal of Operational Research,1978, 1, 429-444.
- Wang, C.-N.; Day, J.-D.; Lien, N.T.K.; Chien, L.Q. Integrating the additive seasonal model and Super-SBM model to compute the efficiency of port logistics companies in Vietnam. Sustainability, 2018, 10, 2782.
- Xin,Y.R.; Chen,Q,; Xiao, J.Z.; Factor Decomposition of Labor Productivity in my country's Manufacturing Industry—A Dynamic Research Based on Nonparametric DEA. Systems Engineering, 2008, 5, 1-8.
- Zhong, K.; Li, C.; Wang, Q. Evaluation of Bank Innovation Efficiency with Data Envelopment Analysis: From the Perspective of Uncovering the Black Box between Input and Output. Mathematics 2021, 9, 3318.