Remote sensing (RS) enables a cost-effective, extensive, continuous and standardized monitoring of traits and trait variations of geomorphology and its processes, from the local to the continental scale. RS technologies can record geomorphic traits, their diversity and variations, from which the other four geomorphodiversity characteristics are derived. However, compared to in situ measurements, RS approaches can only record certain parts of these geomorphic traits and their variations. This is because capturing geomorphic traits and diversity using RS approaches is limited by various constraints, namely: (1) the characteristics and spatial-temporal distribution of geomorphic traits; (2) the characteristics of geomorphological processes; as well as (3) the RS sensor characteristics, the chosen RS platforms and the characteristics of RS data-processing and classification information. These constraints and limitations define the detectability, feasibility, accuracy, depth of information, repeatability, and, thus, standards disability in monitoring the five geomorphic characteristics using RS approaches.
- Remote sensing
- Geomorphodiversity
- Structural
- Taxonomic
- Genesis
- Functional
- Traits
- Geomorphic Traits
- Biodiversity
- Earth Observation
1. Characteristics of Geomorphodiversity
-
Geomorphic trait diversity, which represents the diversity of mineralogical, bio-/geochemical, bio-/geo-optical, chemical, physical, morphological, structural, textural, or functional characteristics of geomorphic components that affect, interact with, or are influenced by geomorphic genesis diversity, geomorphic taxonomic diversity, geomorphic structural diversity, and geomorphic functional diversity.
-
Geomorphic genesis diversity represents the diversity of the length of evolutionary pathways, linked to a given set of geomorphic traits, taxa, structures, and functions. Therefore, sets of geomorphic traits, taxa, structures, and functions are identified that maximize the accumulation of geomorphic-functional diversity.
-
Geomorphic structural diversity, which is the diversity of composition and configuration of 2D to 4D geomorphic structural traits.
-
Geomorphic taxonomic diversity, which stands for the diversity of geomorphic components that differ from a taxonomic perspective.
-
Geomorphic functional diversity, which is the diversity of geomorphic functions and processes, as well as their intra- and interspecific interactions.
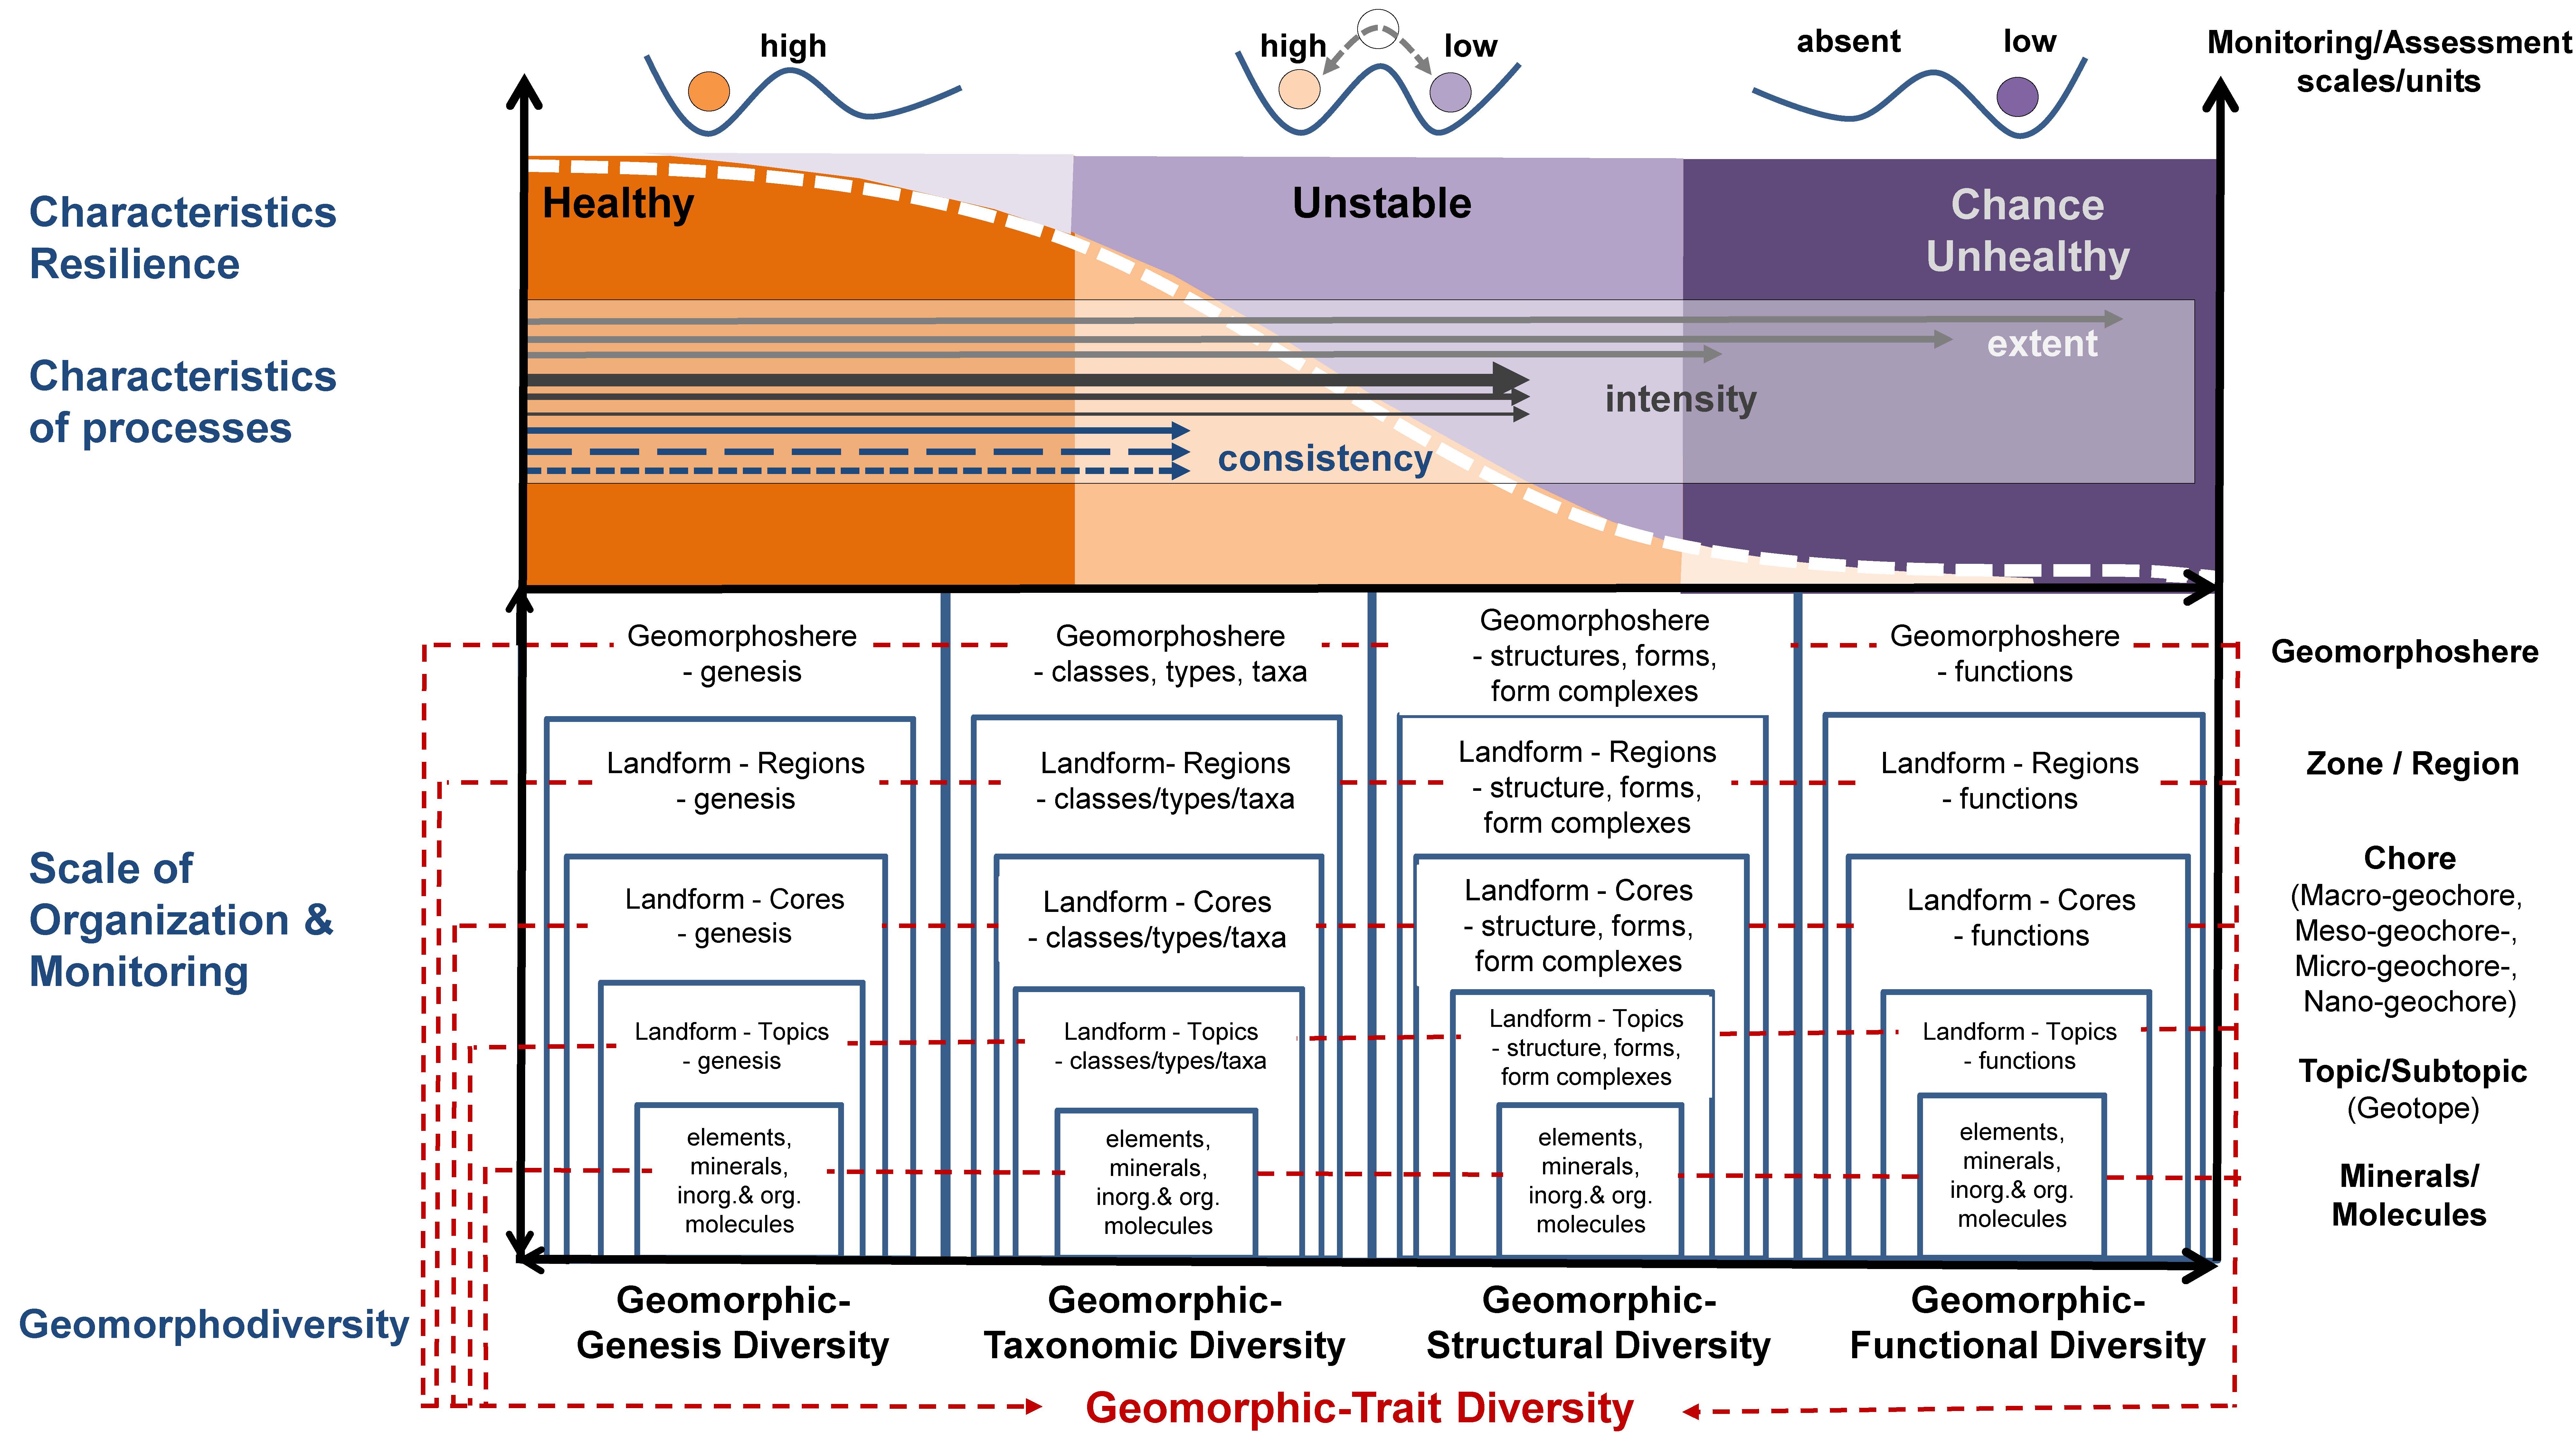 Figure 3. The five characteristics of geomorphodiversity exist on all the spatial, temporal, and directional scales of geomorphic organization (modified after Lausch et al. [7]).
Remote Sens. 2022, 14, 2279 10 of 48 traits are referred as spectral trait variations (STV). Hence, the respective RS approaches are referred as RS spectral traits and RS spectral trait variations—concept (RS-ST/STV-C; see Figure 1Figure 5) [2][47].
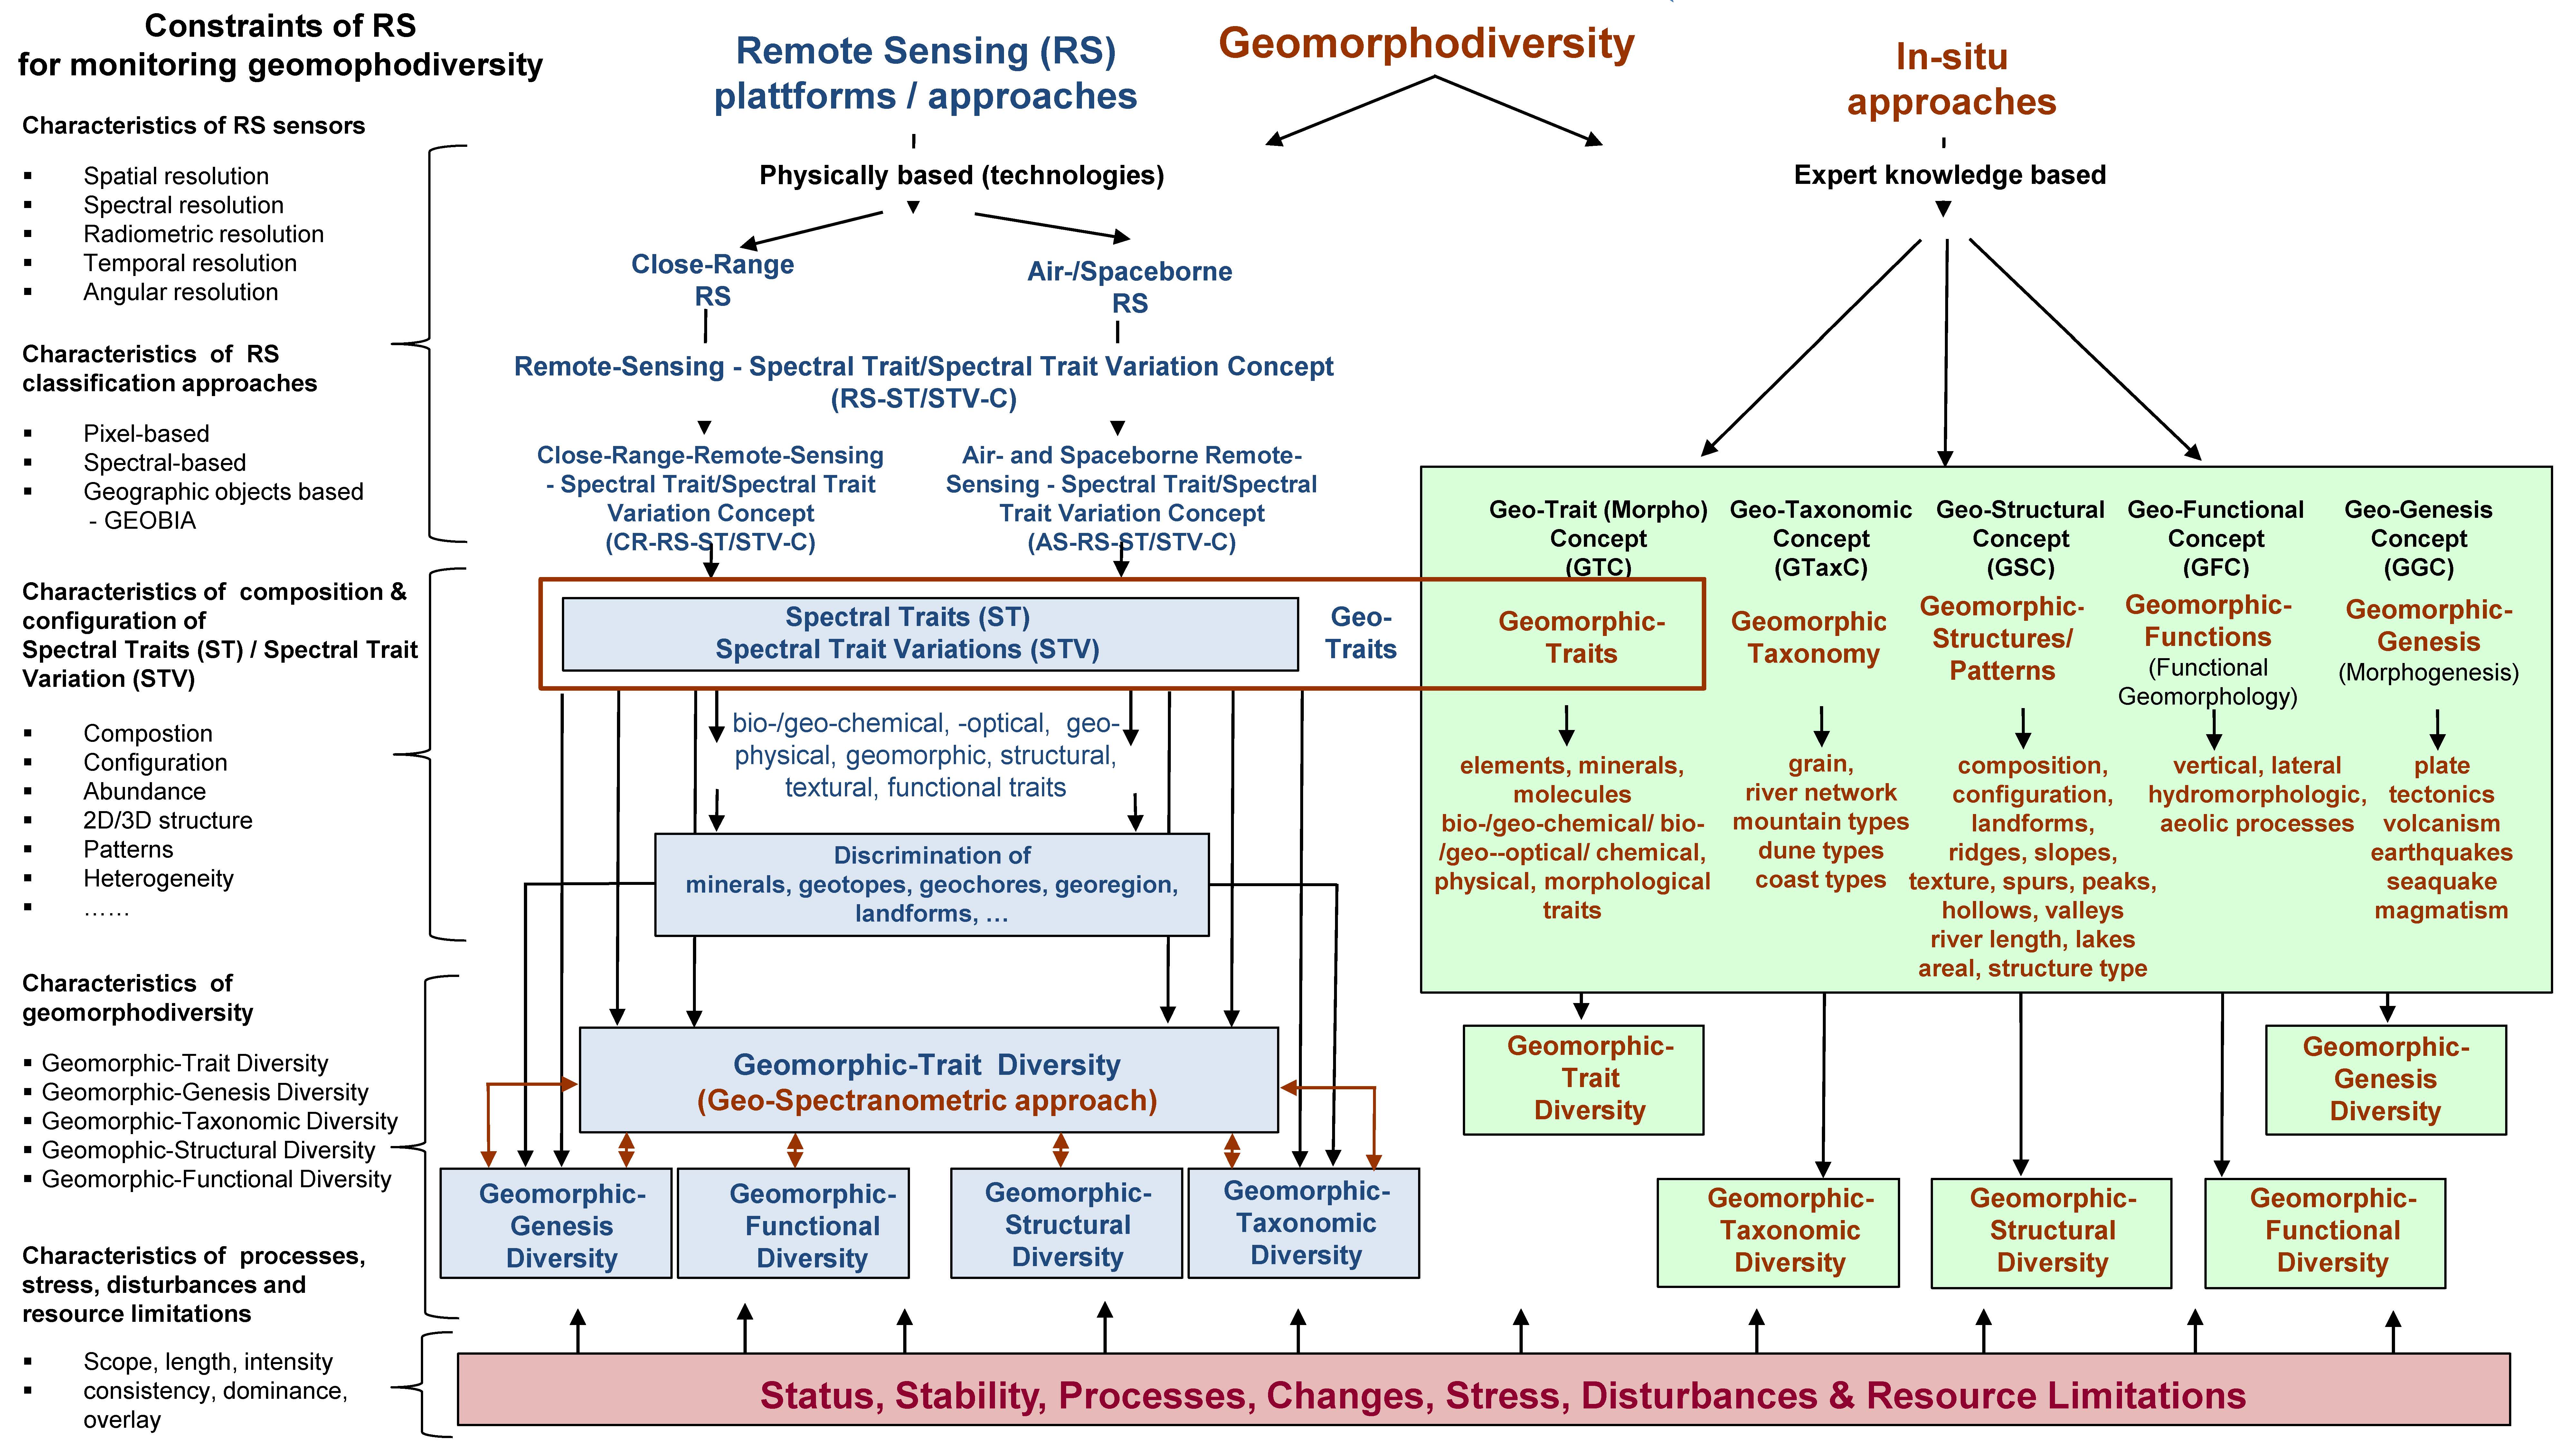 Figure 1Figure 5. In situ and remote sensing (RS) approaches, common links, and the constraints of RS for monitoring the five characteristics of geomorphodiversity. Geomorphological traits are the crucial link between in situ and RS monitoring approaches (from Lausch et al. [1] [7]).
2. Geomorphic Trait Diversity and Its Changes Using RS
“Geomorphic trait diversity represents the diversity of mineralogical, bio-/geochemical, bio-/geo-optical, chemical, physical, morphological, structural, textural or functional characteristics of geomorphic components that affect, interact with or are influenced by the geomorphic-genesis diversity, the geomorphic taxonomic diversity, the geomorphic structural diversity, and the geomorphic functional diversity” [1]. Only when features, such as the radiometric, geometric, spectral, angular, or temporal resolution of RS sensors, are specific for the detection of geomorphological spectral features, these can be detected with RS. The requirements for the resolutions differ, for example, when different minerals (silicates, oxides, carbonates, sulfates, chlorides), material types (sand, rock, gravel, soils), material properties (texture, colors, shapes) or form features (river valleys, fracture steps, pits, slope inclinations, or curvatures of river loops) should be detected. RS can record and monitor geomorphic trait diversity based on geomorphic spectral traits/trait variations. If the landforms to be recorded do not differ with respect to the mineralogical, bio-/geochemical, bio-/geo-optical, chemical, physical, morphological, structural, textural, or functional characteristics of their geomorphic components, then they cannot be differentiated from each other using RS technologies. The detectability of geomorphic trait diversity forms a crucial basis for the detection, differentiation, classification, and monitoring of the remaining four characteristics of geomorphodiversity. In regions without vegetation cover compared to regions with vegetation cover, the recording of geomorphic trait diversity with RS technologies is possible using direct RS indicators. The spectral RS signal is the result or integral of the state and the changes, shifts and/or disturbances of geomorphic traits, geogenesis traits, structure traits, and taxonomy as well as functional traits. In regions covered by vegetation, water or ice, indirect indicators may be used in addition to the direct RS indicators that are integral to the response of traits in bacteria, algae, plants, populations, communities, and traits of landforms and their interactions. RS techniques are, therefore, the only and the most essential method and basis for monitoring geomorphic trait diversity, which is the basis of the geo-spectranometric approach and the “spectral fingerprint of geomorphology and geomorphodiversity”.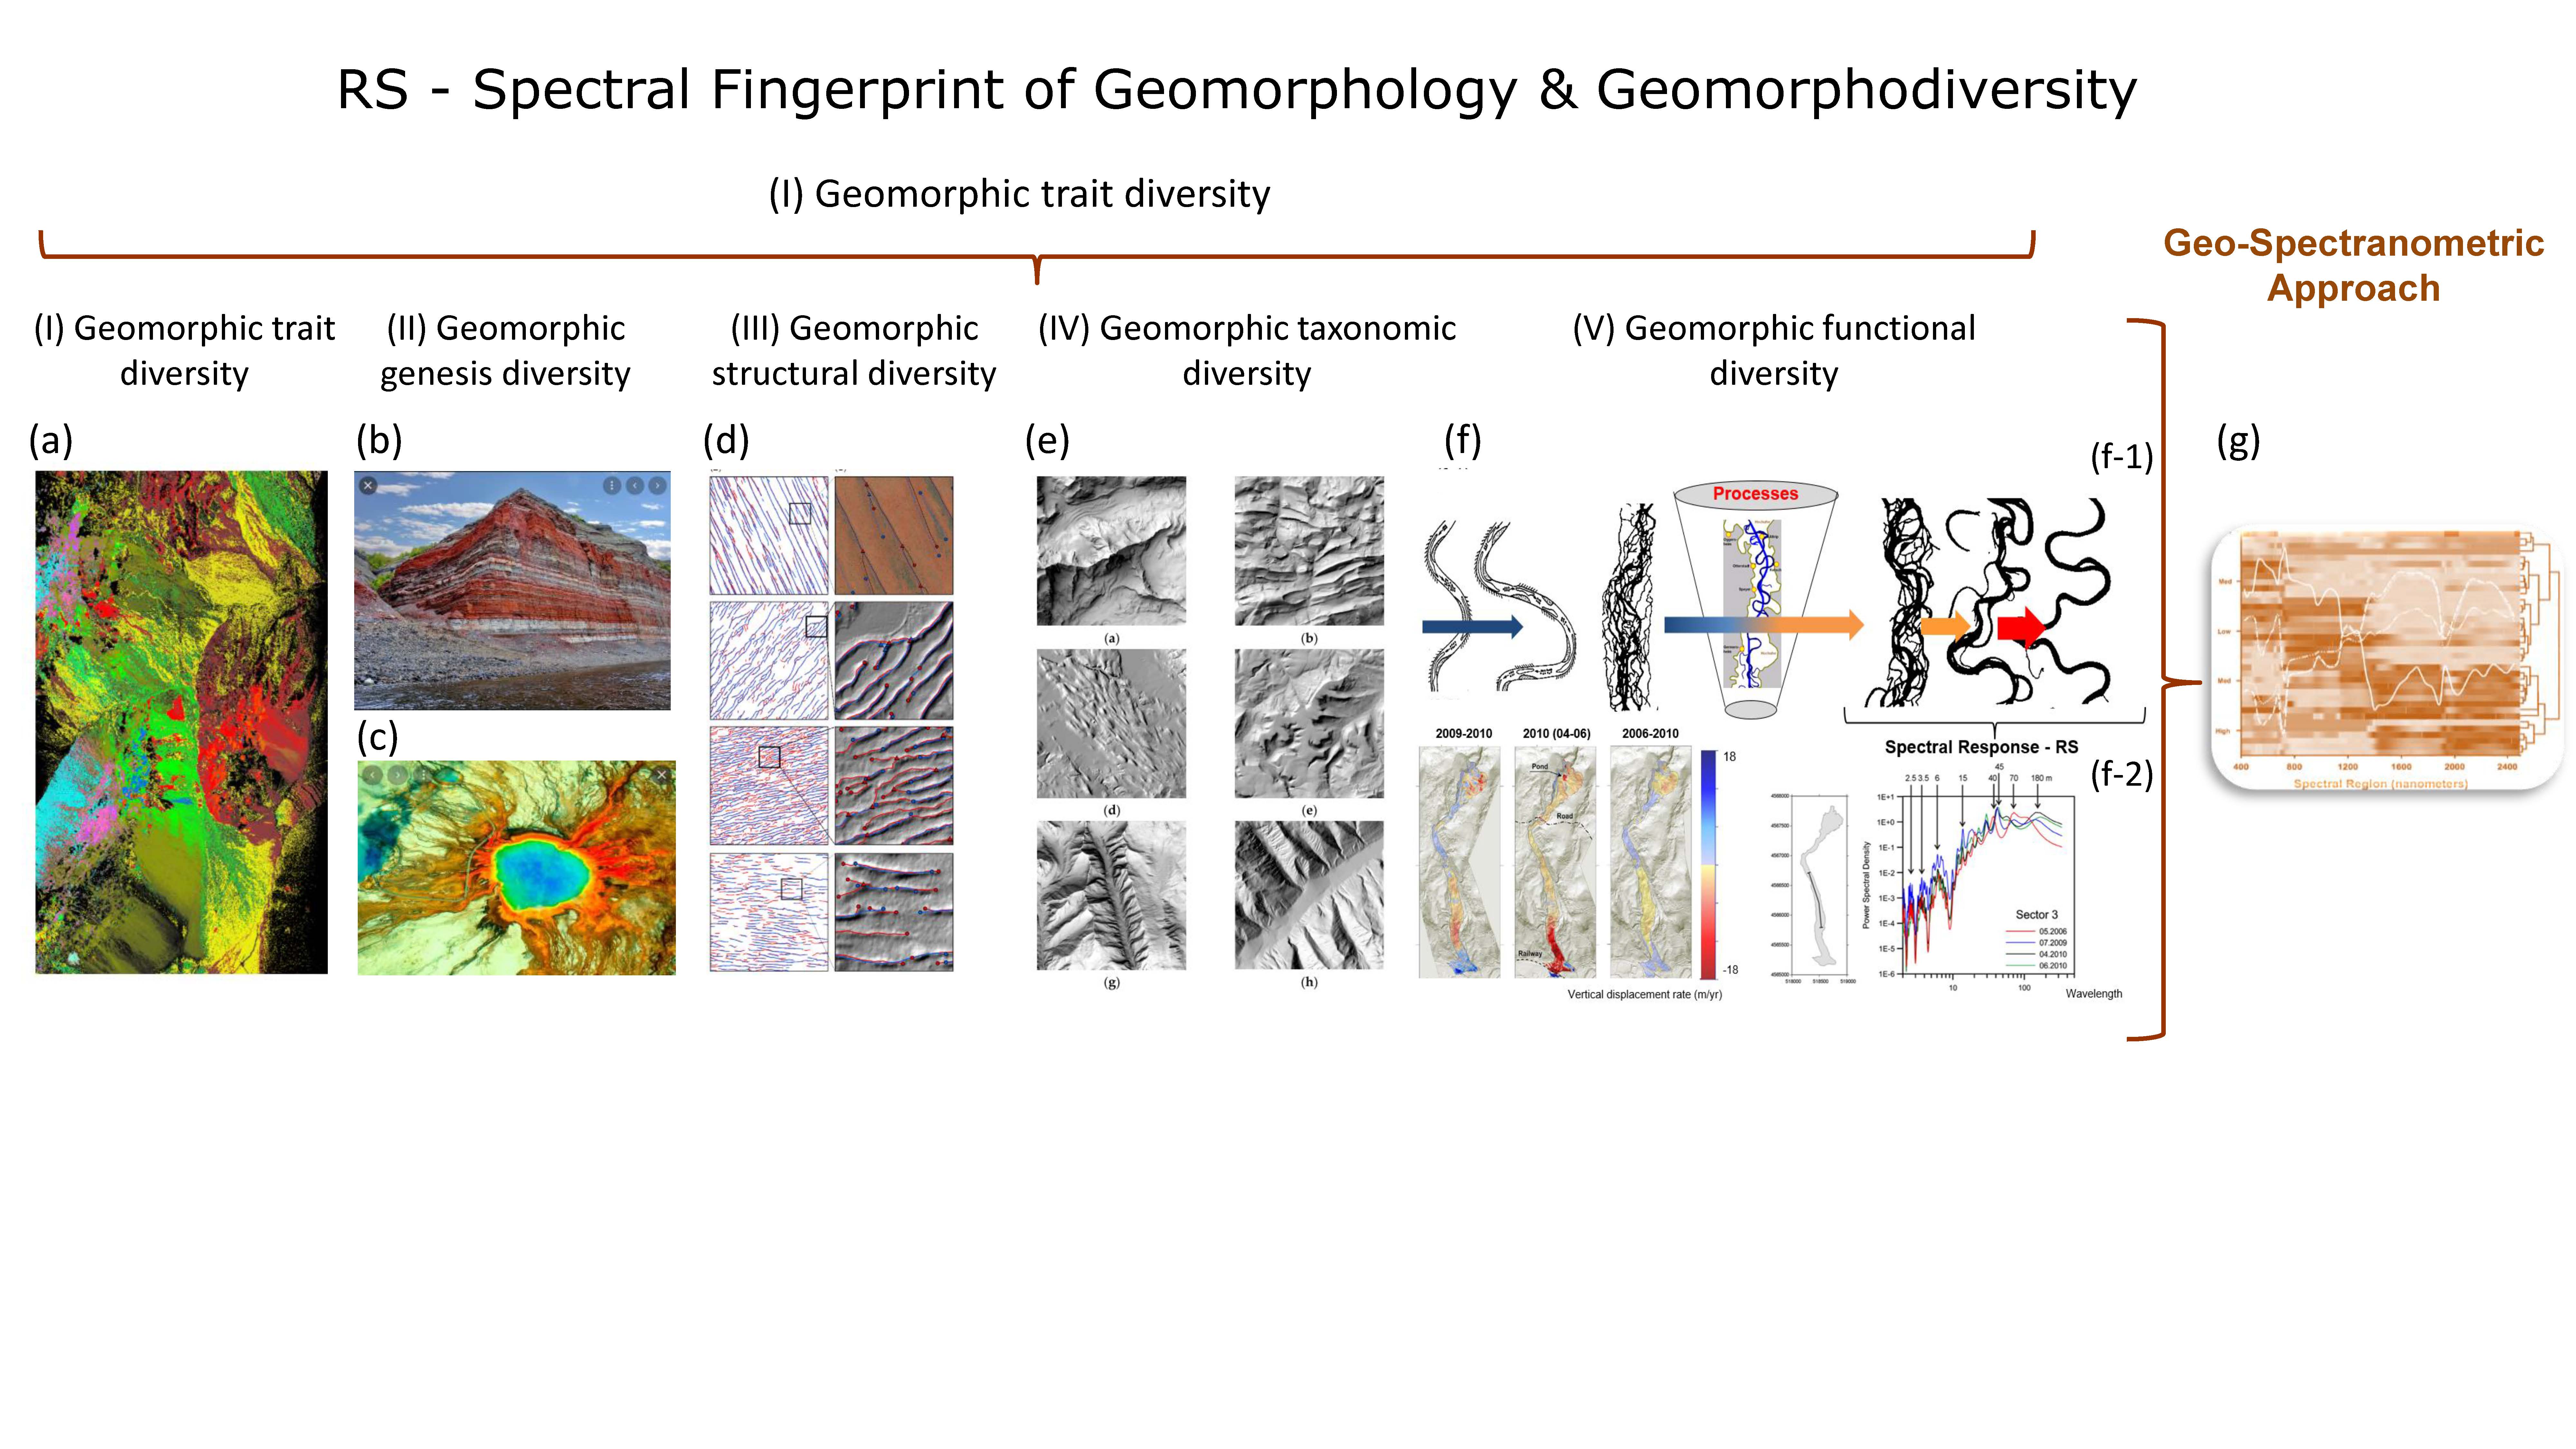 Figure 10. All five characteristics of geomorphodiversity can be recorded using RS technologies. The individual characteristics of geomorphodiversity are illustrated by means of examples, which are: (I) geomorphic trait diversity, (a) AVIRIS hyperspectral RS data was used to classify the mineral distribution and the geomorphic traits in the Cuprite area, Nevada (from Clark et al. [96]); (II) geomorphic genesis diversity, (b) photo of the characteristic relief forms created by the exogenous and endeogenous genesis processes genesis, (c) TIR image of part of the Siberian Trap supervolcano; (III) geomorphic structural diversity, (d) derivation of dune pattern mapping with RS (from Shumack et al. [97]); (IV) geomorphic taxonomic diversity, (e) classification of different mountain types using RS (from Farmakis-Serebryakova et al. [98]); (V) geomorphic functional diversity, (f-1) processes of geogenesis and river degradation lead to changes in morphometric river features, (f-2) the morphometric changes can be recorded using RS data, reprinted with permission from Ventura et al. [99], 2021, Elsevier. license number: 4856041399548; (g) The integration and combination of all five features form the basis of the geo-spectranometric approach and lead to the ‘spectral fingerprint of geomorphology and geomorphodiversity’. All features and individual figures are explained in detail in the following chapters.
3. Geomorphic Genesis Diversity Using RS
“Geomorphic genesis diversity represents the diversity of the length of evolutionary pathways, linked to a given set of geomorphic traits, taxa, structures, and functions. Therefore, sets of geomorphic traits, taxa, structures and functions that maximize the accumulation of geomorphic functional diversity are identified” [1]. The Siberian Trap and the Deccan Trap, also called the Deccan Large Igneous Province, are examples of geological volcanic eruptions that led to the formation of characteristic geomorphic genesis diversity [72]. As a result of the volcanic activity from 252 million years ago (the duration of the flood basalt event being ~900,000 years), extensive areas of flood basalt (with a total thickness of up to 6500 m) were formed in the Siberian Traps. The Sibierian Traps extend from the West and North Siberian Lowlands and the Central Siberian Highlands as well as to part of the Central Yakutian Lowlands, including the western slope of the East Siberian Highlands. The impacts of the eruptions produced up to ~2000 km³ of lava, leading to a large-scale distribution and volcanic deposit-covered area of ~7 million km2. Enormous releases of sulfur dioxide, methane, carbon dioxide, and large amounts of hydrogen sulfide from volcanic as well as organic (bacterial) sources [83], resulting in the formation of mountain structures such as the Putorana Mountains. Present-day deposits of silicon-rich migmatites, large amounts of volcanic tuffs, and pyroclastic deposits such as rhyolite, and metal-bearing rocks such as nickel, copper, and palladium are mined from extensive deposits today. The eruptions and their impacts are thought to be causally related to the mass extinction at the end of the Permian era. Thus, the toxic effects and extreme temperature increase of terrestrial and marine areas by 8 to 10 °C led to the collapse of many ecosystems and the emergence of new forest habitats, which only repopulated larger areas after about 15 million years. In contrast to the ammonites, conodonts, and foraminifera (with a regeneration time of 1 to 3 million years), the damaged coral reefs needed some 8 to 10 million years for complete regeneration. RS has added a new dimension to the monitoring of geomorphic genesis diversity, its characteristics, consequences, disturbances, and biodiversity. RS can describe genesis traits (minerals, rock types), taxa (mountain types) structures (genesis patterns, lineaments), and functions (run-off behavior), which represent geological tectonic architecture and its features [94]. Detailed structural and pattern analyses using RS technologies help to interpret, classify, discriminate and, thus, identify the genesis of various structures and patterns in the Siberian and Deccan Traps [72]. Thus, RS-based lineament analyses are crucial key elements for interpreting local, regional, and continental geogenetic structures [105]. Any naturally formed linear feature on the Earth’s surface that is related by the processes of extension, compression, strike-slip, or as a result of the magmatic or metamorphic activity, is called a lineament [72]. There are various geotaxonomic forms of lineaments, including rock types, linear sinkholes, fault-related traps, fold hinges, faults, shear zones, dykes, mineralized veins, uplifted topography, or contacts between elongated fractures or fault-bound elongated valleys [105][116]. In addition to lineaments, terrain patterns or fluvial drainage patterns provide important clues about the causes, trends, and nature of subsurface structures that cannot be detected with RS [105]. Drainage patterns in flat terrain are usually dendritic; however, in a dome or mountain structure, drainage patterns are radial and concentric [6]. Orthogonal, barbed, and double-drainage or compressed meanders are other examples of drainage patterns that control the course of water movement through their structure [72][105][127]. If lineaments, their patterns, or substructures are not directly visible and cannot be recorded using RS techniques, then, vegetation traits or plant functional types [128][139] or land-use anomalies and groundwater patterns [1410], or the delineation of shallow Deccan basaltic aquifers using aerial photointerpretation [1511], or channel widths, landslides, faults, or high-spatial-resolution Google Earth imagery in the study of Earth surface processes [1612] can be used directly or as a proxy for geomorphic genesis diversity.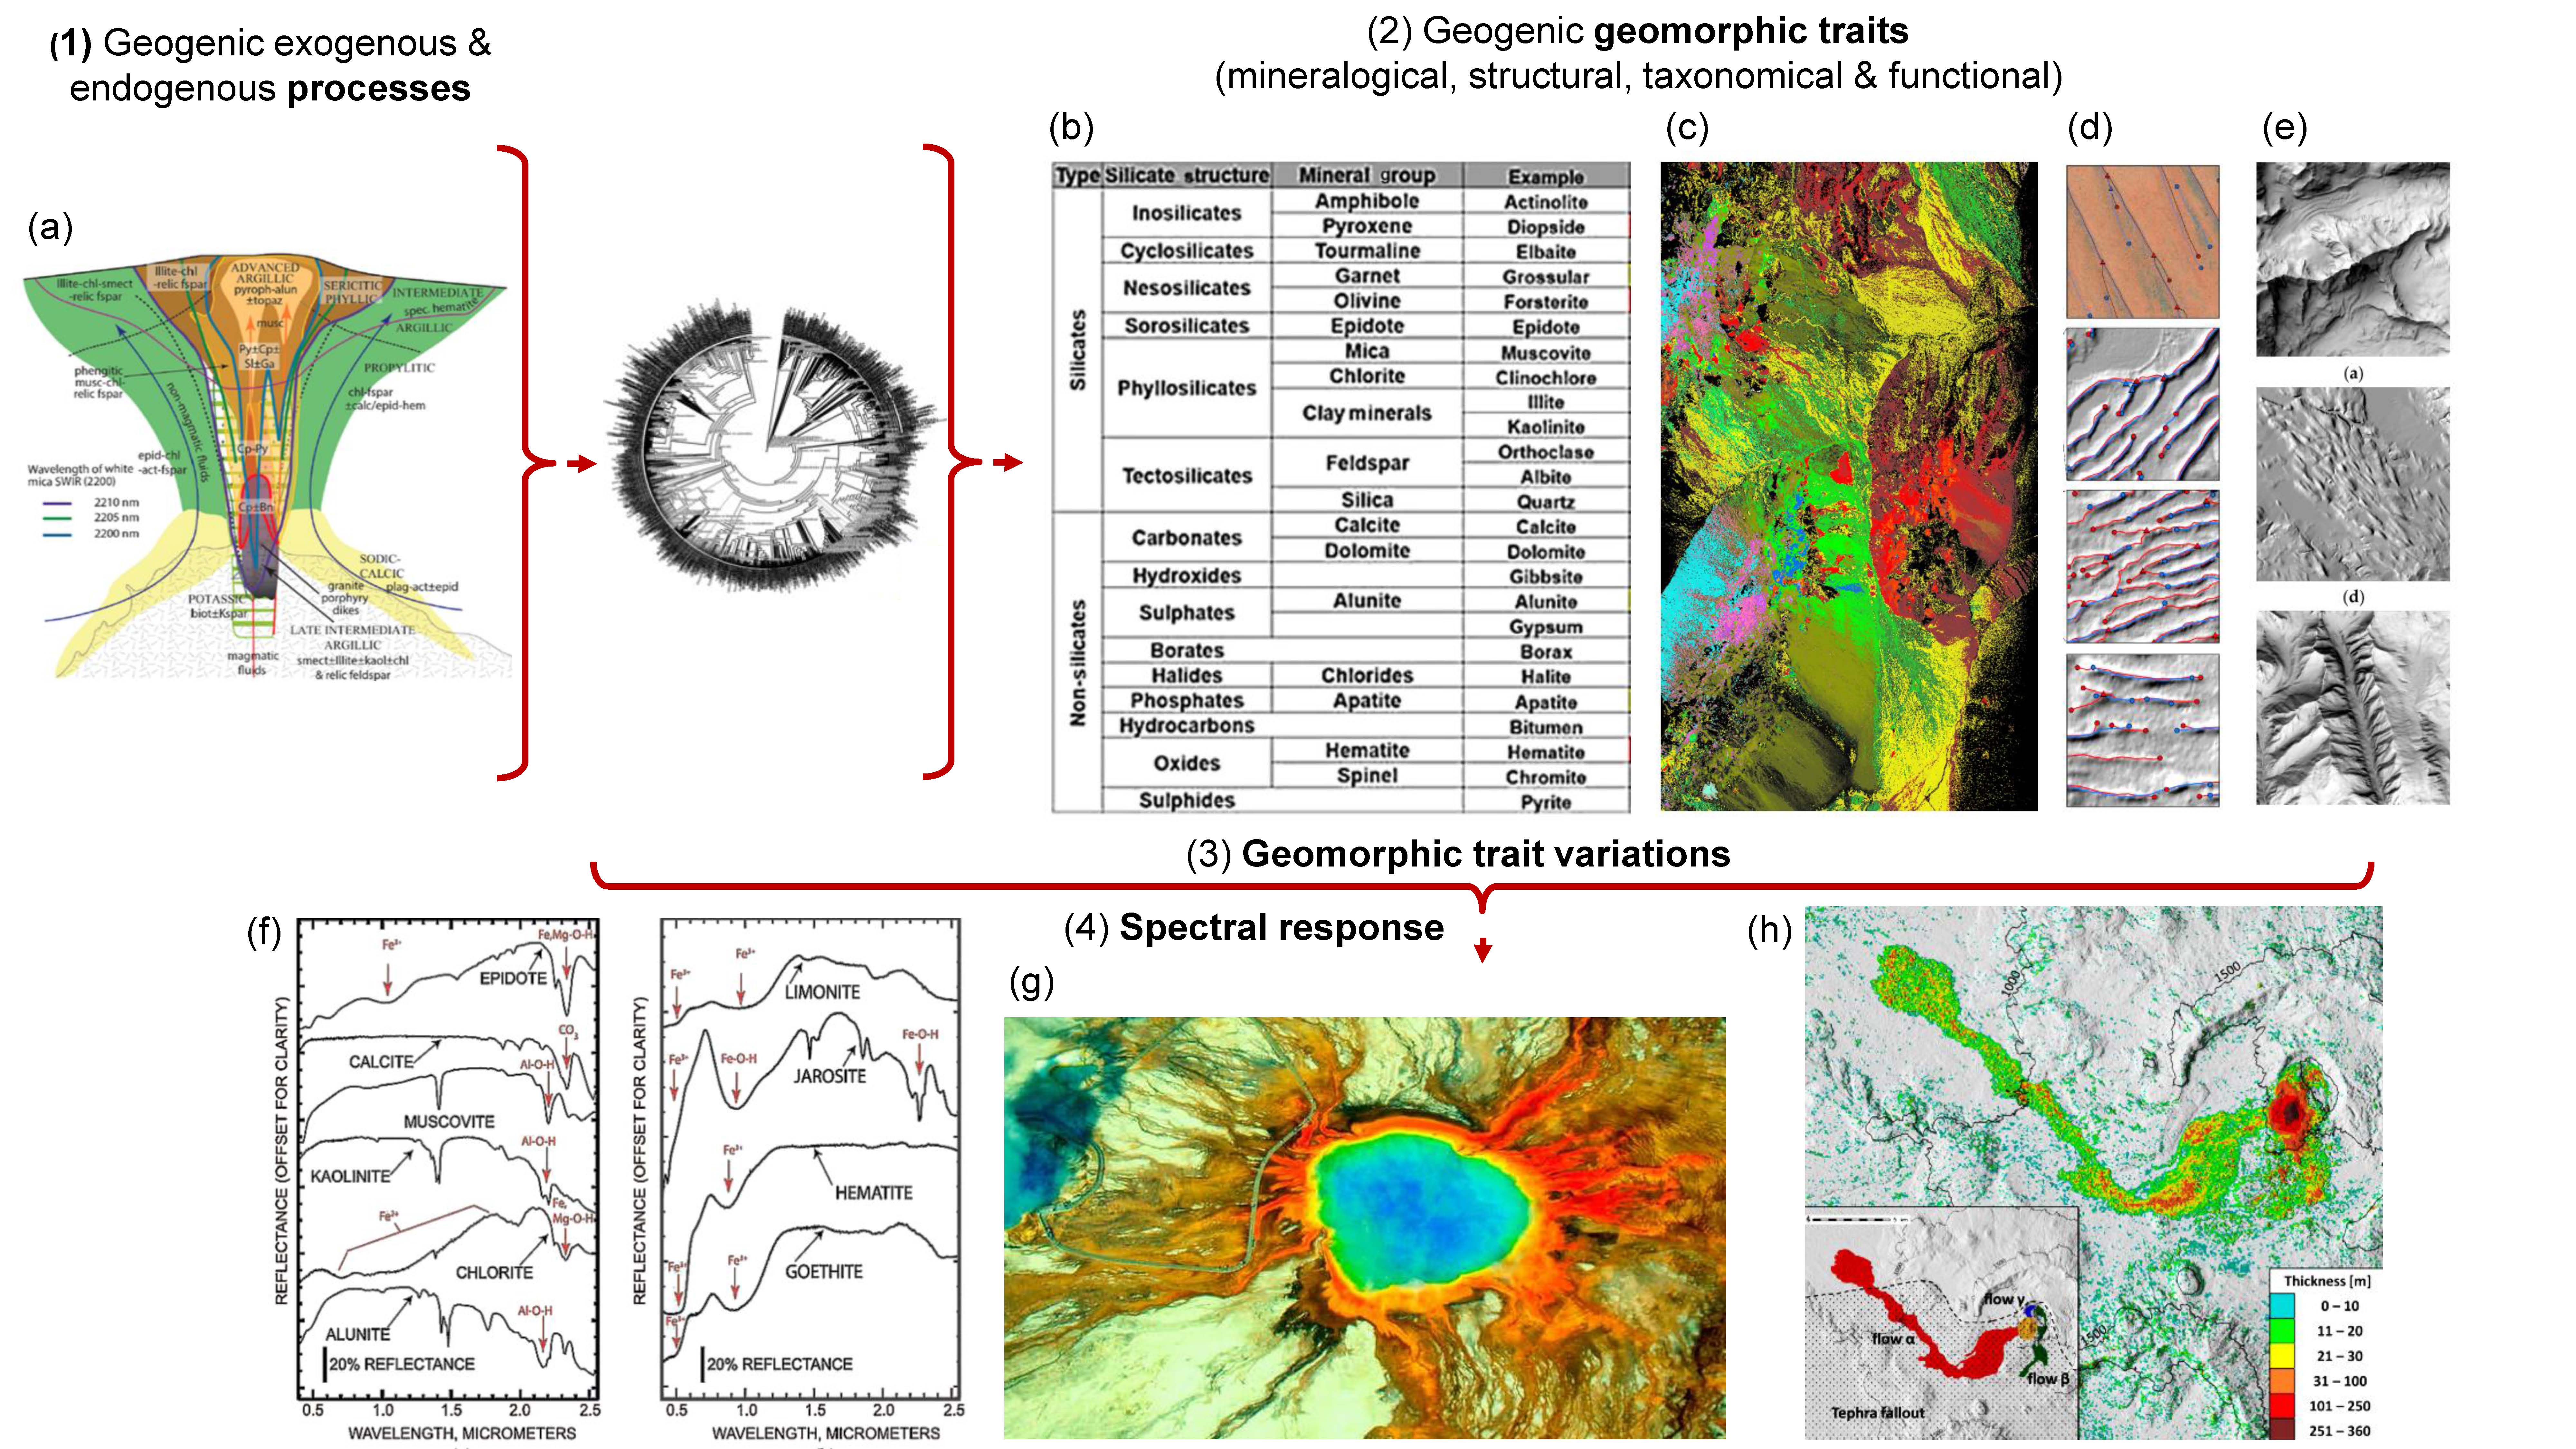 Figure 11. (1) Geogenic exogenous and endogenous processes, such as in such as a volcanic eruption (a) leads to characteristic geogenic geomorphic traits. (2) Geomorphic traits can be: mineralogical, structural, taxonomic and functional traits, such as: (b,c) different minerals, (d) different sturcural forms and form complexes, (e) different rock types. Consequently, the processes, e.g., volcanic eruptions lead to (3) geomorphic trait variations and the shaping of terrain and mountains. Geomorphic traits and trait variations produce a morphologogically specific (4) spectral response, which can be detected using different RS technologies. (f) Laboratory spectral features of different hydrothermal minerals and mapping results from RS analysis are crucial for mineral classification, (c) VNIR-AVIRIS hyperspectral data from the Cuprite area (Nevada) show results of lithography classification using hyperspectral RS data, (g) Representation of a volcanic eruption using RS of the Siberian Trap, (h) Distribution of volcanic deposits optained by differencing pre-eruptive and post-eruptive DEMs derived from ASTER and PlanetScope RS Data, location—Nabro volcano; Image sources: (a,b) from Peyghambari and Zhang [108], (c,f) from Clark et al. [96], (d) from Shumak et al., [97], (e) from Farmakis-Serebryakova et al. [98], (h) reprinted with permission from Calvari et al., [109], 2022, Elsevier. license number: 5303110916041.
4. Geomorphic Structural Diversity Using RS
“Geomorphic structural diversity is the diversity of composition and configuration of 2D to 4D geomorphic structural traits” [1]. Exogenous and endogenous processes are responsible for generating relief and form, leading to the development, structuring, and shaping of our Earth’s crust and entire ecosystems. Geomorphometry, geomorphic structure, patterns, diversity, relief, and topography are all crucial for the functionality, feedback, and resilience of geomorphology and the biota controlling the Earth’s surface processes and landforms [1913][2014][2115]. Spatial-temporal heterogeneity and evolutionary geomorphological structures and patterns lead to plant and animal species diversity and gradients in ecosystems, increasing the niche dimensionality of species and consequently supporting species richness and biodiversity [2216] [2317]. The 2–3D structures and sculpture forms, patterns, and communities enable essential conclusions to be drawn about the relief, structure, rock, and soil-formation processes during genesis. The diversity of geomorphic structures, patterns, and forms provides not only crucial information about the type and origin of the process but also its characteristics, such as the scope, length, intensity, consistency, dominance, and overlay of the process. Further more, spatial-temporal geomorphic patterns can equally be used to describe the degree of naturalness or anthropogenic influence or degree of human influence (hemeroby) [2418][2519] on geomorphology and landforms. Through land use intensity (LUI) and urbanization, ponst-mining landscapes, forestry intensification or river regulation evolutionary geomorphic structures and shape patterns are altered and, in some cases, are so heavily overprinted that the original evolutionary structures are now challenging to monitor. Numerous examples of geomorphic imprinting define the terrain of our present-day cultural landscape, such as buildings, cities, streets, terraces, boundary walls, brownfields, ditches, canals, reservoirs, or restored wetlands. The characteristics of geomorphic structures are, therefore, crucial fingerprints of human influence [2620]. For this reason, geomorphic structural diversity is an important indicator for measuring and assessing inferences regarding the state, changes, and the origin, type, and intensity of human influence. . Geomorphic structures and patterns are crucial for the discrimination of geomorphic taxa and, thus, the characterization of geomorphic taxonomic diversity using RS. Structural diversity exists on all levels of a geomorphic organization. Therefore, structural geomorphic traits can be recorded by different RS platforms and, thus, on all spatial-temporal and directional scales of geomorphology. To successfully record and monitor structural diversity and its traits, the spatial, spectral, radiometric, angular, and temporal characteristics of the RS sensors play a significant role. Moreover, the distribution, density, and composition, as well as the configuration of structural traits, also play a major role here. Examples are the structures of fluvial landforms such as channel characteristics, floodplain morphology hydraulic channel morphology, geometries, topography, river width arc length, longitudinal transect or channel slope, or below waterline morphology. Morphometric patterns can be recorded with high-resolution LiDAR technologies, whereas optical RS approaches are doomed to fail with a spatial resolution of only 20 cm. The choice of sensor technologies and characteristics is crucial to capture the exact geomorphological structure, such as topography. This will determine the model quality and, consequently, the quality of the prediction of disturbance effects in landscapes. Thus, ecological and hydrological model predictions are only as good as the quality of the input data that are collected by RS [1]. For example, by capturing the detailed terrain structures of coastal regions through airborne LiDAR data, it has been demonstrated that more than three times as many people are at risk from climate change and rising sea levels than was previously calculated from less detailed shuttle radar topography (SRTM)-DEM-RS data [2721].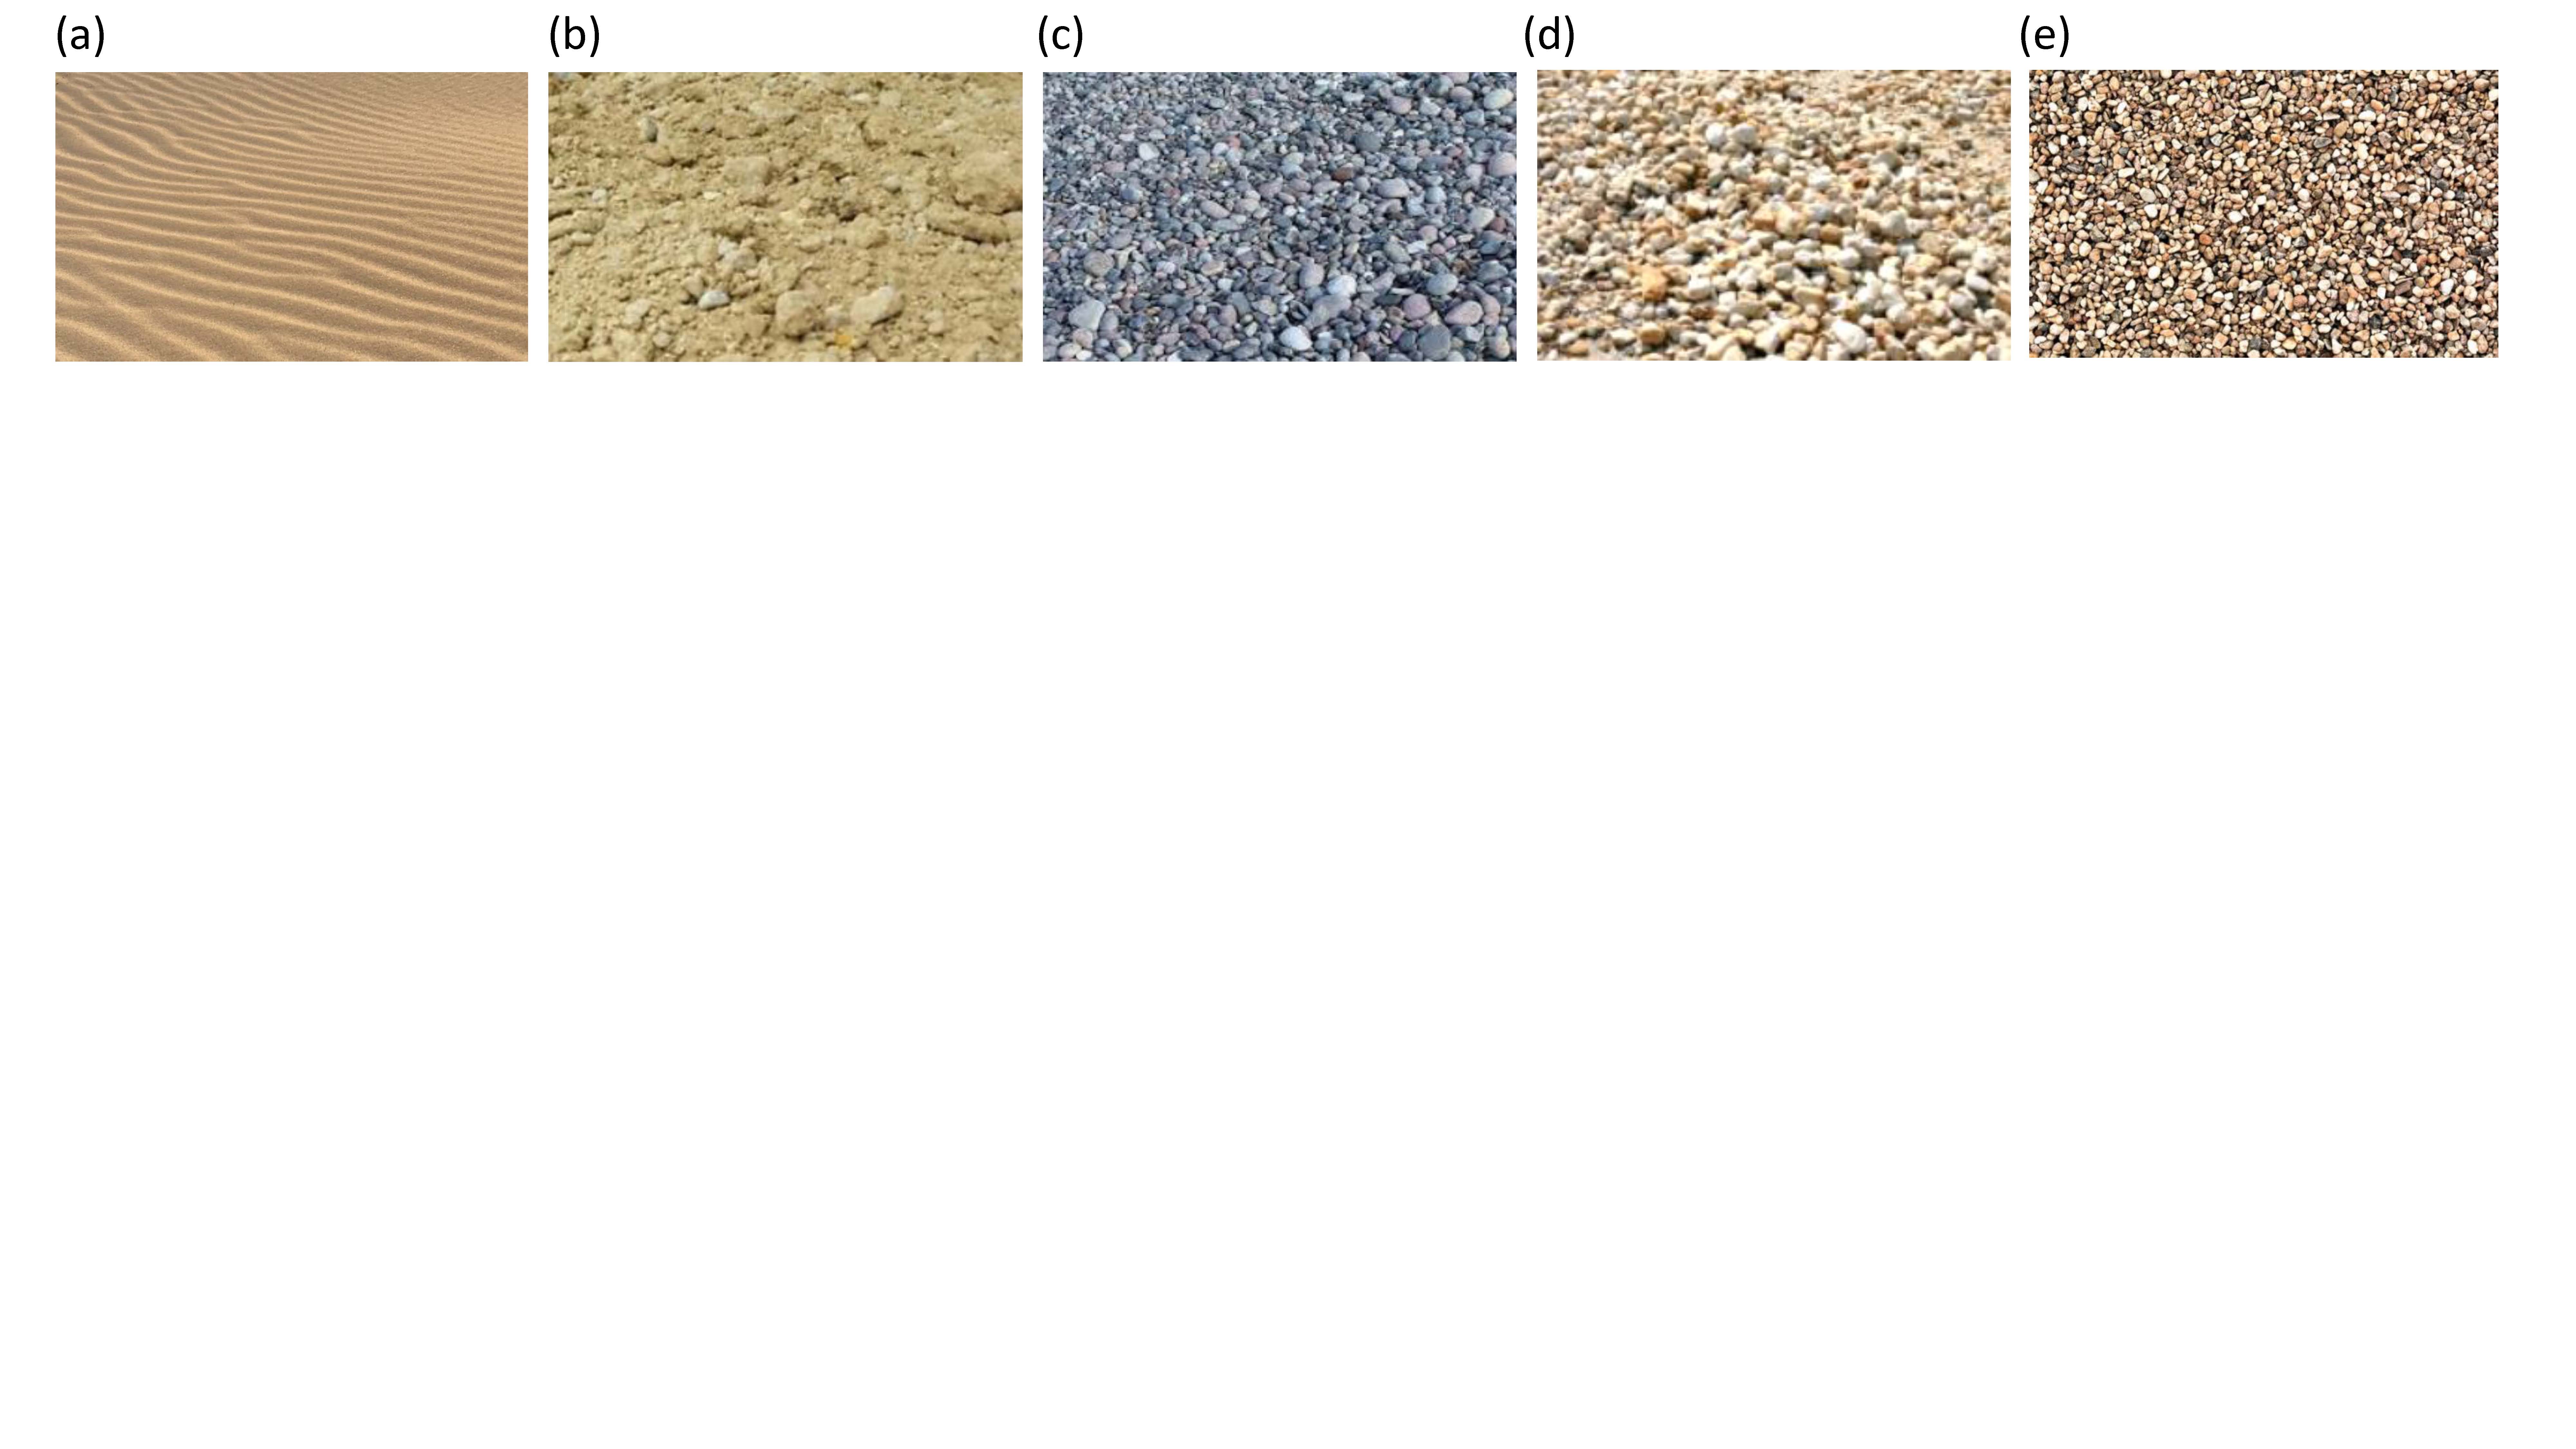 Figure 12. Geomorphic structural diversity, monitored with remote sensing technology. Examples of dune-field landscape patterns on remotely sensed data. (a) Barchan dunes, (b) linear dunes, (c) dome dunes, (d) reticulate dunes, and (e) longitudinal dunes (reprinted with permission from Zeng et al. [117], 2021, Elsevier. license no. 5176660806321).
5. Geomorphic Taxonomic Diversity Using RS
“Geomorphic taxonomic diversity is the diversity of geomorphic components that differ from a taxonomic perspective” [1]. Different evolutionary processes (geogenesis), such as plate tectonics, mountain building, or volcanism are described by the numerous geomorphic taxa (also referred to as types, classes, or units) of mountains, reliefs, volcanoes, channels, rocks, and landforms, leading to the development of different geomorphic taxa with specific geochemical, mineralogical, and structural properties, forms, and shape classes. This taxonomic diversity, heterogeneity, and richness of different geomorphic types (mountains, dunes, coast, or dune types) define the state, stability, and resilience of the entire geosphere and biosphere, as they induce a high diversity of ecosystem processes, functions, forms, and types of structures, ultimately forming ecological niches. Different geomorphic types (taxa) vary in terms of their different geomorphic traits, in their geogenesis, structure, and function. For example, the production of volcanic lavas, solids, and gases shapes various characteristic volcanic forms. In addition, there are differentiating properties of the resulting volcanic products, such as gaseous, viscous, or low viscosity to solid properties. Likewise, the character of the production of different volcanoes differs, e.g., from explosive to effusive. Cinder volcanoes, for example, were formed from loose material and have a characteristic cone shape with a slope of 30–40°, leading to the formation of the distinctive concave slope shape. Furthermore, volcanic ash created the vast grass-covered savannah areas of the Serengeti, preventing the invasion and development of forest communities. However, anthropogenic changes, such as land-use intensity, agricultural expansion, urbanization, climate change, or resource extraction have influenced, shaped, and defined a variety of landforms and geomorphic types for thousands of years [2922]. This has led to changes in evolutionary types and the formation of distinctive anthropogenic-geomorphic types with strong anthropogenic features such as reservoirs, embankments, canals, mines, terraces or roads, buildings, and cities [2620]. The expression of geomorphic characteristics and types present today, thus, range from “purely evolutionary types” to “strongly anthropogenic-geomorphic-dominated types”, which demands special recording and assessment procedures. Anthropogenic geomorphic features, such as linear structures, river straightening, and the characteristic structures of terraces or mines can now be used to monitor the degree of human influence and to improve the discrimination and classification of geomorphic types. RS techniques can capture traits in geomorphology [1] , soil characteristics [223], and the responses of above- and belowground diversity [3024] as well as biodiversity [148][9], depending on their RS characteristics. Many RS technologies are being used to detect human impacts and changes in the geomorphic taxa through LUI, using spectral image analysis—such as the monitoring of river degradation, terrain creation [2620], and coastal structure changes with LiDAR [2721] , or urbanization (cities and roads) using multispectral, LiDAR or RADAR technologies [2620].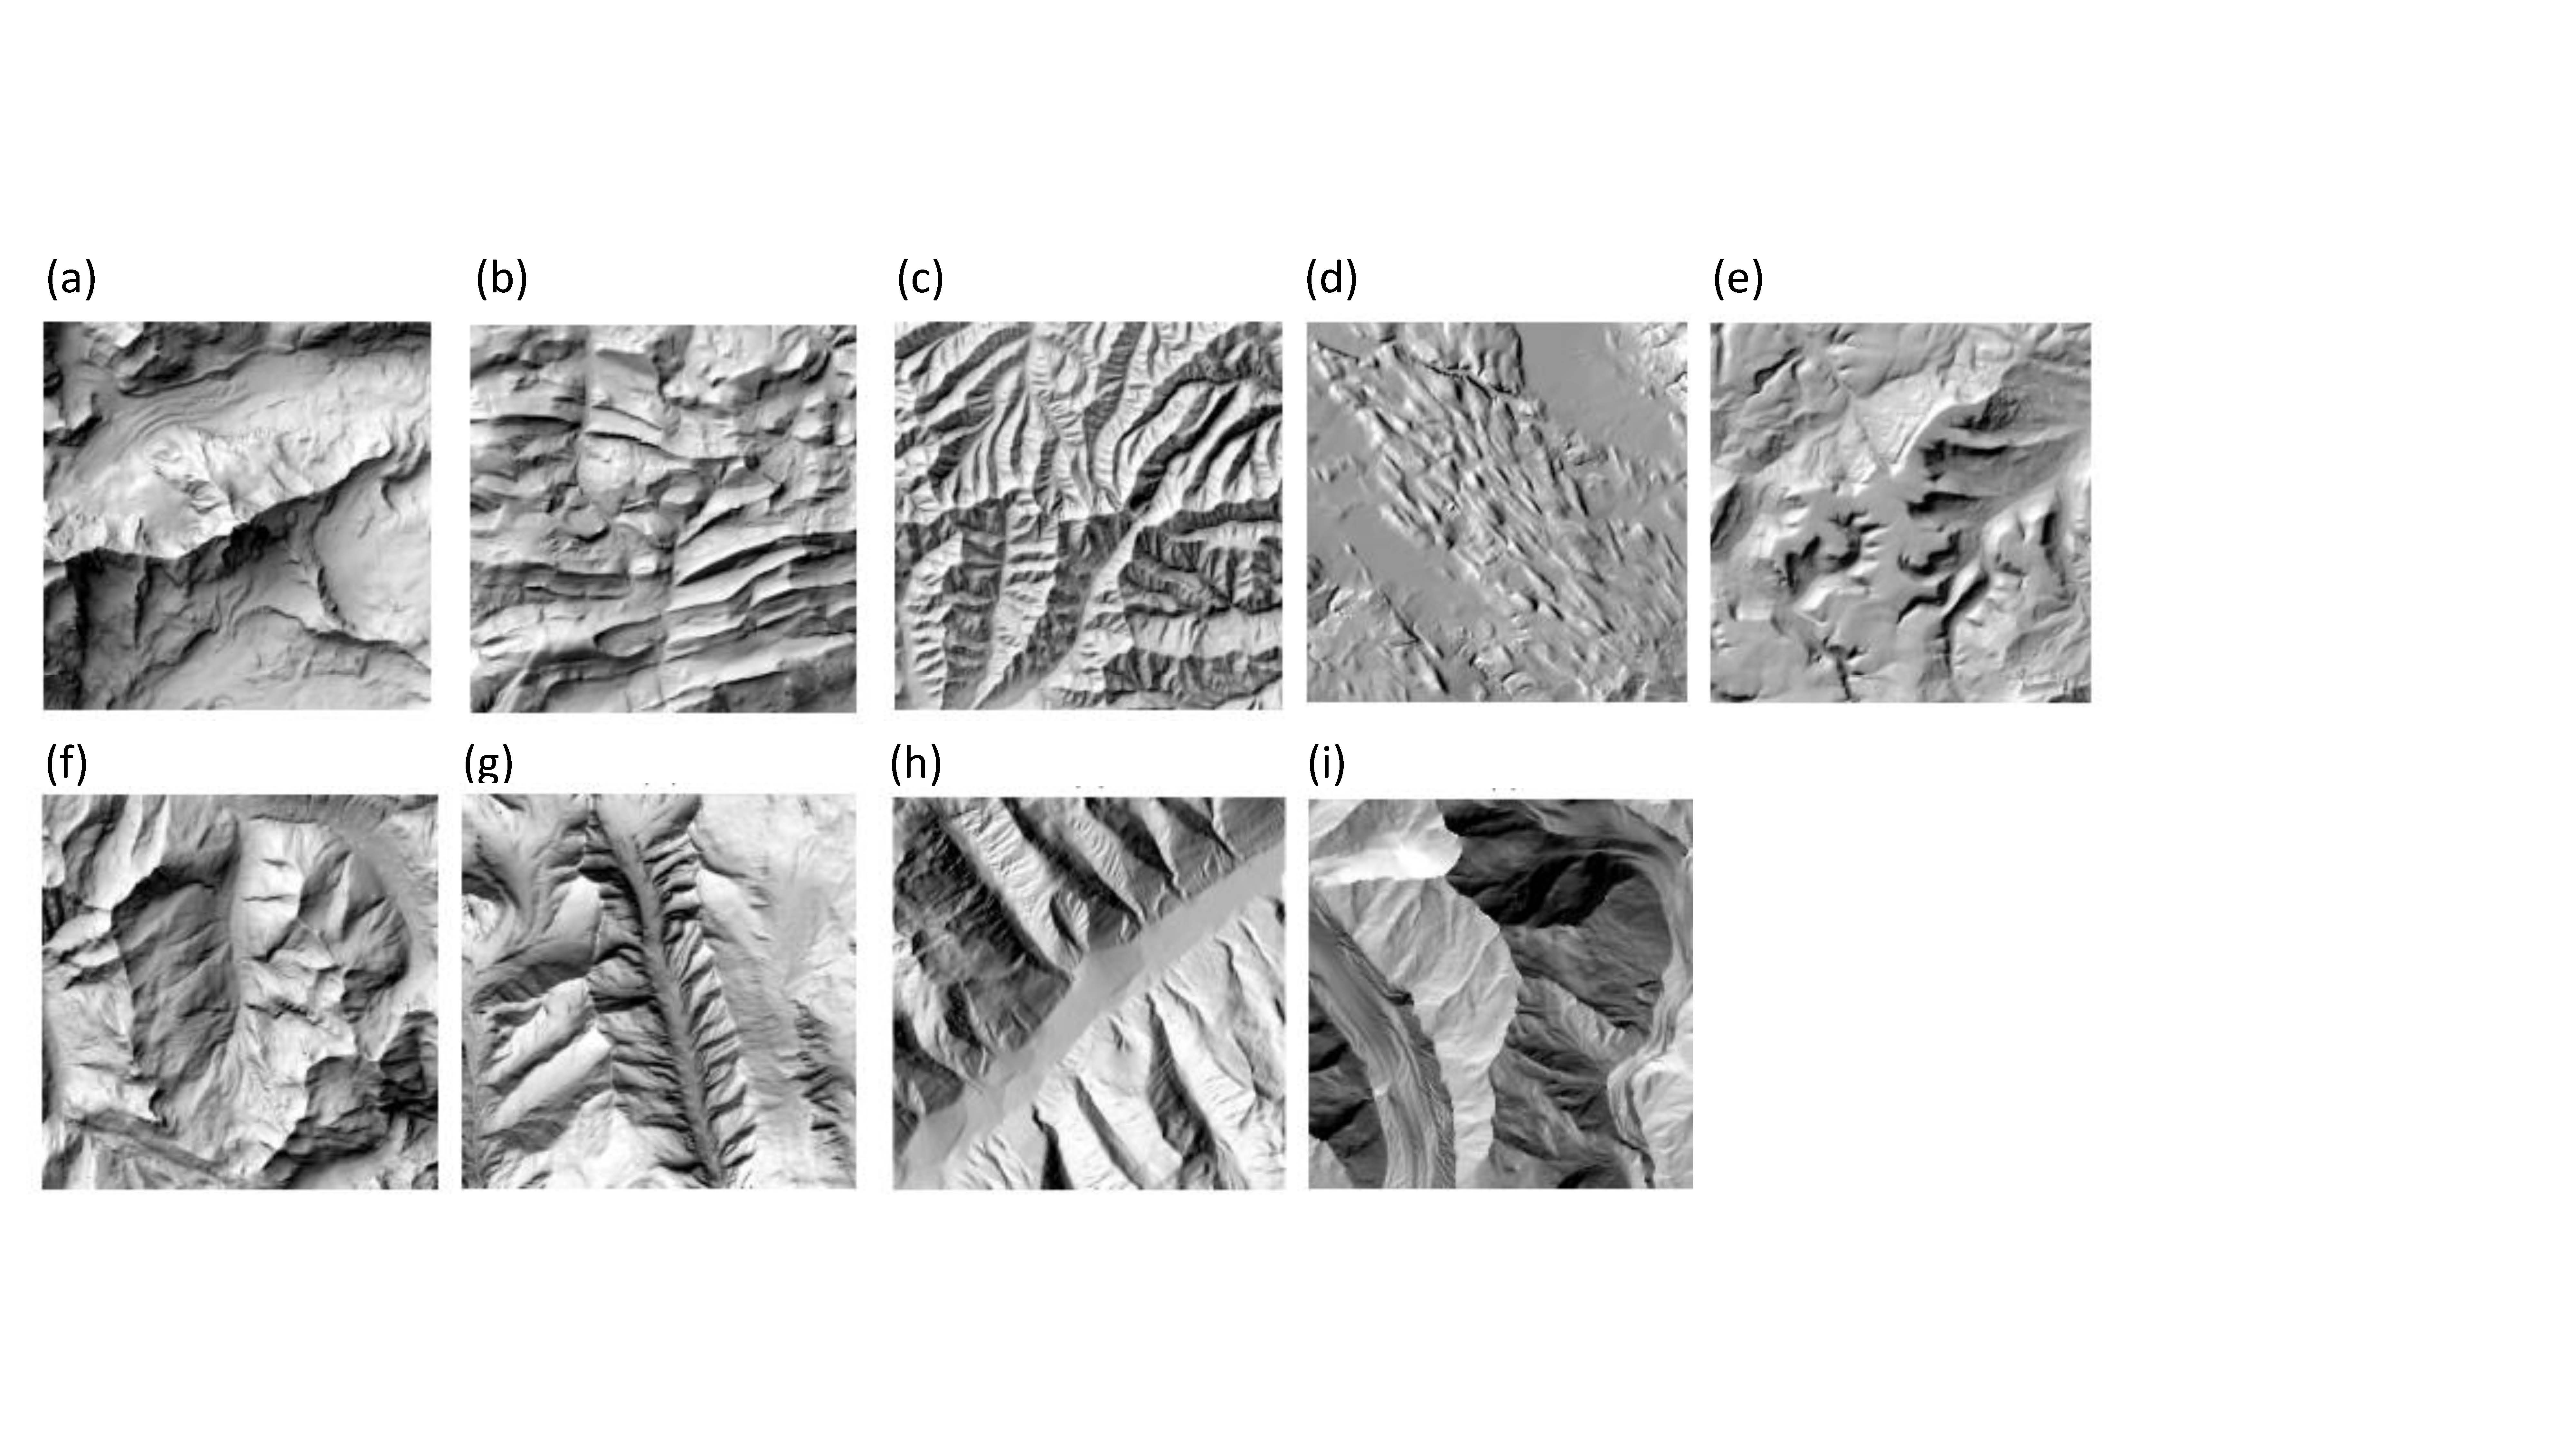 Figure 13. Geomorphic taxonomic diversity using RS. The most suitable relief shading methods per landform based on the survey results: the clear sky model method for (a) block mountains; (b) folded mountains; (c) mountains formed by erosion processes; (d) cluster shading for drumlins; (e) plateaus; and (f) V-shaped valleys; (g) clear sky model with custom illumination (here, S) for U-shaped valleys; (h) standard hill-shading with custom illumination (here, W) for alluvial fans; and (i) aspect shading for glaciers (from Farmakis-Serebryakova et al. [98]).
6. Geomorphic Functional Diversity Using RS
“Geomorphic functional diversity is the diversity of geomorphic functions and processes as well as their intra- and inter-specific interactions” [1]. Through anthropogenic impacts, such as urbanization, land-use intensity, and river straightening, the 19th to the 21th centuries increasingly witnessed irreversible changes and disturbances to the natural geomorphology, leading to considerable disturbances in the functionality and resilience of geosystems. Using the example of river straightening, we briefly discuss the basic reasons why RS can record genesis and structural and functional changes. Rivers adapt their path according to the temporal variations of their outflow. Hence, during geogenesis, meanders emerged due to convergent and divergent flow movements that were transverse to the general direction of flow. The number of factors influencing the formation of meanders can still not be fully explained today. However, it is understood that the meanders of a river are the expression of a stable, dynamic balance between the river and the riverbed, creating characteristic fluvial biodiversity with high self-purification potential. The geometry of meanders, both cut-off meanders and oxbows, can greatly differ since meanders are subject to a permanent positional change. In the 19th century, flood prevention measures were undertaken on the Upper Rhine (a reduction in areas prone to flooding), to regulate low-water levels (e.g., for year-round shipping) as well as regulations to produce hydropower. The morphological impacts of these “corrective measures“ on the River Rhine in Germany altered the erosion and sediment behavior of the river. At the same time, the flow velocity increased, leading to strong vertical erosion of up to 7 m in the Rhine. As a result of this eroded material, sandbanks and gravel banks frequently formed, and these barrages acted as sediment traps, which meant that further measures were then required to regulate low-water levels [3125]. Hence, river regulations or barrages lead to changes in the genesis, structural and functional fluvial traits, subsequently leading to fluvial trait variations. The structural geomorphological changes in the original meandering or sediment displacement can now be recorded using RS approaches because these fluvial trait variations lead to spectral responses in the RS signal. In addition to structural changes, hyperspectral technologies (HySPEX, AISA, CHIME, or EnMAP) can be used to make statements about changes to vegetation diversity and water quality (increasing eutrophication, chlorophyll content, and turbidity); in other words, impacts from river straightening. There are numerous examples of monitoring topography and relief (DEM, DSM) using RS technologies.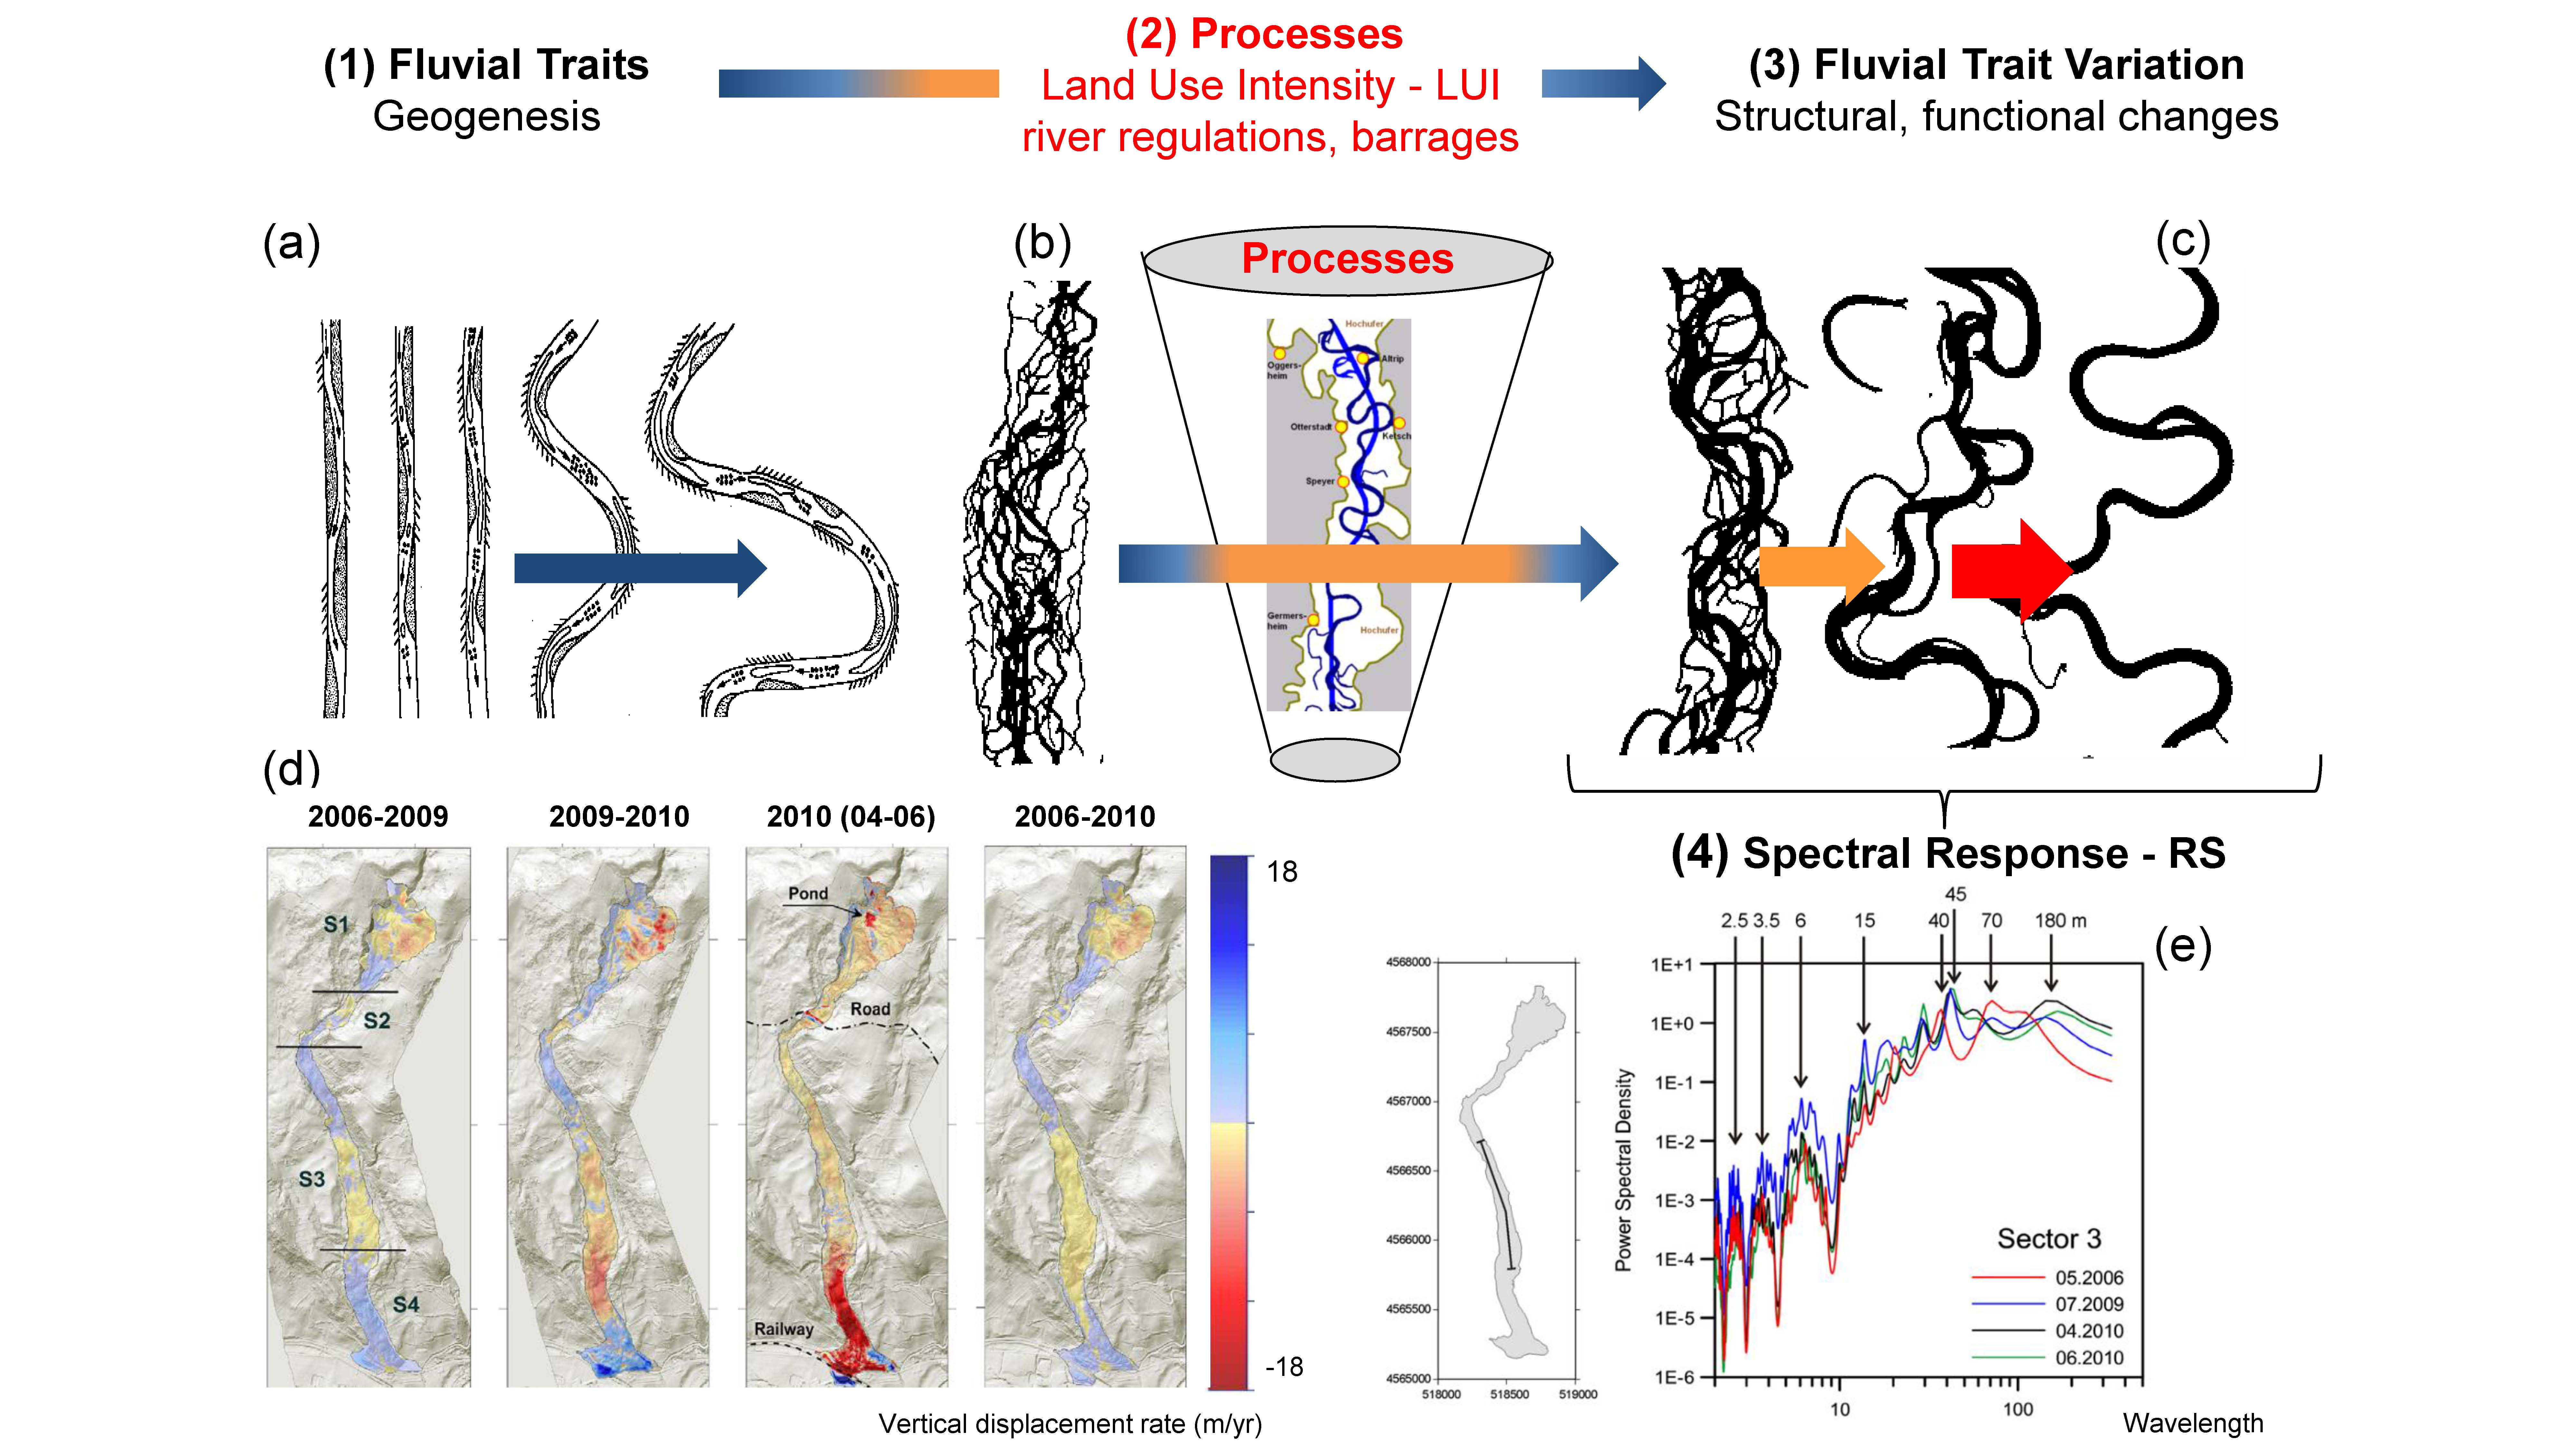 Figure 14. Monitoring status and changes to geomorphic characteristics with RS. (a) Different processes during geogenesis lead to the formation of specific morphometric fluvial traits—the meanders, (b) the entire river system is characterized by these meanders. (2) Processes/drivers such as land-useintensity, river regulations, or lead to (c) changes in structural, functional fluvial traits (fluvial trait variations) (d,e). These fluvial trait variations lead to spectral responses in the remote sensing signal (d). Example of monitoring temporal changes of fluvial traits—vertical displacement rate of the river system from 2006–2010 with remote sensing technologies (LiDAR) (d,e). From Ventura et al. [99], Reprinted with permission from Ventura et al. [99], 2021, Elsevier. license no. 4856041399548.
[1][2][3][4][5][6][7][8][9][10][11][12][13][14][15][16][17][18][19][20][21][22][23][24][25][26][27][28][29][30][31][15][32][33][34][35][36][37][38][39][40][41][42][15][43][44][45][15][46][47][48][49][50][51][52][53][54][55][56][57][58][15][59][60][61][62][63][64][65][66][67][68][69][70][71][72][73][74][75][76][77][78][79][80][81][82][83][84][85][86][87][88][89][90][91][92][93][94][95][96][97][98][99][100][101][102][103][104][105][106][107][108][109][110][111][112][113][114][115][116][117][118][119][120][15][121][122][123][124][125][126][127][128][129][130][131][132][133][134][135][136][137][138][139][140][141][142][143][144][145][146][147][148][149][150][151][152][153][154][155][156][157][158][159][160][161][162][163][164][165][166][167][168][169][170][171][172][173][174][175][176][177][178][179][15][180][181][182][183][184][185][186][187][188][189][190][191]
Figure 14. Monitoring status and changes to geomorphic characteristics with RS. (a) Different processes during geogenesis lead to the formation of specific morphometric fluvial traits—the meanders, (b) the entire river system is characterized by these meanders. (2) Processes/drivers such as land-useintensity, river regulations, or lead to (c) changes in structural, functional fluvial traits (fluvial trait variations) (d,e). These fluvial trait variations lead to spectral responses in the remote sensing signal (d). Example of monitoring temporal changes of fluvial traits—vertical displacement rate of the river system from 2006–2010 with remote sensing technologies (LiDAR) (d,e). From Ventura et al. [99], Reprinted with permission from Ventura et al. [99], 2021, Elsevier. license no. 4856041399548.
[1][2][3][4][5][6][7][8][9][10][11][12][13][14][15][16][17][18][19][20][21][22][23][24][25][26][27][28][29][30][31][15][32][33][34][35][36][37][38][39][40][41][42][15][43][44][45][15][46][47][48][49][50][51][52][53][54][55][56][57][58][15][59][60][61][62][63][64][65][66][67][68][69][70][71][72][73][74][75][76][77][78][79][80][81][82][83][84][85][86][87][88][89][90][91][92][93][94][95][96][97][98][99][100][101][102][103][104][105][106][107][108][109][110][111][112][113][114][115][116][117][118][119][120][15][121][122][123][124][125][126][127][128][129][130][131][132][133][134][135][136][137][138][139][140][141][142][143][144][145][146][147][148][149][150][151][152][153][154][155][156][157][158][159][160][161][162][163][164][165][166][167][168][169][170][171][172][173][174][175][176][177][178][179][15][180][181][182][183][184][185][186][187][188][189][190][191]
References
- Lausch, A.; Schaepman, M.E.; Skidmore, A.K.; Truckenbrodt, S.C.; Hacker, J.M.; Baade, J.; Bannehr, L.; Borg, E.; Bumberger, J.; Dietrich, P.; et al. Linking the Remote Sensing of Geodiversity and Traits Relevant to Biodiversity—Part II: Geomorphology, Terrain and Surfaces. Remote Sens. 2020, 12, 3690. [CrossRef]Strahler, A.N. Quantitative analysis of watershed geomorphology. Trans. Am. Geophys. Union 1957, 38, 913. [CrossRef]
- Lausch, A.; Baade, J.; Bannehr, L.; Borg, E.; Bumberger, J.; Chabrilliat, S.; Dietrich, P.; Gerighausen, H.; Glässer, C.; Hacker, J.; et al. Linking Remote Sensing and Geodiversity and Their Traits Relevant to Biodiversity—Part I: Soil Characteristics. Remote Sens. 2019, 11, 2356.Piégay, H. Quantitative Geomorphology. In International Encyclopedia of Geography; John Wiley and Sons: Hoboken, NJ, USA, 2019;
- Clark, R.N.; Swayze, G.A.; Livo, K.E.; Kokaly, R.F.; Sutley, S.J.; Dalton, J.B.; McDougal, R.R.; Gent, C.A. Imaging spectroscopy: Earth and planetary remote sensing with the USGS Tetracorder and expert systems. J. Geophys. Res. Planets 2003, 108, 5.pp. 1–4. ISBN 9781118786352.
- Shumack, S.; Hesse, P.; Farebrother,W. Deep learning for dune pattern mapping with the AW3D30 global surface model. Earth Surf. Process. Landf. 2020, 45, 2417–2431.Sofia, G. Combining geomorphometry, feature extraction techniques and Earth-surface processes research: The way forward.
- Farmakis-Serebryakova, M.; Hurni, L. Comparison of Relief Shading Techniques Applied to Landforms. ISPRS Int. J. Geo.-Inf. 2020, 9, 253.Geomorphology 2020, 355, 107055. [CrossRef]
- Ventura, G.; Vilardo, G.; Terranova, C.; Sessa, E.B. Tracking and evolution of complex active landslides by multi-temporal airborne LiDAR data: The Montaguto landslide (Southern Italy). Remote Sens. Environ. 2011, 115, 3237–3248.Dubois, J.-M.M. Functional geomorphology: Landform analysis and models. Geomorphology 1994, 9, 344–345. [CrossRef]
- Dasgupta, S.; Mukherjee, S. Remote Sensing in Lineament Identification: Examples from Western India. In Problems and Solutions in Structural Geology and Tectonics; Elsevier Inc.: Amsterdam, The Netherlands, 2019; Volume 5, pp. 205–221. ISBN 9780128140482Hall, M.R.; Lindsay, R.; Krayenhoff, M. Modern Earth Buildings; Woodhead Publishing Limited: Sawston, UK, 2012;
- Dasgupta, S.; Mukherjee, S. Remote Sensing in Lineament Identification: Examples from Western India. In Problems and Solutions in Structural Geology and Tectonics; Elsevier Inc.: Amsterdam, The Netherlands, 2019; Volume 5, pp. 205–221. ISBN 9780128140482.ISBN 978-0-85709-026-3.
- Mather, T.A.; Schmidt, A. Environmental Effects of Volcanic Volatile Fluxes from Subaerial Large Igneous Provinces, 1st ed.; GeophysicalMonograph 255; Ernst, R.E., Dickson, A.J., Bekker, A., Eds.; Wiley Online Library: Hoboken, NJ, USA, 2021; ISBN 9781119507444.Gray, M. Geodiversity: A significant, multi-faceted and evolving, geoscientific paradigm rather than a redundant term. Proc. Geol.
- Dasgupta, S.; Mukherjee, S. Remote Sensing in Lineament Identification: Examples fromWestern India. J. Dev. Struct. Geol. Tecton. 2019, 15, 205–221.Assoc. 2021, 132, 605–619. [CrossRef]
- Prost, G.L. Remote Sensing for Geoscientists; T & F Group, Ed.; CRC Press: Boca Raton, FL, USA; London, UK; New York, NY, USA, 2013; ISBN 9781466561755.Lausch, A.; Schaepman, M.E.; Skidmore, A.K.; Truckenbrodt, S.C.; Hacker, J.M.; Baade, J.; Bannehr, L.; Borg, E.; Bumberger, J.;
- Gupta, R.P. Remote Sensing Geology; Springer: Berlin/Heidelberg, Germany, 2018; ISBN 978-3-662-55874-4.Dietrich, P.; et al. Linking the Remote Sensing of Geodiversity and Traits Relevant to Biodiversity—Part II: Geomorphology,
- Lausch, A.; Bannehr, L.; Beckmann, M.; Boehm, C.; Feilhauer, H.; Hacker, J.M.; Heurich, M.; Jung, A.; Klenke, R.; Neumann, C.; et al. Linking Earth Observation and taxonomic, structural and functional biodiversity: Local to ecosystem perspectives. Ecol. Indic. 2016, 70, 317–339.Terrain and Surfaces. Remote Sens. 2020, 12, 3690. [CrossRef]
- Lausch, A.; Bastian, O.; Klotz, S.; Leitão, P.J.; Jung, A.; Rocchini, D.; Schaepman, M.E.; Skidmore, A.K.; Tischendorf, L.; Knapp, S. Understanding and assessing vegetation health by in situ species and remote-sensing approaches. Methods Ecol. Evol. 2018, 9, 1799–1809.Green, J.L.; Bohannan, B.J.M.; Whitaker, R.J. Microbial Biogeography: From Taxonomy to Traits. Science 2008, 320, 1039–1043.
- Kulkarni, H. Delineation of shallow Deccan basaltic aquifers from Maharashtra using aerial photointerpretation. J. Indian Soc. Remote Sens. 1992, 20, 129–138.[CrossRef]
- Kulkarni, H. Delineation of shallow Deccan basaltic aquifers from Maharashtra using aerial photointerpretation. J. Indian Soc. Remote Sens. 1992, 20, 129–138.Thome, C.R.; Zevenbergen, L.W. Estimating Mean Velocity in Mountain Rivers. J. Hydraul. Eng. 1985, 111, 612–624. [CrossRef]
- Fisher, G.B.; Amos, C.B.; Bookhagen, B.; Burbank, D.W.; Godard, V. Channel widths, landslides, faults, and beyond: The new world order of high-spatial resolution Google Earth imagery in the study of earth surface processes. In Google Earth and Virtual Visualizations in Geoscience Education and Research; Geological Society of America: Boulder, CO, USA, 2012.Gilbert, G.K. Monograph—Geology of the Henry Mountains; Washington Government Printing Office: Washington, DC, USA, 1877.
- Peyghambari, S.; Zhang, Y. Hyperspectral remote sensing in lithological mapping, mineral exploration, and environmental geology: An updated review. J. Appl. Remote Sens. 2021, 15, 031501.Dikau, R.; Eibisch, K.; Eichel, J.; Meßenzehl, K.; Schlummer-Held, M. Biogeomorphologie. In Geomorphologie; Springer:
- Calvari, S.; Ganci, G.; Victória, S.; Hernandez, P.; Perez, N.; Barrancos, J.; Alfama, V.; Dionis, S.; Cabral, J.; Cardoso, N.; et al. Satellite and Ground Remote Sensing Techniques to Trace the Hidden Growth of a Lava Flow Field: The 2014–2015 Effusive Eruption at Fogo Volcano (Cape Verde). Remote Sens. 2018, 10, 1115.Berlin/Heidelberg, Germany, 2019; ISBN 978-3-662-59401-8.
- Sofia, G. Combining geomorphometry, feature extraction techniques and Earth-surface processes research: The way forward. Geomorphology 2020, 355, 107055.Viles, H. Biogeomorphology; Basil Blackwell: Oxford, UK, 1988.
- Elosegi, A.; Díez, J.; Mutz, M. Effects of hydromorphological integrity on biodiversity and functioning of river ecosystems. Hydrobiologia 2010, 657, 199–215.Viles, H. Biogeomorphology: Past, present and future. Geomorphology 2020, 366, 106809. [CrossRef]
- Corenblit, D.; Baas, A.C.W.; Bornette, G.; Darrozes, J.; Delmotte, S.; Francis, R.A.; Gurnell, A.M.; Julien, F.; Naiman, R.J.; Steiger, J. Feedbacks between geomorphology and biota controlling Earth surface processes and landforms: A review of foundation concepts and current understandings. Earth-Sci. Rev. 2011, 106, 307–331.Grill, G.; Lehner, B.; Thieme, M.; Geenen, B.; Tickner, D.; Antonelli, F.; Babu, S.; Borrelli, P.; Cheng, L.; Crochetiere, H.; et al.
- Stein, A.; Gerstner, K.; Kreft, H. Environmental heterogeneity as a universal driver of species richness across taxa, biomes and spatial scales. Ecol. Lett. 2014, 17, 866–880.Mapping the world’s free-flowing rivers. Nature 2019, 569, 215–221. [CrossRef]
- Sukopp, H. Der Einfluss des Menschen auf die Vegetation. Veg. Acta Geobot. 1969, 17, 360–371.Rathjens, C. Geomorphology and Global Environmental Change; Slaymaker, O., Spencer, T., Embleton-Hamann, C., Eds.; Cambridge
- Lausch, A.; Blaschke, T.; Haase, D.; Herzog, F.; Syrbe, R.-U.; Tischendorf, L.; Walz, U. Understanding and quantifying landscape structure—A review on relevant process characteristics, data models and landscape metrics. Ecol. Modell. 2015, 295, 31–41.University Press: Cambridge, UK, 2009; ISBN 9780511627057.
- Tarolli, P.; Cao,W.; Sofia, G.; Evans, D.; Ellis, E.C. From features to fingerprints: A general diagnostic framework for anthropogenic geomorphology. Prog. Phys. Geogr. Earth Environ. 2019, 43, 95–128.Szabó, J.; Dávid, L.; Lóczy, D. (Eds.) Anthropogenic Geomorphology; Springer Netherlands: Dordrecht, The Netherlands, 2010;
- Kulp, S.A.; Strauss, B.H. New elevation data triple estimates of global vulnerability to sea-level rise and coastal flooding. Nat. Commun. 2019, 10, 4844.ISBN 978-90-481-3057-3.
- Zheng, Z.; Du, S.; Du, S.; Zhang, X. A multiscale approach to delineate dune-field landscape patches. Remote Sens. Environ. 2020, 237, 111591.Tarolli, P.; Cao,W.; Sofia, G.; Evans, D.; Ellis, E.C. From features to fingerprints: A general diagnostic framework for anthropogenic
- Brown, A.G.; Tooth, S.; Bullard, J.E.; Thomas, D.S.G.; Chiverrell, R.C.; Plater, A.J.; Murton, J.; Thorndycraft, V.R.; Tarolli, P.; Rose, J.; et al. The geomorphology of the Anthropocene: Emergence, status and implications. Earth Surf. Process. Landf. 2017, 42, 71–90.geomorphology. Prog. Phys. Geogr. Earth Environ. 2019, 43, 95–128. [CrossRef]
- Le Provost, G.; Thiele, J.; Westphal, C.; Penone, C.; Allan, E.; Neyret, M.; van der Plas, F.; Ayasse, M.; Bardgett, R.D.; Birkhofer, K.; et al. Contrasting responses of above- and belowground diversity to multiple components of land-use intensity. Nat. Commun. 2021, 12, 3918.Goudie, A. The human impact in geomorphology—50 years of change. Geomorphology 2020, 366, 106601. [CrossRef]
- Mock, J. Auswirkungen des Hochwasserschutzes. In Eine Einführung in die Umweltwissenschaften; Böhm, H.R., Deneke, M., Eds.; Wissenschaftliche Buchgesellschaft: Darmstadt, Germany, 1992; pp. 176–196.Panizza, M. The geomorphodiversity of the Dolomites (Italy): A Key of geoheritage assessment. Geoheritage 2009, 1, 33–42.
- Mock, J. Auswirkungen des Hochwasserschutzes. In Eine Einführung in die Umweltwissenschaften; Böhm, H.R., Deneke, M., Eds.; Wissenschaftliche Buchgesellschaft: Darmstadt, Germany, 1992; pp. 176–196.Panizza, M. Outstanding Intrinsic and Extrinsic Values of the Geological Heritage of the Dolomites (Italy). Geoheritage 2018,
- 10, 607–612. [CrossRef]
- Bollati, I.M.; Cavalli, M. Unraveling the relationship between geomorphodiversity and sediment connectivity in a small alpine
- catchment. Trans. GIS 2021, 25, 2481–2500. [CrossRef]
- Moradi, A.; Maghsoudi, M.; Moghimi, E.; Yamani, M.; Rezaei, N. A Comprehensive Assessment of Geomorphodiversity and
- Geomorphological Heritage for Damavand Volcano Management, Iran. Geoheritage 2021, 13, 39. [CrossRef]
- Melelli, L.; Vergari, F.; Liucci, L.; Del Monte, M. Geomorphodiversity index: Quantifying the diversity of landforms and physical
- landscape. Sci. Total Environ. 2017, 584–585, 701–714. [CrossRef]
- Zwoliñski, Z. The routine of landform geodiversity map design for the Polish Carpathian Mts. Landf. Anal. 2009, 11, 77–85.
- Tarolli, P.; Mudd, S.M. Remote Sensing of Geomorphology; Elsevier: Edinburgh, UK, 2020; ISBN 978-0-444-64177-9.
- Smith, M.J.; Pain, C.F. Applications of remote sensing in geomorphology. Prog. Phys. Geogr. Earth Environ. 2009, 33, 568–582.
- Hjort, J.; Luoto, M. Can geodiversity be predicted from space? Geomorphology 2012, 153–154, 74–80. [CrossRef]
- Brown, A.G.; Tooth, S.; Bullard, J.E.; Thomas, D.S.G.; Chiverrell, R.C.; Plater, A.J.; Murton, J.; Thorndycraft, V.R.; Tarolli, P.; Rose,
- J.; et al. The geomorphology of the Anthropocene: Emergence, status and implications. Earth Surf. Process. Landf. 2017, 42, 71–90.
- Blei, D.M.; Ng, A.Y.; Jordan, M.I. Latent Dirichlet Allocation. J. Mach. Learn. Res. 2003, 3, 993–1022.
- Masek, J.G.; Wulder, M.A.; Markham, B.; McCorkel, J.; Crawford, C.J.; Storey, J.; Jenstrom, D.T. Landsat 9: Empowering open
- science and applications through continuity. Remote Sens. Environ. 2020, 248, 111968. [CrossRef]
- Woodcock, C.E.; Allen, R.; Anderson, M.; Belward, A.; Bindschadler, R.; Cohen, W.; Gao, F.; Goward, S.N.; Helder, D.;
- Helmer, E.; et al. Free Access to Landsat Imagery. Science 2008, 320, 1011. [CrossRef]
- Turner,W.; Rondinini, C.; Pettorelli, N.; Mora, B.; Leidner, A.K.; Szantoi, Z.; Buchanan, G.; Dech, S.; Dwyer, J.; Herold, M.; et al.
- Free and open-access satellite data are key to biodiversity conservation. Biol. Conserv. 2015, 182, 173–176. [CrossRef]
- Wulder, M.A.; White, J.C.; Loveland, T.R.; Woodcock, C.E.; Belward, A.S.; Cohen, W.B.; Fosnight, E.A.; Shaw, J.; Masek, J.G.; Roy,
- D.P. The global Landsat archive: Status, consolidation, and direction. Remote Sens. Environ. 2016, 185, 271–283. [CrossRef]
- Zhu, Z.; Wulder, M.A.; Roy, D.P.; Woodcock, C.E.; Hansen, M.C.; Radeloff, V.C.; Healey, S.P.; Schaaf, C.; Hostert, P.; Strobl, P.; et al.
- Benefits of the free and open Landsat data policy. Remote Sens. Environ. 2019, 224, 382–385. [CrossRef]
- Wulder, M.A.; Loveland, T.R.; Roy, D.P.; Crawford, C.J.; Masek, J.G.; Woodcock, C.E.; Allen, R.G.; Anderson, M.C.; Belward,
- A.S.; Cohen,W.B.; et al. Current status of Landsat program, science, and applications. Remote Sens. Environ. 2019, 225, 127–147.
- Guanter, L.; Kaufmann, H.; Segl, K.; Foerster, S.; Rogass, C.; Chabrillat, S.; Kuester, T.; Hollstein, A.; Rossner, G.; Chlebek, C.; et al.
- The EnMAP Spaceborne Imaging Spectroscopy Mission for Earth Observation. Remote Sens. 2015, 7, 8830–8857. [CrossRef]
- Eegholm, B.H.; Wake, S.; Denny, Z.; Dogoda, P.; Poulios, D.; Coyle, B.; Mule, P.; Hagopian, J.G.; Thompson, P.; Ramos-Izquierdo,
- L.; et al. Global Ecosystem Dynamics Investigation (GEDI) instrument alignment and test. Opt. Modeling Syst. Alignment 2019,
- 11103, 1110308.
- Dubayah, R.; Blair, J.B.; Goetz, S.; Fatoyinbo, L.; Hansen, M.; Healey, S.; Hofton, M.; Hurtt, G.; Kellner, J.; Luthcke, S.; et al. The
- Global Ecosystem Dynamics Investigation: High-resolution laser ranging of the Earth’s forests and topography. Sci. Remote Sens.
- 2020, 1, 100002. [CrossRef]
- Krieger, G.; Pardini, M.; Schulze, D.; Bachmann, M.; Borla Tridon, D.; Reimann, J.; Brautigam, B.; Steinbrecher, U.; Tienda, C.;
- Sanjuan Ferrer, M.; et al. Tandem-L: Main results of the phase a feasibility study. In Proceedings of the 2016 IEEE International
- Geoscience and Remote Sensing Symposium (IGARSS), IEEE, Beijing, China, 10–15 July 2016; Volume 2016, pp. 2116–2119.
- Moreira, A.; Krieger, G.; Gonzalez, C.; Nannini, M.; Zink, M. Tandem-L: A Highly Innovative Bistatic SAR Mission for Monitoring
- Earth ’ s System Dynamics. Geophys. Res. Abstr. 2019, 21, 2019.
- Alonso, K.; Bachmann, M.; Burch, K.; Carmona, E.; Cerra, D.; de los Reyes, R.; Dietrich, D.; Heiden, U.; Hölderlin, A.; Ickes, J.; et al.
- Data products, quality and validation of the DLR earth sensing imaging spectrometer (DESIS). Sensors 2019, 19, 4471. [CrossRef]
- Nieke, J.; Rast, M. Towards the Copernicus Hyperspectral Imaging Mission For The Environment (CHIME). In Proceedings of
- the IGARSS 2018-2018 IEEE International Geoscience and Remote Sensing Symposium, IEEE, Valencia, Spain, 22–27 July 2018;
- pp. 157–159.
- Abrams, M.J.; Hook, S.J. NASA’s Hyperspectral Infrared Imager (HyspIRI). In Thermal Infrared Remote Sensing; Springer: Dordrecht,
- The Netherlands, 2013; pp. 117–130.
- Jeliazkov, A.; Mijatovic, D.; Chantepie, S.; Andrew, N.; Arlettaz, R.; Barbaro, L.; Barsoum, N.; Bartonova, A.; Belskaya, E.;
- Bonada, N.; et al. A global database for metacommunity ecology, integrating species, traits, environment and space. Sci. Data
- 2020, 7, 6. [CrossRef]
- Bruelheide, H.; Dengler, J.; Purschke, O.; Lenoir, J.; Jiménez-Alfaro, B.; Hennekens, S.M.; Botta-Dukát, Z.; Chytrý, M.; Field, R.;
- Jansen, F.; et al. Global trait–environment relationships of plant communities. Nat. Ecol. Evol. 2018, 2, 1906–1917. [CrossRef]
- Morgan, L.R.; Marsh, K.J.; Tolleson, D.R.; Youngentob, K.N. The Application of NIRS to Determine Animal Physiological Traits
- for Wildlife Management and Conservation. Remote Sens. 2021, 13, 3699. [CrossRef]
- Linking Remote Sensing and Geodiversity and Their Traits Relevant to Biodiversity—Part I: Soil Characteristics. Remote Sens.
- 2019, 11, 2356. [CrossRef]
- Andersson, E.; Haase, D.; Anderson, P.; Cortinovis, C.; Goodness, J.; Kendal, D.; Lausch, A.; McPhearson, T.; Sikorska, D.;
- Wellmann, T. What are the traits of a social-ecological system: Towards a framework in support of urban sustainability. NPJ Urban
- Sustain. 2021, 1, 14. [CrossRef]
- Wellmann, T.; Haase, D.; Knapp, S.; Salbach, C.; Selsam, P.; Lausch, A. Urban land use intensity assessment: The potential of
- spatio-temporal spectral traits with remote sensing. Ecol. Indic. 2018, 85, 190–203. [CrossRef]
- Lausch, A.; Bastian, O.; Klotz, S.; Leitão, P.J.; Jung, A.; Rocchini, D.; Schaepman, M.E.; Skidmore, A.K.; Tischendorf, L.; Knapp,
- S. Understanding and assessing vegetation health by in situ species and remote-sensing approaches. Methods Ecol. Evol. 2018,
- 9, 1799–1809. [CrossRef]
- Rahbek, C.; Borregaard, M.K.; Colwell, R.K.; Dalsgaard, B.; Holt, B.G.; Morueta-Holme, N.; Nogues-Bravo, D.; Whittaker, R.J.;
- Fjeldså, J. Humboldt’s enigma: What causes global patterns of mountain biodiversity? Science 2019, 365, 1108–1113. [CrossRef]
- Schrodt, F.; Santos, M.J.; Bailey, J.J.; Field, R. Challenges and opportunities for biogeography—What can we still learn from von
- Humboldt? J. Biogeogr. 2019, 46, 1631–1642. [CrossRef]
- Müller, F.; Hoffmann-Kroll, R.;Wiggering, H. Indicating ecosystem integrity—Theoretical concepts and environmental requirements.
- Ecol. Modell. 2000, 130, 13–23. [CrossRef]
- Antonelli, A.; Kissling, W.D.; Flantua, S.G.A.; Bermúdez, M.A.; Mulch, A.; Muellner-Riehl, A.N.; Kreft, H.; Linder, H.P.; Badgley,
- C.; Fjeldså, J.; et al. Geological and climatic influences on mountain biodiversity. Nat. Geosci. 2018, 11, 718–725. [CrossRef]
- Haase, P.; Tonkin, J.D.; Stoll, S.; Burkhard, B.; Frenzel, M.; Geijzendorffer, I.R.; Häuser, C.; Klotz, S.; Kühn, I.; McDowell,W.H.; et al.
- The next generation of site-based long-term ecological monitoring: Linking essential biodiversity variables and ecosystem integrity.
- Sci. Total Environ. 2018, 613–614, 1376–1384. [CrossRef]
- Zepp, H.; Müller, M.J. Landschaftsökologische Erfassungsstandards; Forschung; Deutsche Akademie für Landeskunde, Selbstverlag:
- Flensburg, Germany, 1999; ISBN 3-88143-056-3.
- Leser, H.; Löffler, J. Landschaftsökologie; Auflage: 5; Eugen Ulmer KG: Stuttgart, Germany, 2017; ISBN 3825287181.
- Mukherjee, S.; Koyi, H.A.; Talbot, C.J. Implications of channel flow analogue models for extrusion of the Higher Himalayan Shear
- Zone with special reference to the out-of-sequence thrusting. Int. J. Earth Sci. 2012, 101, 253–272. [CrossRef]
- Mukherjee, S. Higher Himalaya in the Bhagirathi section (NW Himalaya, India): Its structures, backthrusts and extrusion
- mechanism by both channel flow and critical taper mechanisms. Int. J. Earth Sci. 2013, 102, 1851–1870. [CrossRef]
- Mukherjee, S. Tectonic Implications and Morphology of Trapezoidal Mica Grains from the Sutlej Section of the Higher Himalayan
- Shear Zone, Indian Himalaya. J. Geol. 2012, 120, 575–590. [CrossRef]
- Mukherjee, S. Simple shear is not so simple! Kinematics and shear senses in Newtonian viscous simple shear zones. Geol. Mag.
- 2012, 149, 819–826. [CrossRef]
- Bose, N.; Mukherjee, S. Map Interpretation for Structural Geologists, 1st ed.; Elsevier, Ed.; Elsevier: Amsterdam, The Netherlands,
- 2017; ISBN 978-0-12-809681-9.
- Hilbich, C. Time-lapse refraction seismic tomography for the detection of ground ice degradation. Cryosphere 2010, 4, 243–259.
- Kruglov, O.; Menshov, O.; Miroshnychenko, M.; Shevchenko, M. Integration of geophysical, soil science and geospatial methods
- in the study of eroded soil. In Proceedings of the Geoinformatics: Theoretical and Applied Aspects 2020, Kyiv, Ukraine,
- 11–14 May 2020; pp. 1–5.
- Jongmans, D.; Garambois, S. Geophysical investigation of landslides: A review. Bull. Soc. Geol. Fr. 2007, 178, 101–112. [CrossRef]
- Whiteley, J.S.; Chambers, J.E.; Uhlemann, S.; Wilkinson, P.B.; Kendall, J.M. Geophysical Monitoring of Moisture-Induced
- Landslides: A Review. Rev. Geophys. 2019, 57, 106–145. [CrossRef]
- Hussain, Y.; Cardenas-Soto, M.; Martino, S.; Moreira, C.; Borges, W.; Hamza, O.; Prado, R.; Uagoda, R.; Rodríguez-Rebolledo, J.;
- Silva, R.; et al. Multiple Geophysical Techniques for Investigation and Monitoring of Sobradinho Landslide, Brazil. Sustainability
- 2019, 11, 6672. [CrossRef]
- Florentine, C.; Skidmore, M.; Speece, M.; Link, C.; Shaw, C.A. Geophysical analysis of transverse ridges and internal structure at
- Lone Peak Rock Glacier, Big Sky, Montana, USA. J. Glaciol. 2014, 60, 453–462. [CrossRef]
- Kneisel, C.; Hauck, C.; Fortier, R.; Moorman, B. Advances in geophysical methods for permafrost investigations. Permafr. Periglac.
- Process. 2008, 19, 157–178. [CrossRef]
- Tukiainen, H.; Kiuttu, M.; Kalliola, R.; Alahuhta, J.; Hjort, J. Landforms contribute to plant biodiversity at alpha, beta and gamma
- levels. J. Biogeogr. 2019, 46, 1699–1710. [CrossRef]
- Eviner, V.T.; Chapin, F.S., III. Functional Matrix: A Conceptual Framework for Predicting Multiple Plant Effects on Ecosystem
- Processes. Annu. Rev. Ecol. Evol. Syst. 2003, 34, 455–485. [CrossRef]
- Pazzi, V.; Morelli, S.; Fanti, R. A Review of the Advantages and Limitations of Geophysical Investigations in Landslide Studies.
- Int. J. Geophys. 2019, 2019, 2983087. [CrossRef]
- Natsuaki, R.; Nagai, H.; Motohka, T.; Ohki, M.;Watanabe, M.; Thapa, R.B.; Tadono, T.; Shimada, M.; Suzuki, S. SAR interferometry
- using ALOS-2 PALSAR-2 data for the Mw 7.8 Gorkha, Nepal earthquake. Earth Planets Sp. 2016, 68, 15. [CrossRef]
- Bovolo, F.; Bruzzone, L. A Split-Based Approach to Unsupervised Change Detection in Large-Size Multitemporal Images:
- Application to Tsunami-Damage Assessment. IEEE Trans. Geosci. Remote Sens. 2007, 45, 1658–1670. [CrossRef]
- Dasgupta, S.; Mukherjee, S. Remote Sensing in Lineament Identification: Examples from Western India. In Problems and Solutions
- in Structural Geology and Tectonics; Elsevier Inc.: Amsterdam, The Netherlands, 2019; Volume 5, pp. 205–221. ISBN 9780128140482.
- Prost, G.L. Remote Sensing for Geoscientists; T & F Group, Ed.; CRC Press: Boca Raton, FL, USA; London, UK; New York, NY, USA,
- 2013; ISBN 9781466561755.
- Baatz, R.; Franssen, H.J.H.; Euskirchen, E.; Sihi, D.; Dietze, M.; Ciavatta, S.; Fennel, K.; Beck, H.; De Lannoy, G.;
- Pauwels, V.R.N.; et al. Reanalysis in Earth System Science: Towards Terrestrial Ecosystem Reanalysis. Rev. Geophys.
- 2021, 59, e2020RG000715. [CrossRef]
- Jensen, J.R. Remote Sensing of the Environment: An Earth Resource Perspective, 2nd ed.; Prentice-Hall, Inc.: Upper Saddle River, NJ,
- USA, 2014; ISBN 9780131889507.
- Haghshenas Haghighi, M.; Motagh, M. Ground surface response to continuous compaction of aquifer system in Tehran, Iran:
- Results from a long-term multi-sensor InSAR analysis. Remote Sens. Environ. 2019, 221, 534–550. [CrossRef]
- Tapley, B.D. GRACE Measurements of Mass Variability in the Earth System. Science 2004, 305, 503–505. [CrossRef]
- Flechtner, F.; Neumayer, K.-H.; Dahle, C.; Dobslaw, H.; Fagiolini, E.; Raimondo, J.-C.; Güntner, A. What Can be Expected from the
- GRACE-FO Laser Ranging Interferometer for Earth Science Applications? Surv. Geophys. 2016, 37, 453–470. [CrossRef]
- Kohnert, K.; Serafimovich, A.; Metzger, S.; Hartmann, J.; Sachs, T. Strong geologic methane emissions from discontinuous
- terrestrial permafrost in the Mackenzie Delta, Canada. Sci. Rep. 2017, 7, 5828. [CrossRef]
- O’Hare, M.T.; Mountford, J.O.; Maroto, J.; Gunn, I.D.M. Plant Traits Relevant to fluvial geomorphology and hydrological
- interactions. River Res. Appl. 2014, 30, 132–133. [CrossRef]
- Notesco, G.; Ogen, Y.; Ben-Dor, E. Mineral classification of makhtesh ramon in israel using hyperspectral longwave infrared
- (LWIR) remote-sensing data. Remote Sens. 2015, 7, 12282–12296. [CrossRef]
- Weksler, S.; Rozenstein, O.; Ben-dor, E. Mapping Surface Quartz Content in Sand Dunes Covered by Biological Soil Crusts Using
- Airborne Hyperspectral Images in the Longwave. Minerals 2018, 8, 318. [CrossRef]
- Van der Meer, F.D.; van der Werff, H.M.A.; van Ruitenbeek, F.J.A.; Hecker, C.A.; Bakker, W.H.; Noomen, M.F.; van der Meijde, M.;
- Carranza, E.J.M.; de Smeth, J.B.;Woldai, T. Multi- and hyperspectral geologic remote sensing: A review. Int. J. Appl. Earth Obs.
- Geoinf. 2012, 14, 112–128. [CrossRef]
- Tewksbury, B.J.; Dokmak, A.A.K.; Tarabees, E.A.; Mansour, A.S. Google Earth and geologic research in remote regions of the
- developing world: An example from the Western Desert of Egypt. In Google Earth and Virtual Visualizations in Geoscience Education
- and Research; Geological Society of America: Boulder, CO, USA, 2012.
- Behling, R.; Roessner, S.; Golovko, D.; Kleinschmit, B. Derivation of long-term spatiotemporal landslide activity—A multi-sensor
- time series approach. Remote Sens. Environ. 2016, 186, 88–104. [CrossRef]
- Haghighi, M.H.; Motagh, M. Sentinel-1 InSAR over Germany: Large-scale interferometry, atmospheric effects, and ground
- deformation mapping. ZFV-Z. Geodasie Geoinf. Landmanag. 2017, 142, 245–256.
- Al-Masrahy, M.A.; Mountney, N.P. Remote sensing of spatial variability in aeolian dune and interdune morphology in the Rub’
- Al-Khali, Saudi Arabia. Aeolian Res. 2013, 11, 155–170. [CrossRef]
- Kaliraj, S.; Chandrasekar, N.; Ramachandran, K.K. Mapping of coastal landforms and volumetric change analysis in the south
- west coast of Kanyakumari, South India using remote sensing and GIS techniques. Egypt. J. Remote Sens. Sp. Sci. 2017, 20, 265–282.
- Kulp, S.A.; Strauss, B.H. New elevation data triple estimates of global vulnerability to sea-level rise and coastal flooding. Nat.
- Commun. 2019, 10, 4844. [CrossRef] [PubMed]
- Dang, K.B.; Dang, V.B.; Bui, Q.T.; Nguyen, V.V.; Pham, T.P.N.; Ngo, V.L. A Convolutional Neural Network for Coastal Classification
- Based on ALOS and NOAA Satellite Data. IEEE Access 2020, 8, 11824–11839. [CrossRef]
- Schwefel, D.; Glässer, C.; Glässer, W. Dynamik anthropogen induzierter Landschaftsveränderungen im Bergbaufolgegebiet
- Teutschenthal-Bahnhof (Sachsen-Anhalt). Hercynia 2012, 45, 9–31.
- Blaschke, T. Object based image analysis for remote sensing. ISPRS J. Photogramm. Remote Sens. 2010, 65, 2–16. [CrossRef]
- Clark, R.N.; Swayze, G.A.; Livo, K.E.; Kokaly, R.F.; Sutley, S.J.; Dalton, J.B.; McDougal, R.R.; Gent, C.A. Imaging spectroscopy:
- Earth and planetary remote sensing with the USGS Tetracorder and expert systems. J. Geophys. Res. Planets 2003, 108, 5. [CrossRef]
- Shumack, S.; Hesse, P.; Farebrother,W. Deep learning for dune pattern mapping with the AW3D30 global surface model. Earth
- Surf. Process. Landf. 2020, 45, 2417–2431. [CrossRef]
- Farmakis-Serebryakova, M.; Hurni, L. Comparison of Relief Shading Techniques Applied to Landforms. ISPRS Int. J. Geo.-Inf.
- 2020, 9, 253. [CrossRef]
- Ventura, G.; Vilardo, G.; Terranova, C.; Sessa, E.B. Tracking and evolution of complex active landslides by multi-temporal airborne
- LiDAR data: The Montaguto landslide (Southern Italy). Remote Sens. Environ. 2011, 115, 3237–3248. [CrossRef]