Your browser does not fully support modern features. Please upgrade for a smoother experience.
Please note this is a comparison between Version 1 by Ibtihal Alablani and Version 3 by Rita Xu.
The fifth-generation (5G) network is the current emerging technology that meets the increasing need for higher throughputs and greater system capacities. It is expected that 5G technology will enable many new applications and services. Vehicle-to-everything (V2X) communication is an example of an application that is supported by 5G technology and beyond. A V2X communication system allows a vehicle to be connected to an entity, such as a pedestrian, another vehicle, infrastructure, and a network, to provide a robust transportation solution.
- 5G
- Google Maps
- IoV
- ITS
- Los Angeles
- machine learning
1. Introduction
The fifth generation is the current generation of cellular networks and aims to make significant improvements in service quality to enhance reliability, throughput, delay, and connectivity [1]. Some examples of 5G emerging applications are smart houses, intelligent transportation, health monitoring, and the Internet of Things (IoT) [2]. The IoT is an emerging revolution that associates physical things to the Internet [3]. The Internet of Vehicles (IoV) is a subset of the IoT in which vehicles are connected to the internet and can send and receive data [4][5][4,5]. Vehicle-to-everything technology is an evolution towards the IoV era and the Intelligent Transportation System (ITS). V2X aims to enhance road safety, the reliability of communications, and traffic efficiency [6][7][6,7]. There are four kinds of V2X communications, as shown in Figure 1: vehicle-to-vehicle (V2V), vehicle-to-pedestrian (V2P), vehicle-to-infrastructure (V2I), and vehicle-to-network (V2N). An ITS provides end users with comfort and safety by employing many models and strategies, the majority of which are based on machine learning techniques [8].
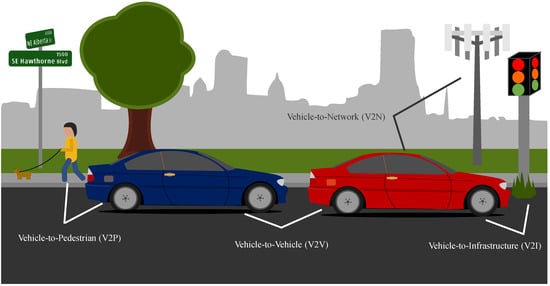
Figure 1. Types of vehicle-to-everything communications.
Machine learning (ML) is a branch of artificial intelligence (AI) that allows computers to learn from data without having to be explicitly programmed [9][10][9,10]. ML techniques have recently received a lot of attention and the future prospects for this technology are extremely bright [11]. There are three types of learning techniques, i.e., supervised, unsupervised, and reinforcement methods. Supervised learning uses labeled data to perform a specific learning task, while unsupervised learning uses unlabeled data [12]. Reinforcement learning is a kind of learning that uses reward signals to make the computer learn; the learner is not taught which actions to take, but it must try to see which ones give the most rewards [13]. Building an effective ML model needs data features that are closely associated with each other and with the prediction target [14].
A smart city is an urban area that utilizes advanced technologies to make life easier for its citizens [15][16][15,16]. Smart cities focus on improving the quality of services provided to individuals through the management of public resources, convenience, maintenance, and sustainability [17]. They can overcome issues related to the fields of health, education, environment, governance, economic, and transportation [18][19][18,19]. By 2025, it is expected that there will be 88 smart cities around the world. Based on the global smart cities index, the top ten smart cities in terms of smart infrastructure, economy, and governance are London, New York, Paris, Berlin, Tokyo, Los Angeles, Singapore, Seoul, Chicago, and Hong Kong [20]. Three of these top cities are located in the United States of America. New York is one of the largest cities in the world and it has many attractions for tourists and a diversity of cultures, as 40% of its residents come from other countries [21]. Los Angeles lies in Southern California and it is the United States’ second-largest city in terms of population [22][23][22,23]. Chicago is located in northeastern Illinois and it is the third largest city in the United States in terms of population [24][25][24,25].
In the field of transportation, a very limited number of real vehicle databases is available for scientists and engineers to perform academic research related to V2X and machine learning. The existing databases require effort, time, and equipment to collect data samples. In addition, the resulting data lack location accuracy and up-to-date versions.
2. Related Work
In [26], Jensen et al., who are researchers at the Aalborg University department of Development and Planning, recorded a vehicle dataset during an intelligent speed adaptation project called INFATI. The dataset was generated in February and March 2001 in Aalborg, Denmark. It is non-commercial and is available free of charge for researchers. Each vehicle was equipped with a Global Positioning System (GPS) receiver in addition to a small computer. When vehicles were moved, their GPS location was sampled every second. When vehicles were parked, no sampling was generated. The process of collecting vehicle information took more than a month. The generated datasets were saved in Universal Transverse Mercator (UTM) format. Figure 2 shows the vehicle samples on the INFATI dataset. In [27], the authors found that the resolution of the INFATI dataset was low and inconsistent.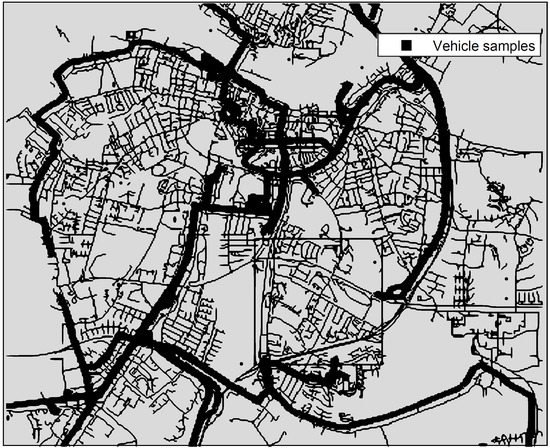
Figure 2. Illustration of vehicle samples of the INFATI dataset.
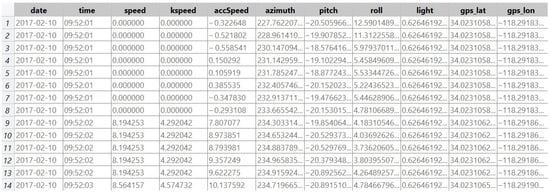
Figure 3. The vehicle dataset introduced by Cho and Kim in LA.

Figure 4. Illustration on the LA map of vehicle samples collected by Cho and Kim.
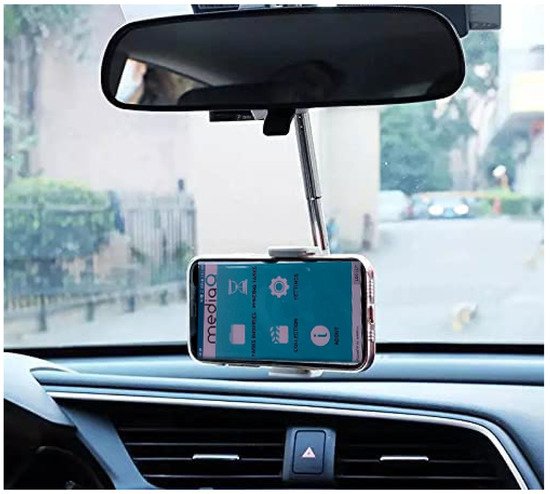
Figure 5. Smartphone mounted on a vehicle dashboard to generate the vehicle dataset.
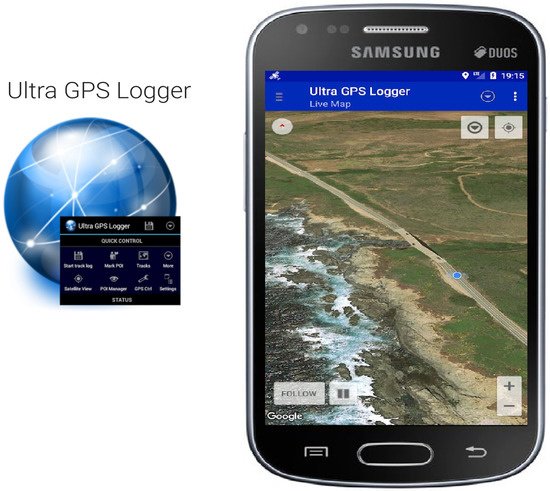
Figure 6. Using the Ultra GPS Logger application on an Android smartphone.
3. Limitations of the Related Works
The limitations of Cho and Kim’s dataset, which was collected in LA, are the following:-
Most of the vehicle samples are located on freeways, such as Harbor, Passadena, and Santa Ana, as shown in Figure 4. The distribution of vehicle samples should not focus on a particular type of street.
-
The geographical distance between two consecutive samples is large around 20 m, as shown in Figure 7. A large space between samples is undesirable when applying machine learning techniques.
-
The long time and huge effort required to record vehicle dataset samples.
-
The driving time for collecting the LA vehicle dataset was long (around 22 h).
-
The recording process of the dataset required considerable effort, equipment, and tools (i.e, five types of sensors, MediaQ platform, smartphone, and a vehicle smartphone holder).
-
The need for equipment in the vehicle during the collecting process, such as GPS receivers, computers, and smartphones.
-
The database includes samples that are not moving (i.e., vehicles with a speed of 0 km/h).
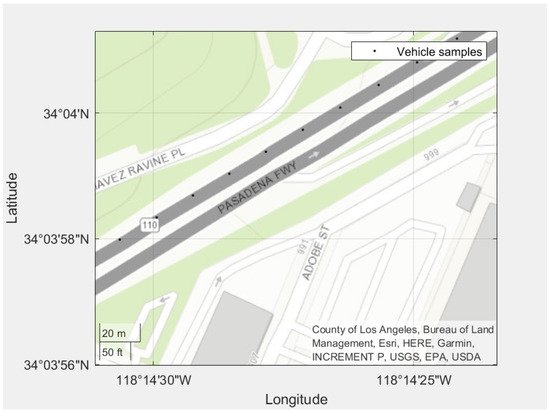
Figure 7. The distance between two consecutive geographical points.
- The accuracy of the resulting samples is not guaranteed and it may deviate from the road on which the vehicles moved.
- Difficulty in updating and adding new samples to the resulting dataset, whereas, after some years, changes may occur to the streets on which the data were collected.