Your browser does not fully support modern features. Please upgrade for a smoother experience.
Please note this is a comparison between Version 1 by Luca Rinaudo and Version 2 by Peter Tang.
Bone strain Index (BSI) is an innovative index of bone strength that provides information about skeletal resistance to loads not considered by existing indexes (Bone Mineral Density, BMD. Trabecular Bone Score, TBS. Hip Structural Analysis, HSA. Hip Axis Length, HAL), and, thus, improves the predictability of fragility fractures in osteoporotic patients. This improved predictability of fracture facilitates the possibility of timely intervention with appropriate therapies to reduce the risk of fracture.
- DXA
- BMD
- TBS
- Bone Strain Index
- BSI
1. Introduction
Metabolic Bone Diseases, and particularly primary and secondary osteoporosis, are characterised by bone derangement that leads to fragility fractures which reduce quality of life and may cause death, primarily in the case of hip fracture [1]. Prevalence and incidence of osteoporosis are increasing worldwide, mainly because of the ageing, and osteoporotic fractures are associated with substantial social, economic, and healthcare burdens [2]. As osteoporosis is an asymptomatic or pauci-symptomatic disease, it is essential for clinicians to formulate an early diagnosis of bone derangement. This allows prescribing in time the appropriate measures to prevent fragility fractures and to monitor the efficacy of the pharmacological treatments.
Assessment of bone status relies mainly on the Dual X-ray Absorptiometry (DXA), the World Health Organization’s gold standard diagnostic technique for the measurement of bone quantity (expressed as BMD), bone geometry (HSA, HAL), and bone quality (TBS) [3][4][5][3,4,5]. The instrumental diagnosis of osteoporosis is established when BMD, in terms of standard deviation from a healthy young population, is ≤ −2.5 for women in post-menopause or for men over 50, whereas a T-score ≤ −1.0 is classified as osteopenia. For men under 50 and for premenopausal women, BMD is indicated as a standard deviation from age- and sex-matched population with the cutoff set at ≤−2.0 [6]. BMD measurement is a well-known indicator of bone strength, and it has been widely used for many decades to classify patients in clinical practice.
However, it is also known that low BMD accounts for about 70% of the fragility fractures observed in the clinical practice. Furthermore, it is also well known that there is an overlap between BMD distribution of patients with and without osteoporotic fractures [7][8][7,8]. All this indicates that other elements may play a role in bone strength, like texture, geometry, deformation capability, fatigue and physical determinants of the strength of all materials, bone included [9]. These are fundamental aspects in those diseases where BMD is not significantly reduced. Still, fragility fractures are frequent, as usually observed in secondary osteoporosis due, for example, to glucocorticoids and rheumatological disorders [10], not by chance, included among the highly critical risk factors for osteoporosis in the fracture risk charts like the FRAX tool. Bone involvement is well-known in these pathologies: systemic bone loss is one of the most common comorbidities. It starts early in the disease development, even before clinical acknowledgment, as in rheumatological diseases [11]. The skeletal sites affected are mainly those with prevalent trabecular bone, like lumbar spine, but cortical bone, like femoral neck and distal radius, may also be affected [12][13][12,13], with significantly lower BMD values related to the disease duration and regardless of treatment [14]. A reduction in BMD also characterises periarticular local bone loss in RA [15][16][15,16], which seems to be associated with the development of aggressive systemic diseases [17]. Glucocorticoids (GCs) are often prescribed at a higher dose to treat secondary osteoporosis and their detrimental effect on the bone, with increased risk of fragility fracture, has long been documented in the literature [18][19][18,19].
TBS, an indirect DXA bone texture index, used since 2008, is an effective bone quality index, explaining fracture events in patients with a higher BMD receiving GC [18][20][18,20]. Nevertheless, in other diseases, like endocrinological and nephrological ones, bone quality derangement is more relevant than bone quantity loss [21]. Diabetes, for example, is an in vivo model of this particular condition where TBS is a better fracture predictor than BMD [22]. Moreover, in hyperparathyroidism [23] and chronic kidney disease [24] TBS has proven to be clinically useful [10]. TBS is an essential tool to investigate bone quality status. Still, not all necessary information to evaluate the resistance of bone to loads is taken into consideration, and there is a lack in geometry parameters and load performance. In addition, TBS is inferred from the lumbar spine scan and does not provide data about femoral bone quality status.
Bone geometry parameters, inferred from a DXA hip scan, perform as another index of bone derangement in primary and secondary osteoporosis [25][26][27][25,26,27]. Hip Structural Analysis (HSA) provides a mechanical description of three femoral areas of interest (Narrow Neck, Intertrochanteric and Femur Shaft) employing different parameters, like the cross-sectional area (CSA), the cross-sectional moment of inertia (CSMI), the section modulus (Z) and the buckling ratio (BR) [5]. Studies have revealed that HSA results predict hip fracture occurrence [28][29][28,29]. However, their use in patient’s management is still limited by difficulties in interpreting the structural parameters and by insufficient evidence from clinical practice settings regarding fracture prediction [5]. For this reason, scientific guidelines do not recommend its routine clinical use to assess hip fracture risk [5][30][5,30]. DXA images can automatically obtain two other geometric parameters: the neck-shaft angle (NSA) and hip axis length (HAL). Several studies have found a positive association between longer HAL and hip fracture, and it thus seems that this geometric parameter plays an important role in predicting hip fracture regardless of BMD values [5]. It is not yet clear whether the NSA may be used as an additional fracture risk parameter [5].
Undoubtedly BMD, TBS, and Hip geometry are all helpful to assess bone status in secondary osteoporosis. However, information about bone resistance to load is incomplete and data relating to deformation and fatigue are missing from a constructive point of view. One of the most complete approaches to investigating bone from a mechanical point of view is Finite Element Analysis, which allows determining the stress and strain status of an object made up of a specific material and subject to specific load conditions. This method is extensively used in engineering and has been applied successfully both in fracture risk prediction [31] and in prosthetic implants simulation [32][33][32,33].
2. BSI: Its Helpfulness
Bone can be considered a complex entity, built with particular structural properties and geometrical characteristics to fulfill its natural support function: resistance to compressive, torsional and flexural loads. From a construction point of view, many factors of the skeleton have to be taken into account to explain bone strength [34] and their analysis is essential to improve our capacity to predict a structural failure. In a structure under external load, magnitude and distribution of internal stresses depend on the loading configuration, the geometry of the system and the properties of the employed materials. To avoid permanent damage and fracture, stresses and strains must remain below a specific yield-point level. Bone is subjected to the same mechanical rules and its resistance is governed by its density, geometry, internal trabecular structure and cortical thickness, all of which can be inferred from radiological images. The measurement of these parameters can be based on volumetric images (e.g., computed tomography) or planar images, where traditional radiography (X-ray) and DXA are the most common technologies. X-ray images can be analysed using different methods [34][35][36][34,35,36], ranging from classic beam models, usually applied to long bones [35][37][38][35,37,38], to the application of more complex models, such as the finite element model (FEM) [39]. The FEM method consists of dividing an object into simpler elements, to which the laws of classical mechanics apply. Forces and constraints, applied to the bone in specific regions, generate internal stresses and strains, which depend on the magnitude and the type of the solicitation, the bone geometry and the stiffness of each simple element in which the bone has been divided. Although many FEMs have been developed to investigate the bone status and fracture risk, none of them is used in routine clinical practice. Indeed, the FEM programs, to date, have not been entirely automated or adapted to clinical reporting. Furthermore, it is important to applying this method to the usually scanned femoral and lumbar anatomical sites, when employing DXA. In recent years many studies have focused on FEM analysis of the proximal femur to estimate femoral strength and assess hip fracture risk [34][40][34,40]. However, only a few studies have dealt with the lumbar anatomical site, having demonstrated a better vertebral strength prediction of FEMs compared to a real BMD measured with DXA [41]. Recently, the authors have proposed a new DXA bone parameter, named BSI, based on lumbar and femur scan FEM analysis to improve fracture risk prediction, considering all features involved in bone strength [42][43][42,43]. The FEM analysis is conducted automatically by placing forces and constraints on a triangular mesh derived from bone segmentation performed on DXA software. For the lumbar site, each vertebra is loaded on the upper surface and constrained to the lower, as indicated in the scheme used by Colombo et al. [42]. Material properties of each triangle of the model are assigned following the experimental relations described by Morgan et al. at the lumbar site [44], whereas the force applied to the upper plate of the vertebra is calculated using the patient-specific model described in the study by Han et al. [45]. In the femoral area, the BSI algorithm is based on a condition of lateral fall, with constraints placed both on the head and the lower part of the shaft and with a subject-specific impact force (linked to the weight of the person) applied to the greater trochanter [46]. Since the BSI value is related to its resilience to withstand an applied load, it reflects bone strength. As explained in the introduction, mechanical resistance to fracture should consider different variables: stiffness, texture, geometry, deformation capability and fatigue. In Figure 1, for example, the stress of the femur during walking is compared to that of a tree branch on which a downward force is acting. By extension, with bone densitometry, two equally shaped trees made of different types of wood represent the same situation of two femurs having different BMD. On the other hand, branches with different sizes and shapes represent the case of two femurs with different geometry, that in DXA field can be described by HSA parameter, HAL and NSA. All these parameters combine to describe the status of a bone, individually and separately. Conversely, BSI describes the stress/strain situation of a specific bone, with a specific geometry and a specifically applied load and, looking at the previous example, can describe two different branches, with different wood (BMD), shape (bone geometry), and applied load (patient’s weight).
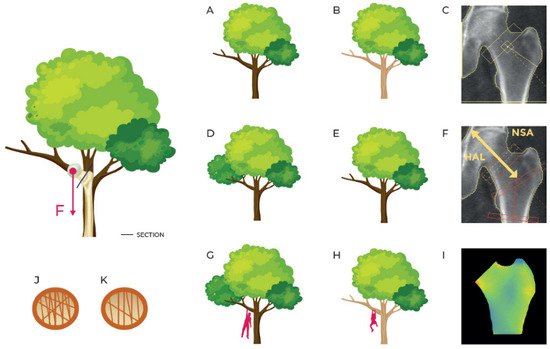
Figure 1. Simplification of the strain on the femur in a standing position or while walking comparing it with a tree with a force F acting on a branch. (A,B) describe the same branch with different material density (as inferred by BMD DXA scan represented in (C)); (D,E) describe the branches of the same material with different shape (as described by geometry parameters HSA and HAL in (F)); (G,H) describe different branches in different load situations (femurs with different BMD, different geometry and different applied load as represented in femoral BSI analysis in (I)); (J,K) describe different inner structures (concept similar to TBS even though TBS doesn’t apply to femur region).