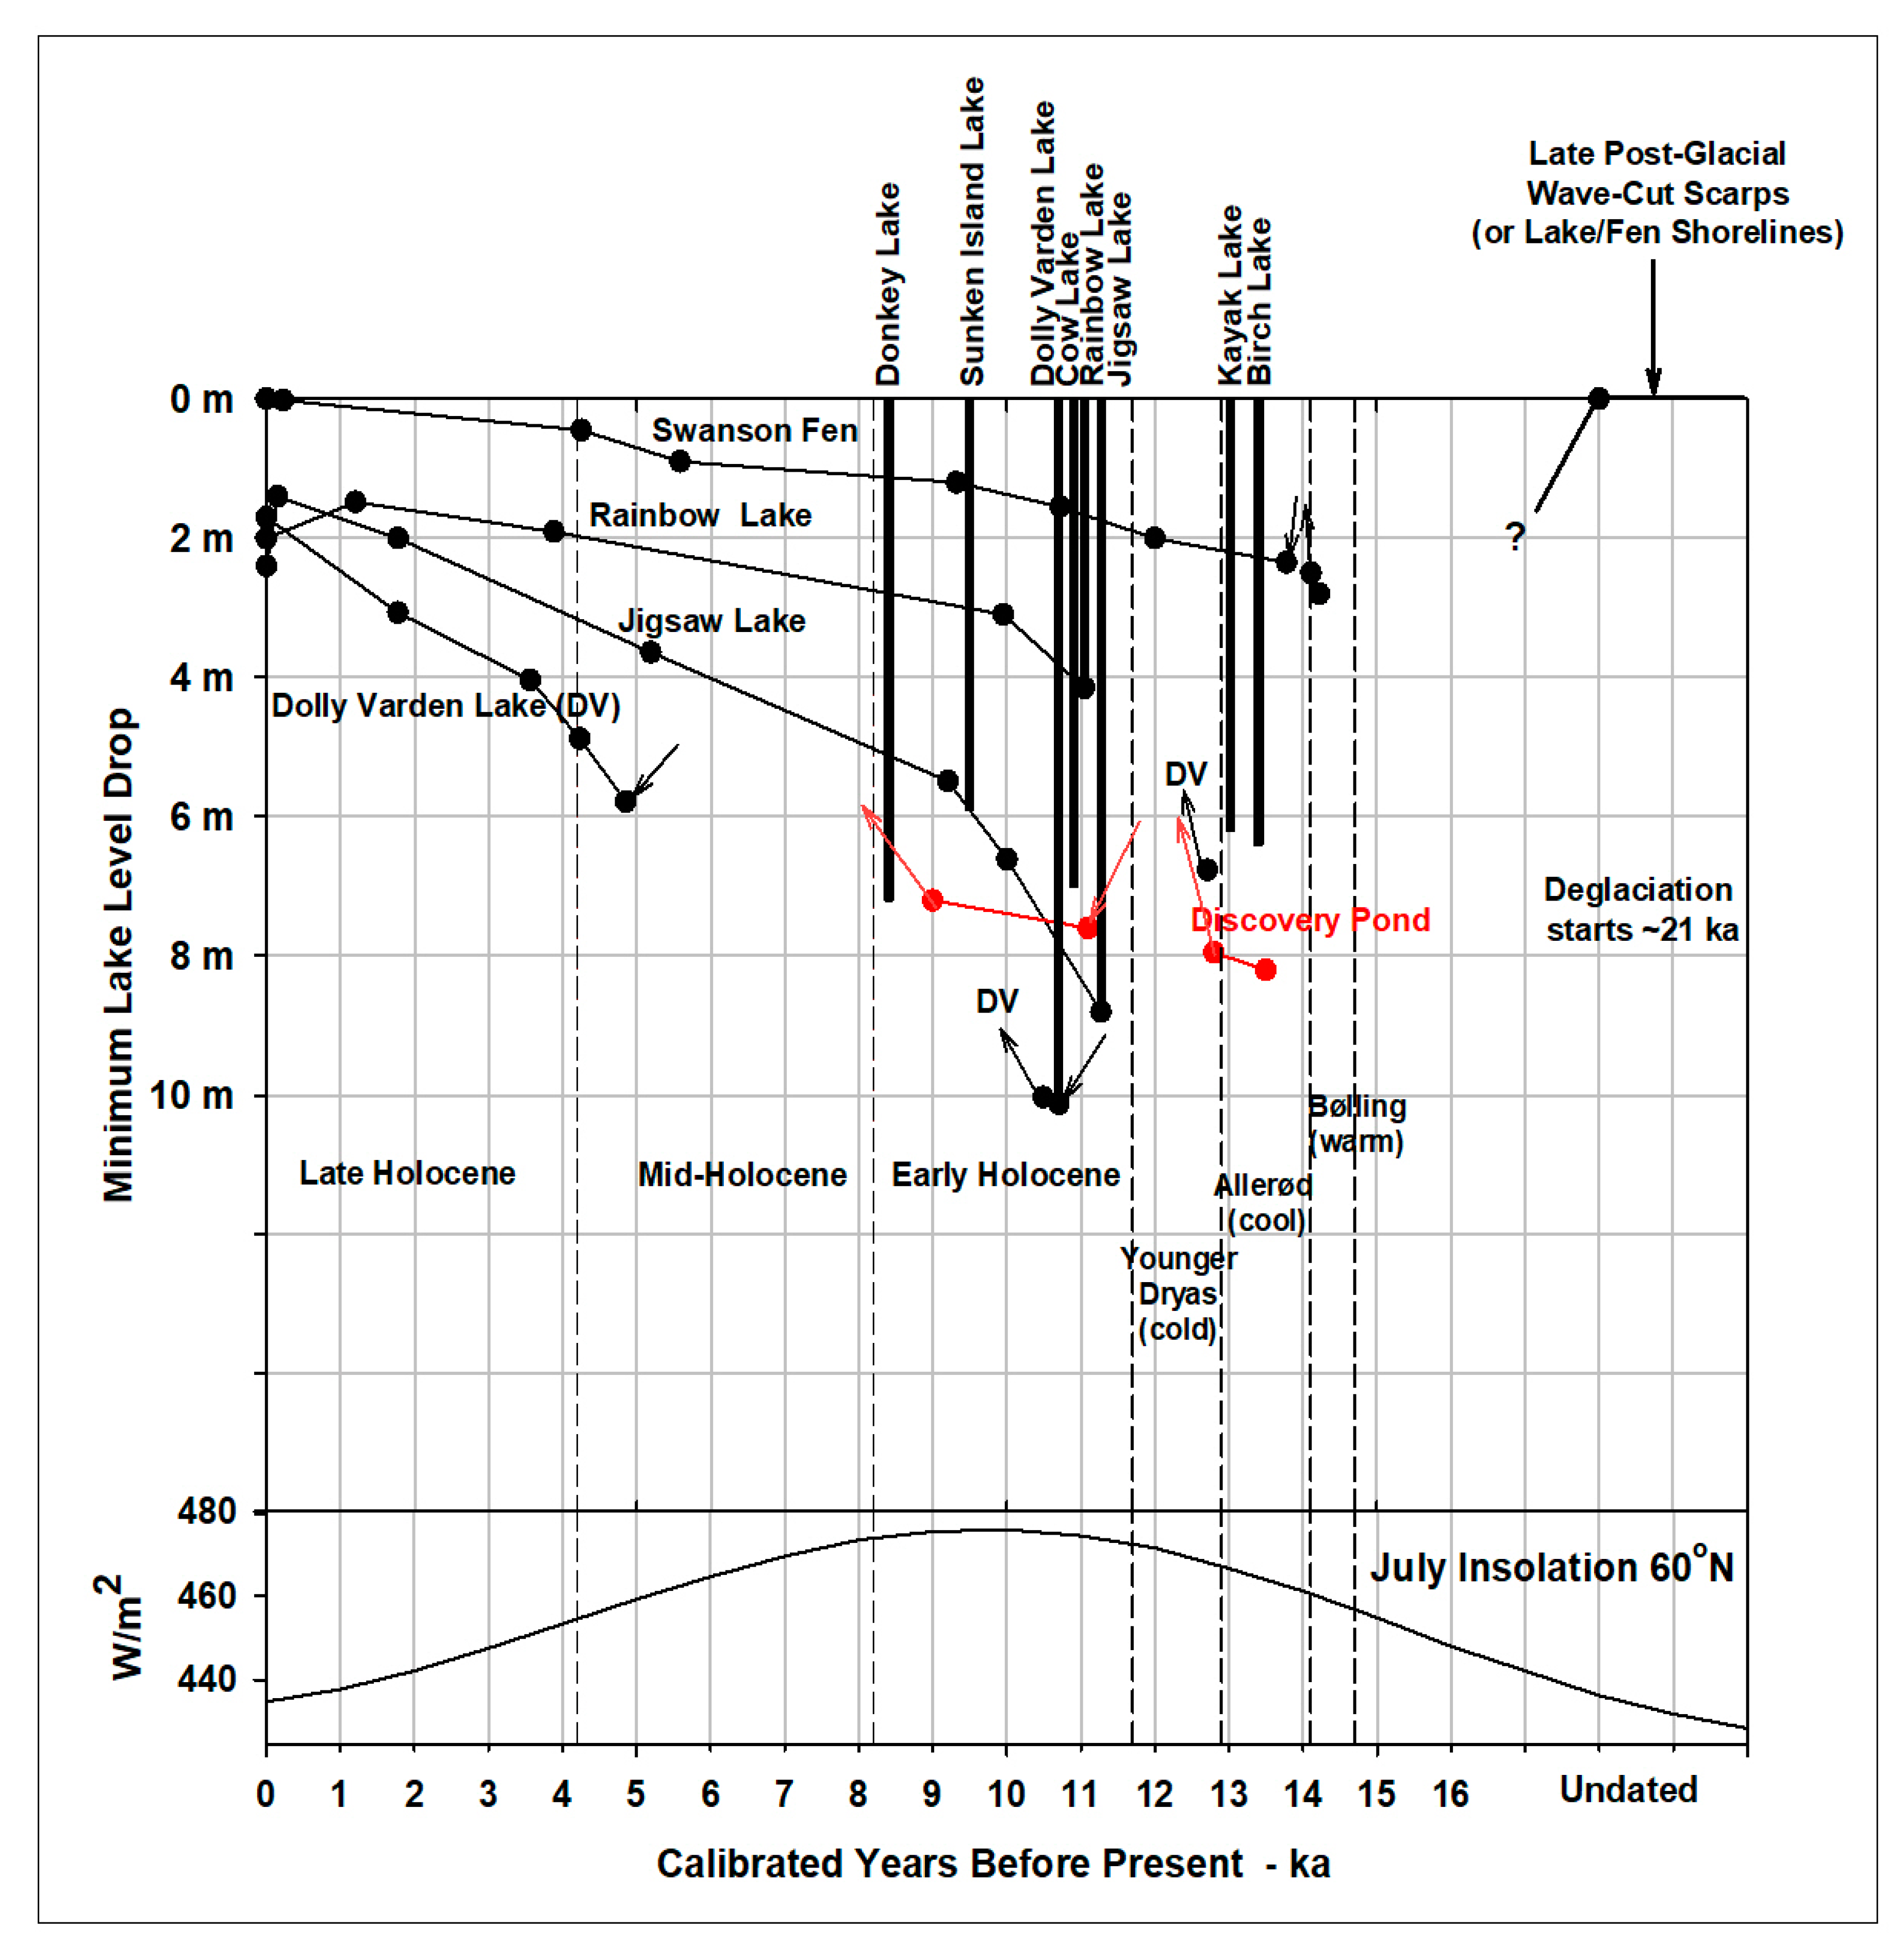
Figure 3. Summary chronology of central Kenai postglacial lake level variation. Lake level drops are measured below wave-cut scarps, which are typically several meters above modern lake levels. Lake level heights are estimated with respect to modern shorelines for Discovery Pond
[9] and Swanson Fen
[17], with the 12 ka date adjusted from 11.3 ka, following
[9]. Discovery Pond is shown in red for clarity. Climate periods follow
[59,60][37][38]. July insolation for 60° N is from
[61][39]. Black dots show radiocarbon dates; arrows show fall or rise of lake level. The label “DV” shows peat segments of the Dolly Varden core which are separated by gyttja.
4. Reconstructed Water Level Changes
WResearche
rs summarize water level changes in the regional lakes with a series of interpretive hydrographs showing the lake level chronologies as constrained by erosional features (wave-cut scarps and wave-washed terraces), terrestrial fen peats, and ice-shoved-ramparts. The hydrographs are superposed in a composite graphic with data from the literature (
Figure 3). Seven distinct phases of lake level history emerge out of this synthesis: (1) An initial wave-cut scarp-forming period, (2) a falling lake level period culminating in the lowest stands, (3) initial rising lake levels 15 to 11 ka, (4) early Holocene rising lake levels (first rapidly, then more slowly), (5) a mid-Holocene period of relatively dry conditions, (6) a late-Holocene period of still higher lake levels, (7) culminating in late 20th century declines.
(1) The WCS-forming period (21 to 19 ka). OuResearcher
s lake chronologies begin with the erosion of high-level shorelines of the ancestral lakes that first formed in these basins during the last major deglaciation. The lakes originated as part of a large kettle field that formed as rising temperature caused the stagnation and downwasting of a glacier that had advanced onto the Kenai Peninsula from across Cook Inlet. Buried ice was likely still present in many kettles at ~19 ka when waves began cutting scarps along lakeshores. The steepness of the WCSs indicates considerable fetch for wind-driven waves, which could not effectively be generated until most of the remnant glacial ice had cleared from the lake basins.
Although
wresearche
rs have not been able to directly date wave-cut scarps,
wethey hypothesize that the scarp-forming period coincides with the final stages of Moosehorn (late MIS 2) deglaciation.
OurThe earliest dates for deglaciation on the Kenai Lowland (21–19 ka) are from cosmogenic exposure dating of glacially transported granitic boulders near the study area
[62][40].
Modeling of southern Alaska climate at the terminal LGM (21 ka) suggests that summers were warmer, and that the AL was stronger in winter than it is today
[63,64][41][42]. A strong AL would advect moist winter air into southern Alaska from the Gulf of Alaska (GOA)
[4], providing snowfall for the Moosehorn ice sheets. Warm summers, however, would ultimately lead to melting these ice sheets.
(2) Falling lake level period (19 to 15 ka). Evidence of falling lake levels is represented by the shoulder aprons around closed-basin lakes. These aprons extend downward from the WCS shorelines, passing below modern lake levels to the depths of the adjoining satellite fens with terrestrial peat deposits. For example, at Jigsaw Lake, the falling period is represented by the slope that extends downward from 85 m asl scarp to 76 m asl. This lake level decline opened up 70% of the ancestral lake basin to vegetative colonization. Similar declines of 4 to 10 m occurred in all eight lakes examined and are one of the most striking features of these lake geomorphologies and their hydrological histories.
WResearche
rs suspect that these declines reflect a millennial-scale epoch of aridity in southern Alaska, caused by a cold SSTs in the GOA during the deglacial period. Sediment cores taken in the GOA and along the British Columbia coast show that NE Pacific waters were 4–5 °C colder between 19 and 14.7 ka than the early Holocene
[6]. These authors propose that SSTs fell in response to repeated deliveries of freshwater from Columbia River outburst floods, sourced from glacial Lake Missoula, as well as by meltwater from coastal glaciers. According to
[7], the late-glacial midlatitude jet stream carried North Pacific moisture into southwestern North America and supported large pluvial lakes, such as Lake Bonneville in Utah, leaving the Pacific Northwest relatively depauperate in moisture. At 14.7 ka, however, modeling by these authors suggests an abrupt reorganization of this circulation, starting with major melting of the Cordilleran and Laurentide icesheets, warming of the GOA SSTs, and shifting of moisture flow northward into the Pacific Northwest and southern Alaska.
(3) Initial rising lake levels (15 to 11 ka). By 14+ ka, the fen “peat recorders” were turned on, and lake levels had already risen sufficiently for satellite fens to begin accumulating peat. For most of the fens,
wresearche
rs interpret this stage as shallow standing water with graminoids, i.e., sedges and cottongrass. In all fens (except Dolly Varden, discussed below), once peat begins to accumulate, it continues to do so, commensurate with rising lake levels.
The oldest fen peats in
ourthe study area date to 14.2 ka (Swanson Fen, below), but the onset of peat accumulation varies over a 7 kyr interval (14.2 to 7.2 ka) at individual sites. The initial appearance of peat, or at least its preservation, seems to be controlled by site-specific factors. Even within a single lake basin, at Jigsaw Lake, the onset of peat accumulation in the nine satellite fens examined varies from 12.8 to 7.2 ka. Given that so many millennia can pass before effective peat accumulation begins at a site,
ourthe oldest satellite fens (Birch Lake 13.4 ka and Kayak Lake 13.0 ka) are likely distant minimum ages for rising lake levels.
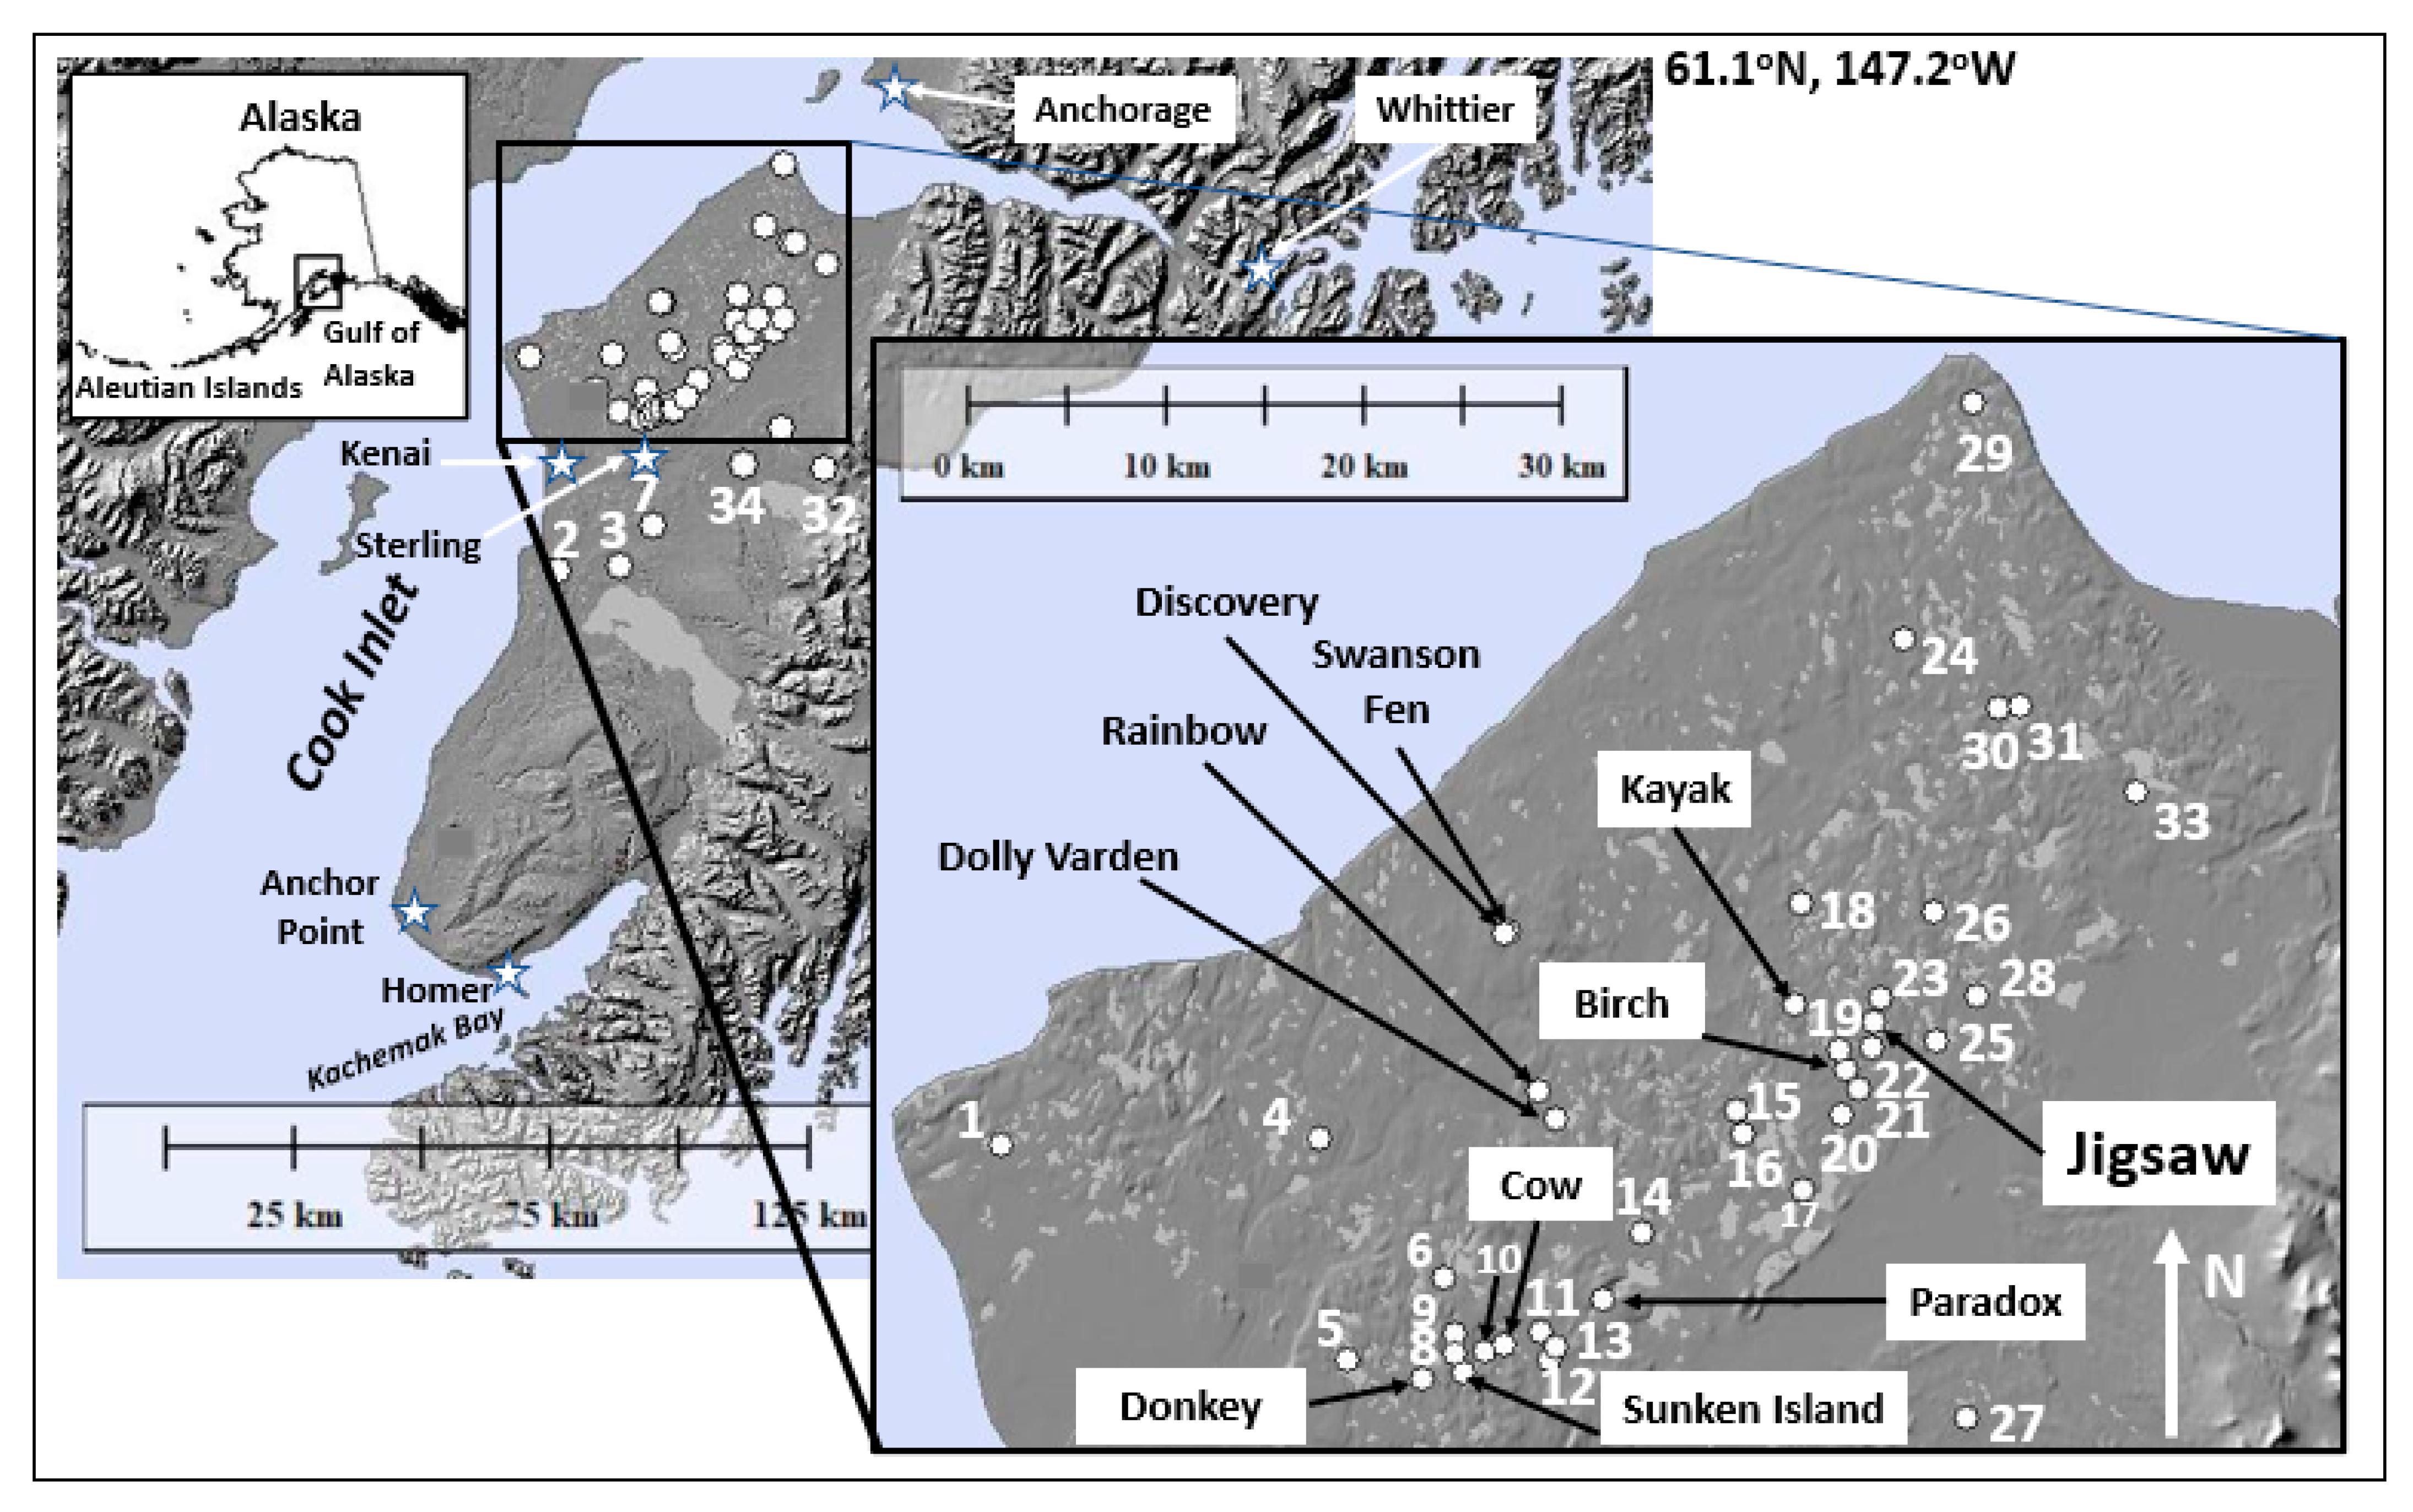
M. Chipman (pers. comm., 2020) analyzed a 3.5 m sediment core that bottomed in gyttja at Rainbow Lake; this core provided a diatom-based water-depth reconstruction that shows shallow water (~4 m depth) in Rainbow Lake at 13.2 ka. When the diatom- estimate water depth was added to accumulated sediment thicknesses, the combined records clearly indicate that lake level rise was underway by 13.2 ka. At Discovery Pond (
Figure 1 and
Figure 3), a rising water table deposited a peaty mud with fen macrophytes at 13.4 ka on top of a non-organic silt
[9]. Swanson Fen (240 m to the east of Discovery Pond) provides
ourthe oldest peat-based evidence of increasing effective moisture; in this basin, shallow-water pond sediments were deposited at 14.2 ka over a clay substrate and persisted until 14.0 ka, when brown moss peat began to accumulate
[17]. At 13.7 ka,
Chara is the first vegetation to appear at Horsetrail Fen, indicating the presence of shallow water; sedges and brown mosses followed shortly thereafter
[8,13][8][13].
Two processes were co-occurring during the deglacial period that could have increased effective moisture and lake levels in southern Alaska. First, the Bølling Interstade, a warm interval from 14.7 to 14.1 ka, originally described from Europe and the North Atlantic
[65][43], was coeval with and likely contributed to the warming of the GOA, described above. Second, Meltwater Pulse 1A (14.7 to 13.5 ka) was associated with rapidly rising sea level and flooding of the southwesternmost half of the Bering Platform
[66][44], which enlarged the source area for moisture coming into Alaska.
Opposing the increased moisture of a warm GOA and the flooding of the Bering Platform, Northern Hemisphere summer insolation was increasing from its low at 20 ka to its maximum at 10 ka (
Figure 3), with warmer summers tending to increase evaporative loss and reduce effective moisture. Regional climate modeling by
[67][45], however, indicates that sea-level rise was by far the dominant factor affecting the hydroclimate. In their 11 ka simulation, the flooded southwestern Bering Platform provides moisture for westerly winds onto the Kenai Peninsula that make October the wettest month, just as it is today. In this modeling study, the Kenai Peninsula shows a strong winter Aleutian Low south of the Aleutian Chain at 11 ka, with easterly winds every month with lower temperatures and heat fluxes, and greater precipitation, all of which imply low evapotranspiration, high effective moisture, and rising lake levels at 11 ka, in spite of near-maximum summer insolation.
(4)Early Holocene rising lake levels (11 to 8 ka). Lake level rise in
ourthe study area appears to be well underway in the early Holocene. This rise is especially striking at Jigsaw Lake, where peat began to accumulate by 10.4 ka on the lakeshore apron that was exposed by the 8.8 m post-LGM lake level decline. As noted, between 9 and 8 ka, some of this peat sloughed off in slabs or detritus, as wave action on the rising lake undercut the sandy substrate.
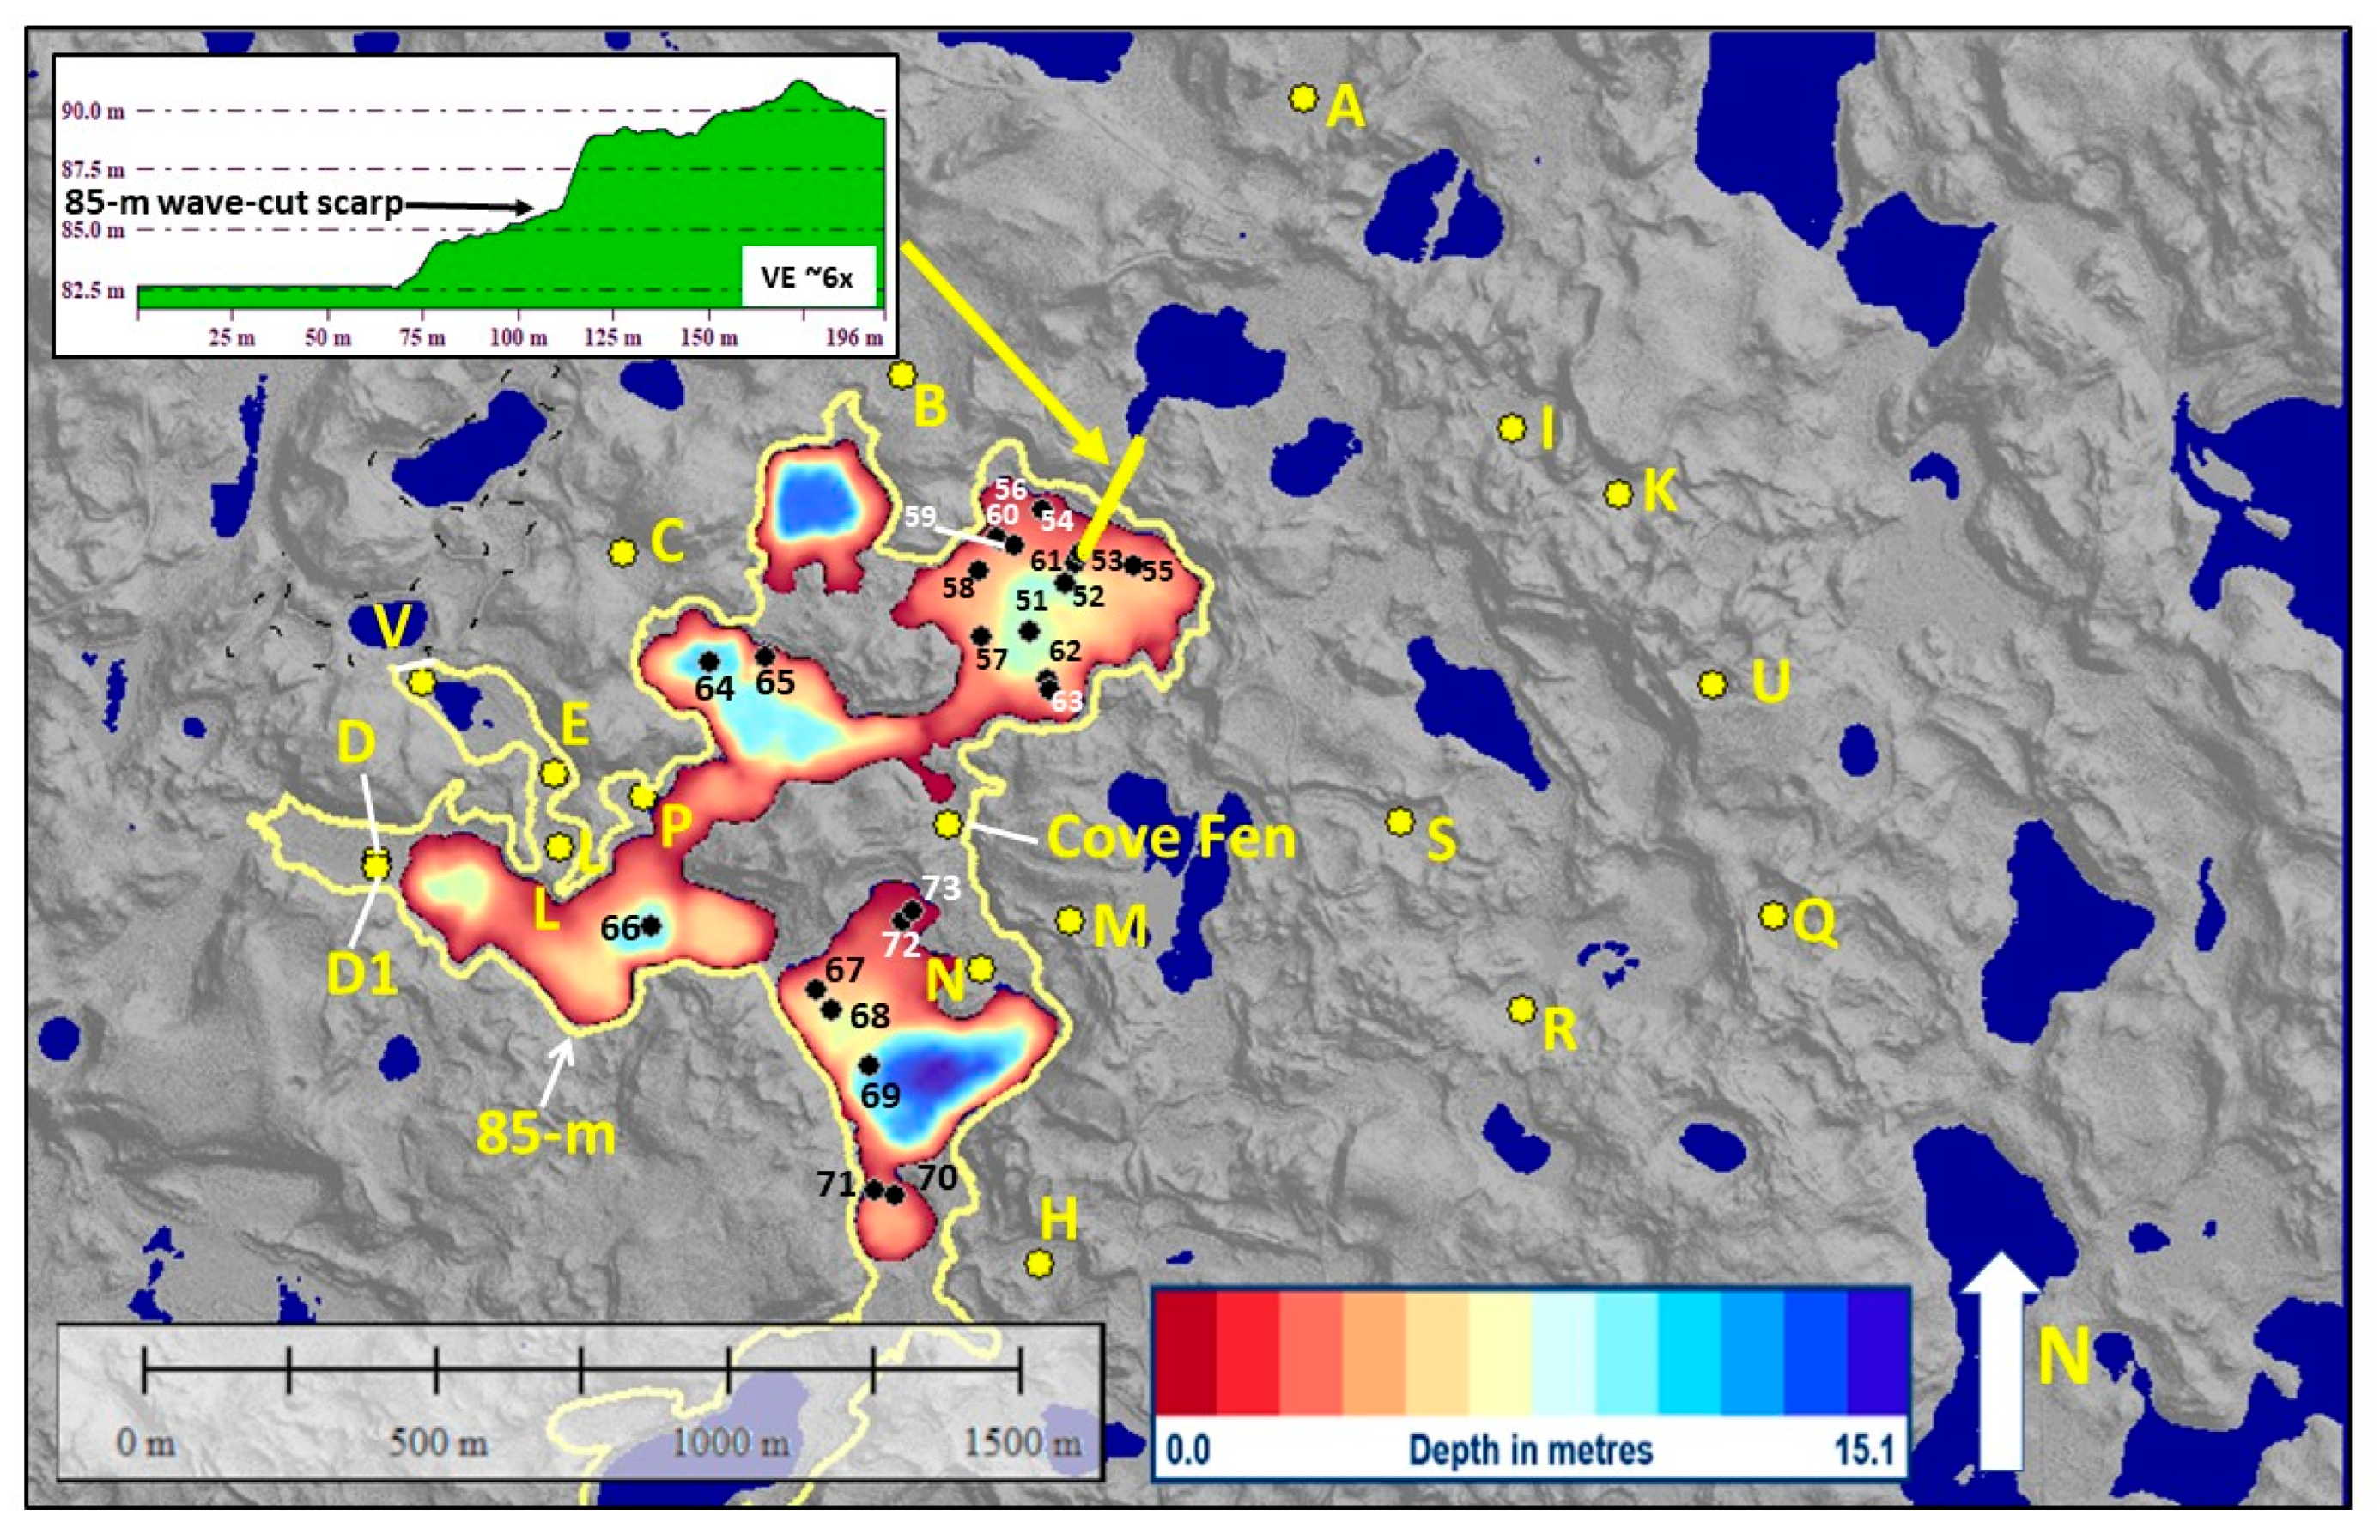
(5) Mid-Holocene reduced effective moisture (8 to 4.8 ka). By 8 ka, peat accumulation slows in Jigsaw Lake Fen D-D, and various
Sphagnum species are added to the graminoids (
Figure 7); at the Cove Fen, there is a sharp transition from graminoids to dry
Sphagnum fuscum at 7.9 ka. Jigsaw Lake Fens E-H all show
S. fuscum periods in the interval 9.2 to 4.8 ka, which could be interpreted either as the result of autogenic succession or a drier climate; at the Cove Fen, however, it is unlikely that a hummock-former such as
S. fuscum would be growing autogenically close to the lake surface (prior to 4.8 ka). A drier climate would be consistent with
[68][46], who argue for a negative PDO phase and/or a more La Niña-like Northeast Pacific during the mid-Holocene, on the basis of reduced biologic productivity in the GOA, and reduced effective moisture in SE Alaska, SW Yukon, and Interior Alaska. A midge-based July temperature reconstruction from Rainbow Lake showed 4 to 7 ka to be the warmest period in the Holocene
[18], reflecting the middle Holocene thermal maximum that is thought to have occurred in eastern Beringia
[69][47]. In
ourthe dataset, Dolly Varden Lake site B1 provides clear evidence of lake level decline, where gyttja deposition ceased by 4.9 ka and wet
Sphagnum (Section Sphagnum) moss established on the former lake bottom.
(6) Late-Holocene rising lake levels (4.8 ka to 20th century). Most of the Jigsaw Lake satellite fens suggest a second pulse of lake level rise in the late Holocene, in which the wet-to-dry trend is reversed, with dry
Sphagnum fuscum being replaced by graminoids and various wet
Sphagnum species. This dry-to-wet transition occurs at the Cove Fen (4.8 ka), Fen D-D1 (4. 1 ka), Fen C (3.3 ka), Fen P (2.5 ka) and Fen E (3.5 ka), but not at Fen H, which is mostly dry, nor at Fen L which is continuously wet. The dry-to-wet transition at Fen C (3.3. ka) occurred when the fen surface was ~4 m above the modeled Jigsaw Lake maximum water level. This suggests that Fen C was independently tracking the same climatic increase in effective moisture that was causing a rise in the Jigsaw Lake water level. The other late-Holocene dry-to-wet fens (Cove Fen, P and E) have their fen surfaces within ~1 m of the Fen D-D1 surface, which
wresearche
rs interpret as a fairly close approximation of the lake surface because of its very wet vegetation assemblage. This late-Holocene rising lake level phase is also seen in sediment core #59-Upper with peat sloughing into the lake at 4.8 ka, and likewise in core #60 at 4.4 ka. At Kelly Lake (25 km south of Jigsaw Lake), a diatom record suggests that the lake level rose to near or above its modern level by 5 ka
[16].
Episodic late-Holocene high stands (5 ka to 20th century). The late-Holocene high stands of Kenai Lowland lakes are clearly represented by well-developed ISRs, mostly placed 1–7 m above modern lake levels. The ISRs
wresearche
rs examined typically record multiple shove events within a given rampart, showing that once an ISR is emplaced, it serves as a backstop for future shove events near the same level. The long age range of some ramparts indicates that the lake levels have not risen above the rampart since the first recorded shove event.
WeResearchers interpret these events as episodic extremes because
wethey have not found stratigraphic evidence (such as gyttja, textural, or plant species changes) at correlative dates in nearby peat cores.
WeResearchers assume that the ramparts are formed during spring break-up with snowmelt high water and strong winds that drive ice pans onto the beach, bulldozing up shallow lake sediments. If high water persisted into the summer, the ramparts would be eroded by wave action before the next winter. The relatively young ISR dates (<5.2 ka, with many <2.4 ka) are consistent with large late-Holocene lake level rises which probably eroded or submerged older ISRs.
There is abundant evidence that the late Holocene was a climatically dramatic period in the NE Pacific and southern Alaska. The climate appears to have become more El Niño-like with a positive PDO pattern, and a strong eastward AL
[68][46], which would bring more moisture from the Gulf of Alaska. The shift to a strong AL is evidenced by an
18O record from Sunken Island Lake that shows an abrupt ~2‰ increase in δ
18O between 5.5 and 4.5 ka (isotopes measured on biological silica)
[20]; similarly, an increase of 8‰ from 3 to 0.6 ka was observed at Horsetrail Fen (isotopes measured on total organic matter)
[13].
Increased moisture at this time is suggested by a sharp decline in fire frequency from the early- and mid-Holocene mean of 12 to 8 fires/1000 yrs during the late Holocene, as determined from sedimentary charcoal at Paradox Lake (
Figure 1)
[14]. Increased snowfall associated with the strong AL likely supported the Neoglacial advances recorded in the Kenai Mountains at 3.6 ka, 600 A.D., and during the Little Ice Age, from 1300 to 1850 A.D.
[70][48]. Strong ALs can provide the early spring winds necessary for large ISRs to form. The North Pacific (NP) index of measures the strength of the AL
[2]; on the Kenai Peninsula, March-May E-W zonal winds correlate with the NP at r = 0.8 and N-S meridional winds at r = 0.3
[71][49]. The concentration of ISRs within the last 2.4 kyrs is striking, especially considering that only the most landward (oldest) ramparts were sampled. The presence of ramparts older than 2.4 ka at 9 of the 15 lakes suggests that the period of 0–2.4 ka was not accompanied by higher lake levels, which would have removed the older ramparts, but possibly had stronger spring wind events. This increased storminess is consistent with work along the outer coast of the GOA using traumatic resin ducts in tree-rings to infer increased winter storminess
[72][50] and combined ice core studies from Denali and Mt. Logan that show an increase in the strength of the AL starting in the mid-18th century
[73][51].
(7) 20th-century lake level drops. A general reduction in effective moisture (calculated as annual P-PET) on the order of 60% occurred in the central Kenai Peninsula after the 1968–1969 drought
[12], with subsequent wetland drying and extensive invasion by black spruce and dwarf birch
[74][52], as well as the occurrence of drought stress in trees and a massive spruce beetle outbreak
[75,76][53][54]. Lake levels dropped by ~1 m or more in many lakes by the 1990s, especially in closed-basin lakes (E.E. Berg, pers. obs.). These moisture deficit effects are especially pronounced on the western Kenai Lowland because of the strong rainshadow created by the Kenai Mountains, but they may also be an expression of the general pattern of climate change now underway in southern Alaska
[77,78][55][56].
5. Comparison with Interior Alaska
Two studies from Interior Alaska provide an interesting contrast to
ourthe study in southern coastal Alaska. Birch Lake (on the Richardson Highway, hereafter “Birch-R”)
[79][57] and Harding Lake
[80][58] are situated on the unglaciated Tanana River floodplain, north of the Alaska Range. These studies used lake sediment characteristics to estimate lake level elevations. Both lakes experienced substantial lake level rise at the end of the LGM at 16–15 ka, which is consistent with many studies
[81][59] indicating that the Lateglacial was both warm and wet north of the Alaska Range. Surprisingly, both lakes showed substantial (>10–15 m) drawdowns sometime after 14 ka, contrary to
ourthe Kenai records, which indicate increasing effective moisture after 14.2 ka. The low stand at Birch-R occurred at ~13.7–12.0 ka; the lake rose to its modern overflow level by ~9.8 ka. Harding Lake showed similar low or fluctuating levels between 14 and 9.4 ka, when it rose to its modern level. Examples of other Interior lakes are reviewed in
[69][47], all of which show higher/rising lake levels around 9 ka.
The LGM-Lateglacial-Holocene transition in Interior Alaska was strongly influenced by the retreating Laurentide icesheet, increasing summer insolation, and especially the flooding of the Bering Platform
[66][44].
WResearche
rs suggest, in contrast, that southern Alaska was most strongly affected by the Bolling warming of the GOA after 14.7 ka
[6], which brought a flow of moisture into southern Alaska that kept lake levels generally high thereafter. Moisture flow into the Interior increased but also became much more variable when the Bering Sea became available as a moisture source
[7,67][7][45] The Lateglacial drawdowns at Birch-R and Harding Lakes in the Interior are likely an expression of this variability.