The expansion of ICT has led to higher electricity consumption due to the increase in ICT terminal devices, networks, and large-scale data centers, resulting in an increase in power consumption. Data centers, in particular, contain IT hardware, such as computers and data storage devices; various types of network equipment for communication (routers, switches, modems, etc.); and heating and cooling infrastructure. The energy used by data centers is 10–100 times that compared to the amount used by commercial buildings in the same area. According to UNEP and DTU, the amount of electricity consumed by data centers in 2018 corresponded to 1% of the global electricity demand, but it is expected to account for more than 20% of the total electricity demand in 2030. If ICT electricity consumption increases at the current rate, it will have a negative impact on reducing CO2 emissions. In other words, the expansion of ICT equipment supply accompanies the demand for electricity in terms of use, which leads to an increase in CO2 emissions.
1. Introduction
Information and communication technology is at the core of the modern knowledge-based society. ICT innovation has been advancing at an unprecedented pace, and worldwide ICT usage has increased rapidly in recent years.
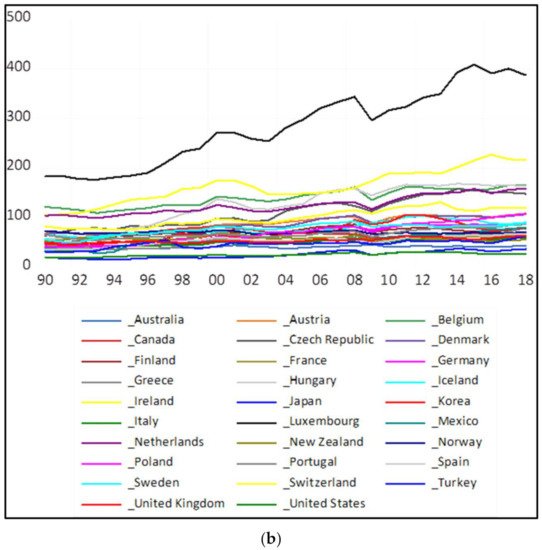
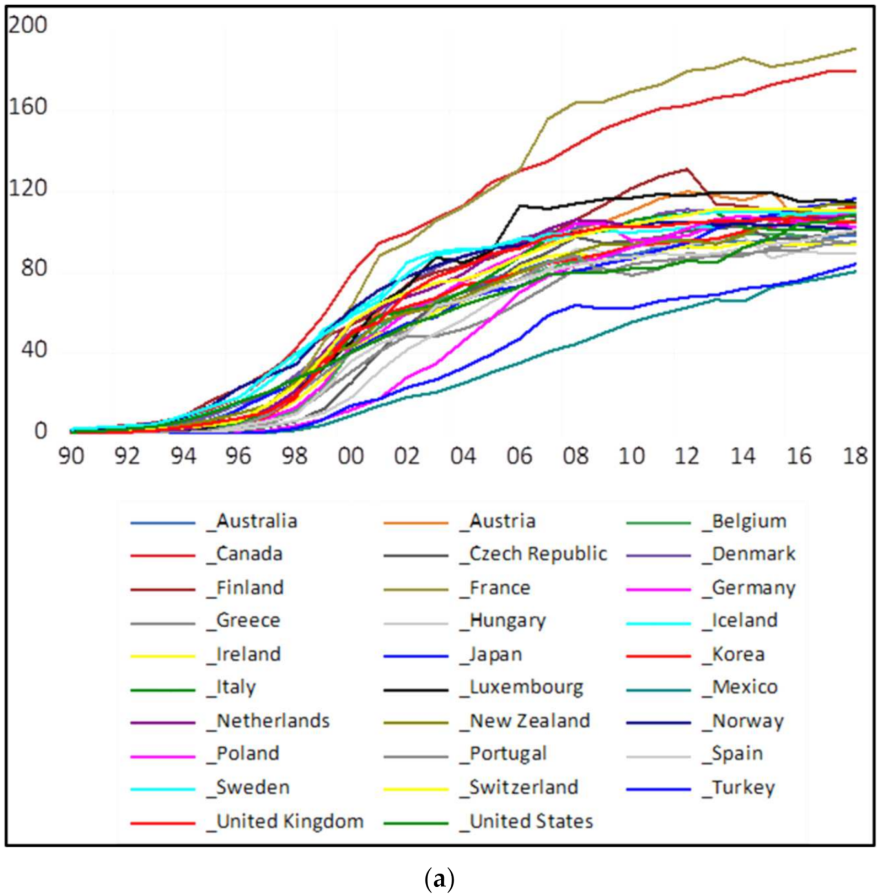
According to World Bank’s Data Bank [1], only 0.23% of the total population of the Organization for Economic Cooperation and Development (OECD) used the Internet in 1990, but this increased to 83.24% in 2018. Furthermore, the number of mobile cellular subscriptions (per 100 people) was only 0.96 in 1990, but it increased rapidly to 121.35 in 2018. Figure 1
a illustrates the weighted average of individuals using the Internet per 100 people and mobile cellular subscriptions per 100 people for each selected OECD member country. Although there are differences by country, this generally indicates that the penetration of the Internet and mobile phones has increased rapidly over the past 38 years. These two indicators are evaluated to assess the development of ICT.
) The weighted average of individuals using the Internet per 100 people and mobile cellular subscriptions per 100 people by country. (
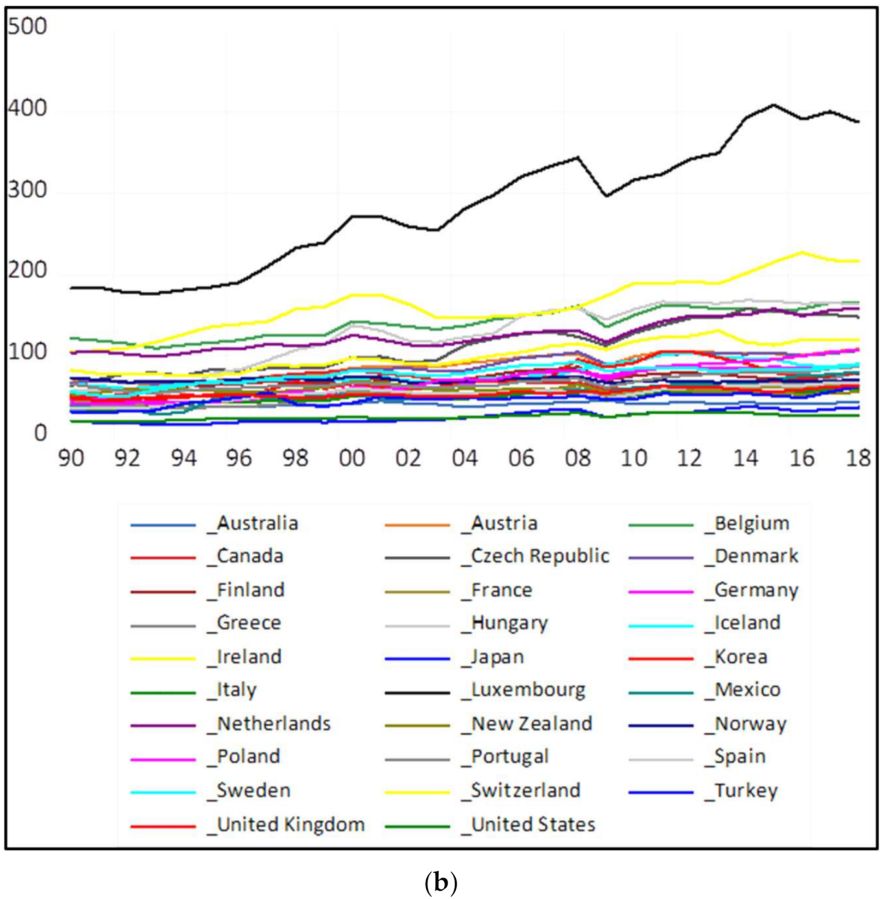
) Trade openness (the sum of exports and imports divided by the GDP (%)) by country.
However, the expansion of ICT has led to higher electricity consumption due to the increase in ICT terminal devices, networks, and large-scale data centers, resulting in an increase in power consumption. Data centers, in particular, contain IT hardware, such as computers and data storage devices; various types of network equipment for communication (routers, switches, modems, etc.); and heating and cooling infrastructure. The energy used by data centers is 10–100 times that compared to the amount used by commercial buildings in the same area. According to UNEP and DTU [2], the amount of electricity consumed by data centers in 2018 corresponded to 1% of the global electricity demand, but it is expected to account for more than 20% of the total electricity demand in 2030. If ICT electricity consumption increases at the current rate, it will have a negative impact on reducing CO2 emissions. In other words, the expansion of ICT equipment supply accompanies the demand for electricity in terms of use, which leads to an increase in CO2 emissions.
Conversely, despite the increase in energy consumption due to ICT systems, energy efficiency can be improved by using ICT. The development of ICT can contribute to electricity demand and GHG reduction in various aspects. According to Malmodin and Bergmark [3], under the high reduction potential scenario (HRS), approximately 8 gigatons of CO2 can be reduced using ICT in the electricity and service sectors, which constitutes 12.4% of the 63.5 gigatons worth of expected emissions in 2030. These technologies include smart grids, smart buildings, smart transportation, smart work, smart travel, and smart services. Currently, these technologies are still under development, as are some commercialized technologies.
Therefore, it is necessary to empirically analyze the relationship between ICT and CO2 emissions based on past data to determine the influence of ICT on the reduction in greenhouse gas (GHG) emissions.
Previous empirical studies so far have shown contradictory results depending on the study subject. Some studies have shown that ICT usage improved environmental quality by reducing CO2 emissions (Higón et al. [4], Lu [5], Ozcan and Apergis [6], Haseeb et al. [7], Faisal et al. [8], Zhang and Liu [9], Usman et al. [10], Nguyen et al. [11], and Asongu [12]). Other studies have shown that ICT usage deteriorated environmental quality by increasing CO2 emissions (Park et al. [13], Lee and Brahmasrene [14], Salahuddin et al. [15], Asongu et al. [16], Danish et al. [17], Amri [18], Shehzad [19], Raheem et al. [20], Magazzino et al. [21], Avom et al. [22], and Alataş [23]).
2. Information and Communication Technology and CO2 Emissions
shows the previous studies that have analyzed the effects of ICT on CO2 emissions by region since 2016. These studies show mixed results according to the analyses’ target countries, method, period, and level of economic development. Some multi-country panel studies have shown that the increase in ICT usage contributes positively to the improvement of environmental quality by reducing CO2 emissions through the achievement of energy efficiency (Higón et al. [4], Lu [5], Ozcan and Apergis [6], Haseeb et al. [7], and Faisal et al. [8]). Higón et al. [4] investigated the relationship between ICT and CO2 emissions for 142 economies (116 developing and 26 developed countries) from 1995 to 2010. Their empirical results showed that ICT positively contributed to the reduction in CO2 emissions beyond a threshold level of ICT. Lu [5] investigated the effects of ICT, energy consumption, economic growth, and financial development on CO2 emissions in 12 Asian countries for the period 1993–2013 using fully modified ordinary least squares (FMOLS). ICT had a significantly negative effect on CO2 emissions and was reported to have become an important strategy to mitigate CO2 emissions in those countries. Ozcan and Apergis [6] analyzed the effect of Internet use, employed as a proxy for ICT on CO2 emissions for 20 emerging economies for the period 1990–2015. They found that increased Internet access resulted in CO2 emissions. Haseeb et al. [7] examined the impact of ICT (i.e., Internet usage and mobile cellular subscriptions), globalization, electricity consumption, financial development, and economic growth on CO2 emissions for the BRICS economies for the period of 1994–2014. Their results confirmed that ICT reduced CO2 emissions in the long run and positively contributed to environmental quality. Faisal et al. [8] examined the effects of electricity consumption, financial development, economic growth, trade, and ICT on CO2 emissions in fast-emerging countries. There is a study on a single country in which the result showed that ICT leads to a CO2 reduction. Zhang and Liu [9] demonstrated a positive contribution of ICT to the industrial sector in reducing CO2 emissions using Chinese regional data from 2000 to 2010 and the panel data method. Furthermore, Usman et al. [10] found that ICT resulted in CO2 reduction in India by reducing energy consumption. Nguyen et al. [11] found that there was a negative relationship between ICT and CO2 emissions in selected G20 countries. According to Asongu [12], ICT could be employed to dampen the potentially negative effect of globalization on CO2 emissions in 44 Sub-Saharan African countries.
Other multi-country panel studies have shown that an increase in ICT usage damages the environment by releasing a massive amount of CO2 emissions (Park et al. [13], Lee and Brahmasrene [14], Salahuddin et al. [15], Asongu et al. [16], and Danish et al. [17]). Park et al. [13] investigated the impact of Internet use, financial development, economic growth, and trade openness on CO2 emissions in selected European Union (EU) countries for the period of 2001–2014. They found that ICT increases CO2 emissions and threatens sustainable development. Lee and Brahmasrene [14] examined relationships among ICT, CO2 emissions, and economic growth for nine members of the Association of Southeast Asian Nations (ASEAN) from 1991 to 2009. Their results showed that ICT had significant positive effects on CO2 emissions. Salahuddin et al. [15] estimated the short- and long-run effects of Internet usage and CO2 emissions on OECD countries for the period of 1991–2012. Their result indicated a significant positive relationship between Internet usage and CO2 emissions in OECD countries in the long run, which implies that the rapid growth in Internet usage is still an environmental threat for the region. Asongu et al. [16] investigated how ICT complemented globalization to influence CO2 emissions in 44 Sub-Saharan African countries over the period 2000–2012. They found that ICT can be employed to dampen the potentially negative effects of globalization on CO2 emissions. Danish et al. [17] investigated the nexus between ICT, economic growth, financial development, and CO2 emissions in emerging economies to show that ICT increased the level of CO2 emissions in emerging economies. Other studies on a single country also showed that ICT has little effect on CO2 reduction (Amri [18] and Shehzad [19]). Armi [18] examined the relationship between CO2 emissions, total factor productivity, ICT, trade, financial development, and energy consumption in Tunisia from 1975 to 2014. His result showed an insignificant impact of the ICT variable on CO2 emissions. Shehzad [19] investigated the nexus between climate change and ICT development in Pakistan and evaluated the impact of ICT investment and ICT goods trade on CO2 emissions. Their result indicated that investment in ICT could increase CO2 emissions. In addition, research suggesting that ICT increases CO2 emissions includes Raheem et al. [20], Magazzino et al. [21], Avom et al. [22], and Alataş [23].
Previous Panel Studies on ICT and CO2 emissions.
| |
Regions |
Periods |
Methods |
Signs of ICT Variable on CO2 Emissions |
| Higón et al. [4] |
116 developing and 26 developed countries |
1995–2010 |
Pooled Ordinary Least Squares
Driscoll–Kraay Fixed
Effects model
Instrumental variable Fixed Effect model |
Negative |
| Lu [5] |
12 Asian countries | 1 |
1993–2013 |
Pedroni cointegration test |
Negative |
| Ozcan and Apergis [6] |
20 emerging economies | 2 |
1990–2015 |
MG estimator GM FMOLS |
Negative |
| Haseeb et al. [7] |
BRICS countries | 3 |
1994–2014 |
FMOLS and DSUR |
Negative |
| Faisal et al. [8] |
Fast emerging countries | 4 |
1993–2014 |
FMOLS, DOLS, robust least square |
Negative |
| Zhang and Liu [9] |
China |
2000–2010 |
STIRPAT |
Negative |
| Park et al. [13] |
EU countries | 5 |
2001–2014 |
MG estimator |
Positive |
| Lee and Brahmasrene [14] |
ASEAN countries | 6 |
1991–2009 |
FMOLS
Canonical Cointegrating Regression
Dynamic OLS |
Positive |
| Salahuddin et al. [15] |
OECD countries | 7 |
1991–2012 |
PMG, DOLS, FMOLS |
Positive |
| Asongu et al. [16] |
44 countries in Sub-Saharan Africa |
2000–2012 |
Generalized Method of Moments |
Insignificant |
| Danish et al. [17] |
11 countries | 8 |
1990–2014 |
MG estimator |
Positive |
| Amri [18] |
Tunisia |
1975–2014 |
ARDL |
Insignificant |
| Shehzad [19] |
Pakistan |
1990–2018 |
STIRPAT and ARDL |
Positive |
Brazil, India, China, and South Africa.
Brazil, Chile, China, Colombia, the Czech Republic, Egypt, Hungary, Indonesia, India, Greece, Mexico, Malaysia, Peru, the Philippines, Poland, Russia, South Africa, South Korea, Thailand, and Turkey.
Austria, Belgium, Bulgaria, Croatia, Cyprus, the Czech Republic, Denmark, Finland, France, Germany, Greece, and Hungary, Ireland, Italy, Luxembourg, the Netherland, Poland, Portugal, Romania, Slovenia, Spain, Sweden, and the UK.
Brazil, Chile, China, Colombia, the Czech Republic, Egypt, Hungary, Indonesia, India, Greece, Mexico, Malaysia, Peru, the Philippines, Poland, Russia, South Africa, South Korea, Thailand, and Turkey.
Australia, Hong Kong, Japan, India, Indonesia, Korea, Malaysia, Philippines, Singapore, Thailand, and Turkey.
Brazil, China, Russia, India, and South Africa.
This study differs from previous studies in several ways. First, the subjects of analysis were OECD countries. Since these countries are generally classified as high-income countries, they are relatively active in addressing climate change policies. Understanding the GHG characteristics of these countries can help establish policies to address climate change in the future. Common characteristics of the OECD countries are that their levels of ICT are higher those in other countries and that they are leaders in related ICT usage. Therefore, it is important to analyze the influence of various factors on CO2 emissions in OECD countries. Although Salahuddin et al. [15] analyzed OECD countries, their study has limited relevance, as the analysis period was 10 years prior, and the recent changes in ICT were not reflected.
Second, the supply of renewable energy in OECD countries has gradually increased since 2000. Renewable energy has been an efficient and reliable means of reducing CO2 emissions. Recently, there were several studies on the role of renewable energy in mitigating CO2 emissions. Recent previous studies include Menyah and Wolde_Rufael [24], Apergis et al. [25], Shafiel and Salim [26], Jaforullah and King [27], Bilgili et al., [28], Dogan and Seker [29], Ito [30], Zoundi [31], Jebli et al. [32], Dong et al. [33], and Inglesi-Lotz and Dogan [34]. Most of these previous studies have shown that renewable energy has significantly contributed to the mitigation of CO2 emissions. However, previous empirical models for the impact of ICT on CO2 emissions do not sufficiently reflect the effects of these renewable energy sources. Specifically, Salahuddin et al. [15] also did not consider the effect of renewable energy on the GHG emissions in the context of OECD countries. Therefore, this study considered renewable electricity as a factor influencing CO2 emissions.
Third, economic growth was included as an important factor influencing CO2 emissions in most previous studies. However, although trade openness was included as a factor affecting CO2 emissions in some previous studies (Park et al. [13], Faisal et al. [8], Ozcan [6], Armi [18], and Shehzad [19]), there are other studies where it was not included as a factor influencing CO2 emissions (Haseeb et al. [7], Lu [5], Lee and Brahmasrene [14], Higón et al. [4], and Zhang and Liu [9]). Even studies that included trade openness as a factor influencing CO2 emissions may or may not be statistically significant. As shown in Bangladesh, Egypt, Indonesia, Iran, South Korea, Mexico, Nigeria, Pakistan, Philippines, Turkey, and Vietnam.
This entry differs from previous studies in several ways. First, the subjects of analysis were OECD countries. Since these countries are generally classified as high-income countries, they are relatively active in addressing climate change policies. Understanding the GHG characteristics of these countries can help establish policies to address climate change in the future. Common characteristics of the OECD countries are that their levels of ICT are higher those in other countries and that they are leaders in related ICT usage. Therefore, it is important to analyze the influence of various factors on CO2 emissions in OECD countries. Although Salahuddin et al. [15] analyzed OECD countries, their study has limited relevance, as the analysis period was 10 years prior, and the recent changes in ICT were not reflected.
Second, the supply of renewable energy in OECD countries has gradually increased since 2000. Renewable energy has been an efficient and reliable means of reducing CO2 emissions. Recently, there were several studies on the role of renewable energy in mitigating CO2 emissions. Recent previous studies include Menyah and Wolde_Rufael [24], Apergis et al. [25], Shafiel and Salim [26], Jaforullah and King [27], Bilgili et al., [28], Dogan and Seker [29], Ito [30], Zoundi [31], Jebli et al. [32], Dong et al. [33], and Inglesi-Lotz and Dogan [34]. Most of these previous studies have shown that renewable energy has significantly contributed to the mitigation of CO2 emissions. However, previous empirical models for the impact of ICT on CO2 emissions do not sufficiently reflect the effects of these renewable energy sources. Specifically, Salahuddin et al. [15] also did not consider the effect of renewable energy on the GHG emissions in the context of OECD countries. Therefore, this entry considered renewable electricity as a factor influencing CO2 emissions.
Third, economic growth was included as an important factor influencing CO2 emissions in most previous studies. However, although trade openness was included as a factor affecting CO2 emissions in some previous studies (Park et al. [13], Faisal et al. [8], Ozcan [6], Armi [18], and Shehzad [19]), there are other studies where it was not included as a factor influencing CO2 emissions (Haseeb et al. [7], Lu [5], Lee and Brahmasrene [14], Higón et al. [4], and Zhang and Liu [9]). Even studies that included trade openness as a factor influencing CO2 emissions may or may not be statistically significant. As shown in Figure 1b, most OECD countries are very open to trade and show increasing trends. Therefore, in this study, trade openness was included and analyzed as a factor affecting CO2 emission.
Fourth, in terms of analysis methods, the mean group (MG) estimator and FMOLS were mainly used in the existing panel analyses. However, this study used the pooled mean group (PMG) in line with Salahuddin et al. [15]. The pooled-mean-group (PMG) estimator of Pesaran et al. [35] assumes a common long-run equilibrium relationship across countries, allowing country-specific short-run dynamics. Furthermore, the PMG estimators are consistent and asymptotically normal when the regression variables are I(0) and I(1). Therefore, through this methodology, it is possible to identify the common characteristics of the OECD countries.
b, most OECD countries are very open to trade and show increasing trends. Therefore, in this entry, trade openness was included and analyzed as a factor affecting CO2 emission.
Fourth, in terms of analysis methods, the mean group (MG) estimator and FMOLS were mainly used in the existing panel analyses. However, this entry used the pooled mean group (PMG) in line with Salahuddin et al. [15]. The pooled-mean-group (PMG) estimator of Pesaran et al. [35] assumes a common long-run equilibrium relationship across countries, allowing country-specific short-run dynamics. Furthermore, the PMG estimators are consistent and asymptotically normal when the regression variables are I(0) and I(1). Therefore, through this methodology, it is possible to identify the common characteristics of the OECD countries.