Hepatocellular carcinoma is the most common primary liver malignancy in the United States. Macrophages are immune cells that play a critical role in the promotion of cancer growth and configuration of the hepatic microenvironment. Studying intrahepatic macrophages is challenging because they are difficult to isolate, they transform their phenotype upon manipulation, and in vivo animal models poorly replicate the liver microenvironment. Understanding the complexity of intrahepatic macrophage populations is crucial because they coordinate antitumoral immunity. Application of novel methods that can detect immune cell phenotypes, along with their spatial co-localization in situ is critical and timely.
- cancer
- CyTOF
- HCC
- liver
- macrophages
- spectral imaging
- DSP
- Cancer
- TAMs
- scRNA-seq
1. Introduction
2. Multiplex Immunofluorescen Staining Technique Followed by Multispectral Imaging Analysis
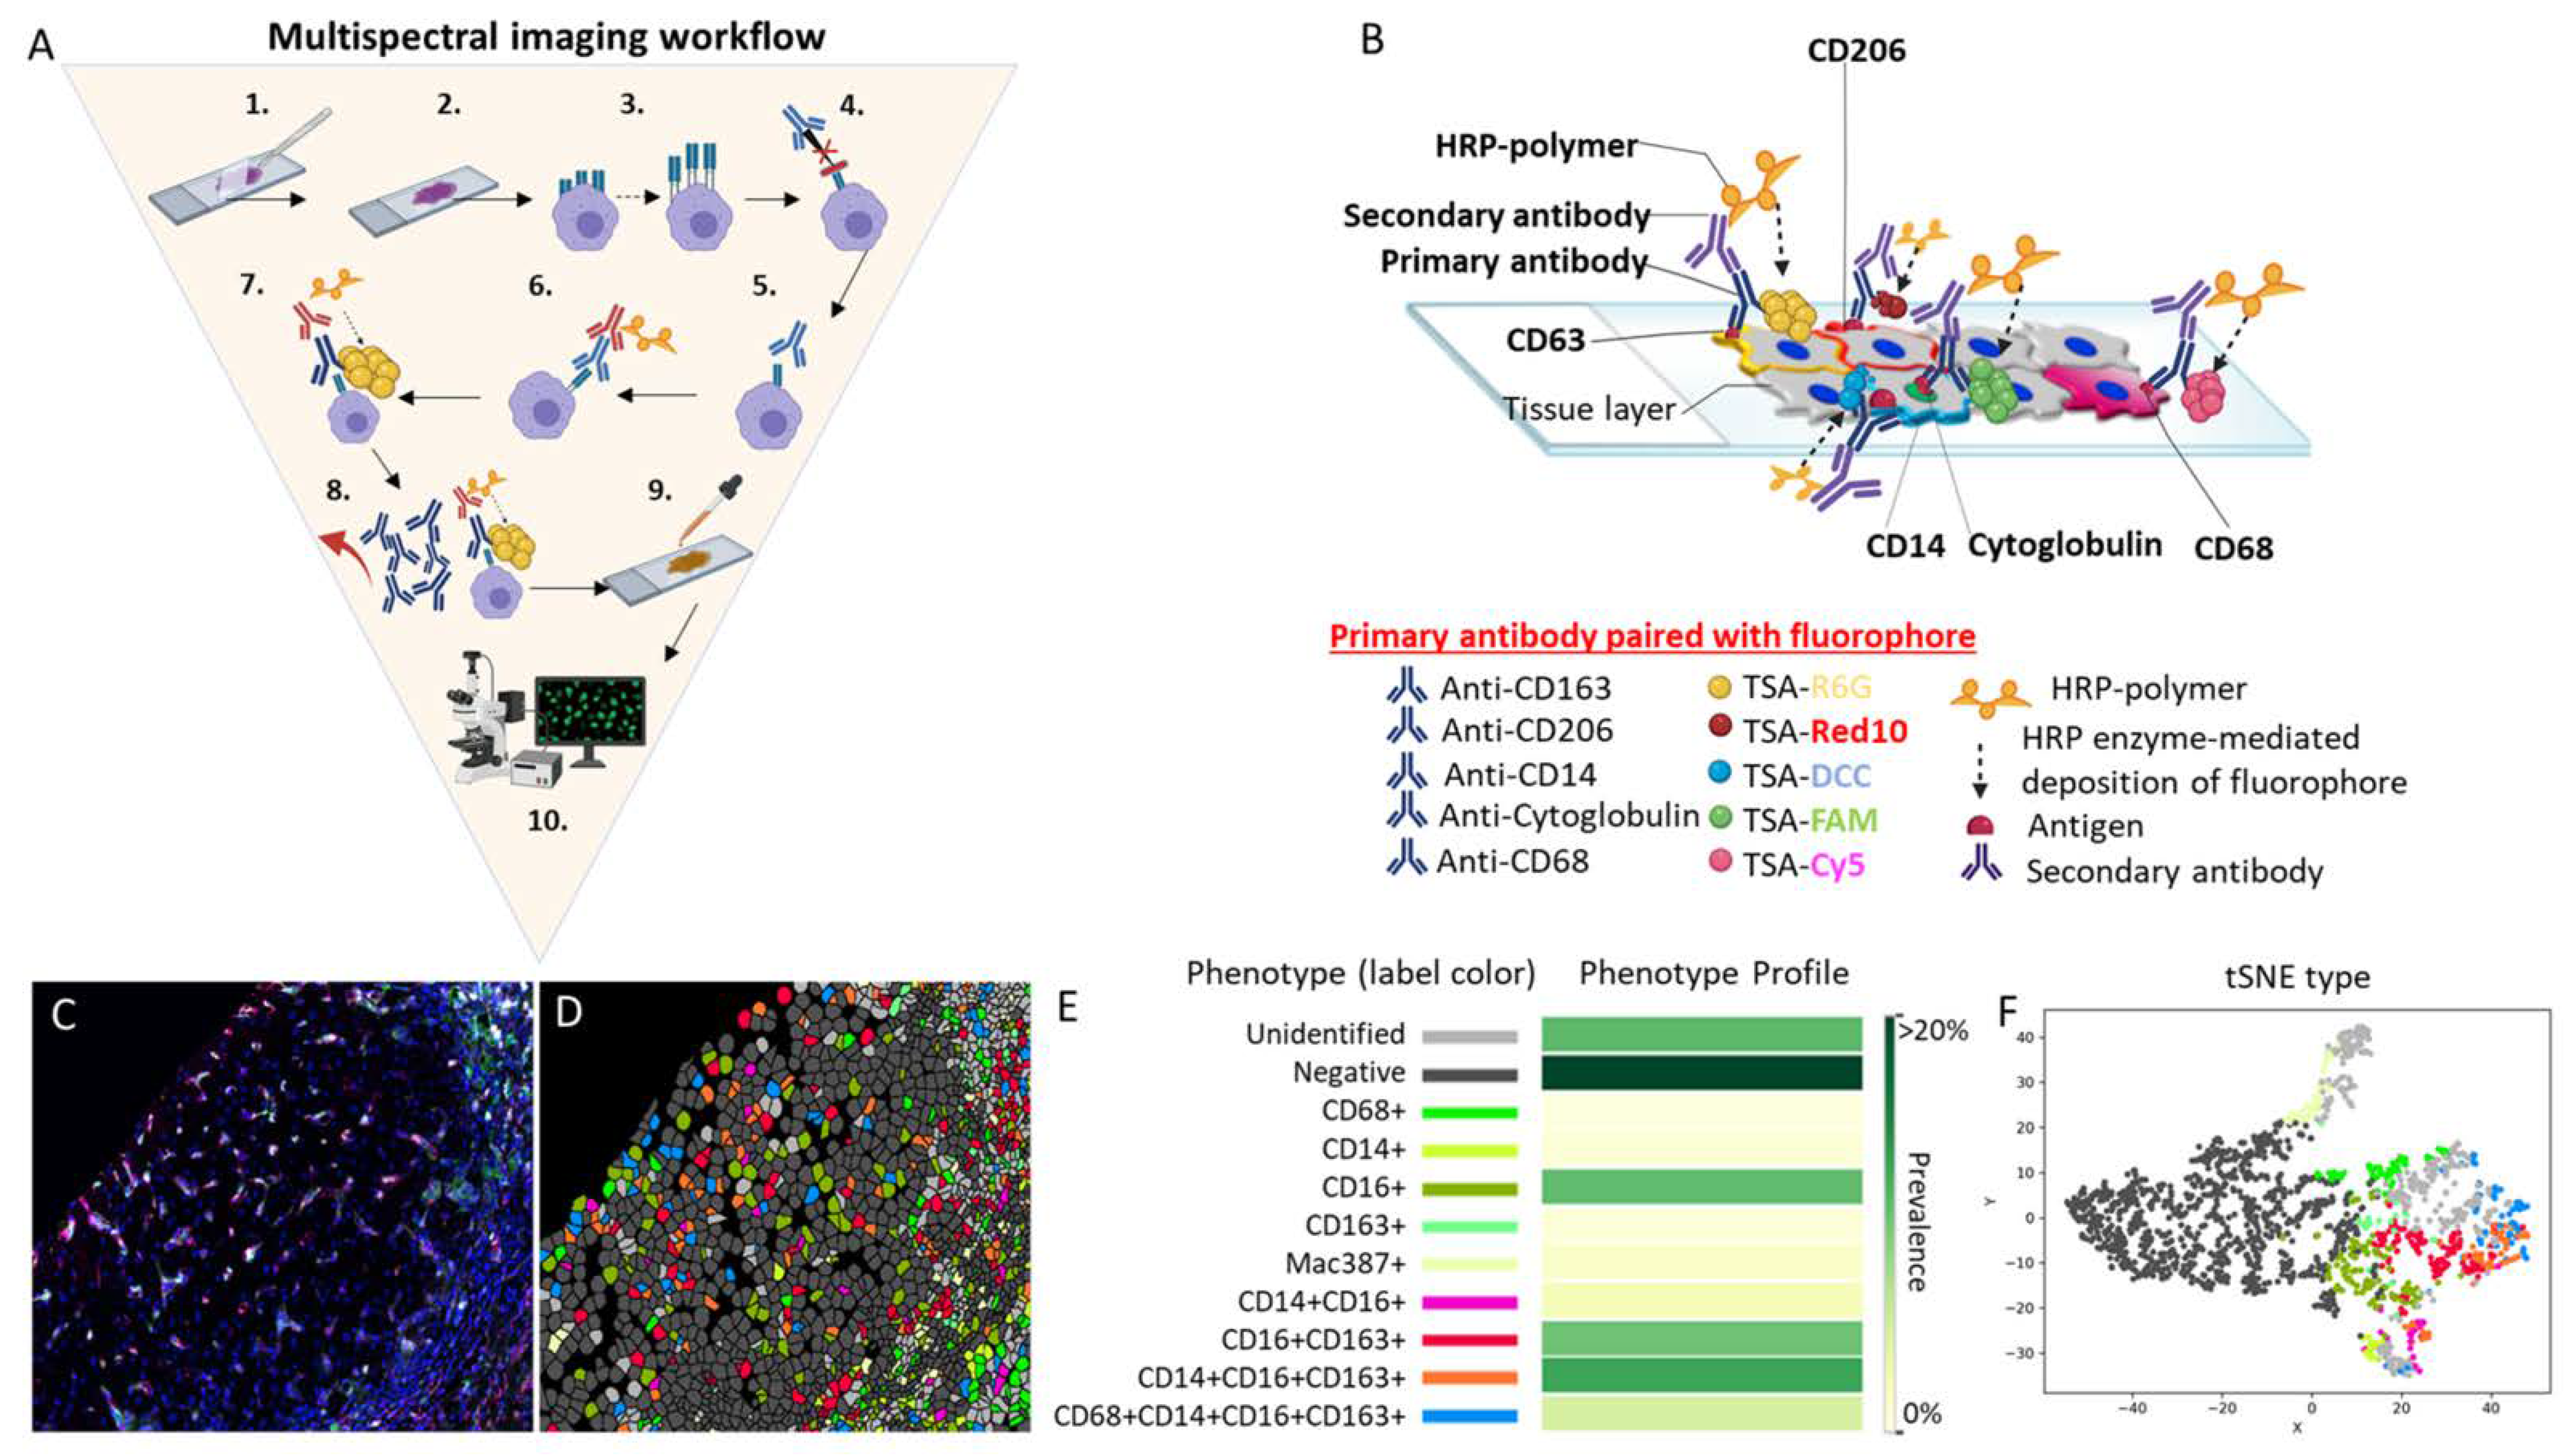
Figure 1 Multispectral imaging workflow.
Multispectral imaging workflow. (A) MSI consists of the following 10 steps: (1) deparaffinization of the tissue slide, (2) slide fixation, (3) antigen retrieval, (4) addition of a blocking reagent to prevent non-specific binding of antibodies to tissue or to Fc receptors, (5) incubation and binding of an unmodified primary antibody to its target, (6) HRP-conjugated secondary antibody incubation and binding of the HRP-conjugated antibody to the primary antibody, (7) HRP enzyme-mediated in situ deposition of the tyramine-fluorophore that covalently binds to the tissue near the target, (8) antibody removal, (9) counterstaining of the tissue with DAPI, and (10) mounting of the slide and visualization using fluorescent microscopy. Note that, after step 8, steps 3 to 8 are repeated one to four additional times or until the maximum number of antibodies (five for multiplex) is reached. (B) This is a representative image of a 5-plex stained slide with the membrane antibodies CD163 paired with the fluorophore TSA-Rhodamine 6G (gold), CD206 paired with the fluorophore TSA-Red 10 (red), and CD14 paired with the fluorophore TSA-DCC 10 (aqua blue). A nuclear marker is represented by the antibody anti-cytoglobulin paired with the fluorophore TSA-FAM (green). The cytoplasmic marker is represented by CD68 paired with the fluorophore TSA-Cy5 (violet). In the figure, all five antibodies are shown binding to the tissue at the same time to illustrate how different fluorophores signals are produce simultaneously in situ. However, the antibodies do not remain bound to the tissue after step 8. Only the fluorophores are attached to the tissue after step 8, as they form a covalent bond in the vicinity where the antibody was previously bound to the antigen, amplifying the signal that is acquired by the IF microscope. (C) Researchers stained a representative human liver biopsy slide from a patient with NASH and advanced fibrosis with a multiplex macrophage panel: CD68 (green-Opal 520), CD14 (Magenta-Opal 540), CD16 (red-Opal 620), CD163 (cyan-Opal 650), MAC387 (white-Opal 690), and nuclear stain (Blue-DAPI). A single 20× fluorescence image was obtained after spectral unmixing was applied. (D) Single multiplex images from Figure 1C were used to export multicomponent TIFF files for Visiopharm analysis. A phenotyping application was used to determine the number of different cellular phenotypes present in each image. Each colored dot represents a unique cellular phenotype. Dark gray dots represent cells that were negative for all the markers in the multiplex panel. (E) The same exported multicomponent TIFF files used in Figure 1D were used by the Visiopharm phenotype matrix algorithms to determine the different cellular phenotypes present in each of the 20× multiplex images. The colors shown for each of the different phenotypes correlate with the various colored dots (i.e., individual cells) shown in the multiplex image from Figure 1D. Dark green and white boxes indicate the populations with the highest and lowest prevalence, respectively. (F) t-SNE plots highlight the unique patterns of concatenated cellular markers that are present in the image. This algorithm uses nonlinear dimensional reduction to allow visualization of high dimensional data sets. Cells with similar properties appear closer together and those that are dissimilar appear farther apart in the 2-dimensional map. Abbreviations: 1st Ab, primary antibody; 2nd Ab, secondary antibody; Ab, antibody; DAPI, 4′,6-diamidino-2-phenylindole; HRP, horseradish peroxidase; TSA, tyramine signal amplifier.
3. Phenotyping Tumor-Associated Macrophages in the Tumor Microenvironment Using Multispectral Imaging
For the study of macrophages by MSI microscopy, the addition of more channels and narrow spectral absorption are critical since TAMs are often positive for multiple markers in the same cellular compartment and each phenotype may have unique biological functions [3]. TAM phenotype, polarization, and degree of infiltration have been correlated with clinical prognosis, tumor behavior, and response to therapy [4][10][11]. For example, using MSI on tissue biopsies obtained from 66 patients with HCC revealed that high co-expression of CD38+ CD68+ on TAMs was associated with a better prognosis after surgery, in comparison to patients whose tumor only expressed a high density of CD68+ [12]. In addition, CD38+ expression was found to be enriched in TAMs with a cytokine profile similar to that of M1 macrophages. Initiation of TAM-targeted therapy is another instance where determination of the presence of specific macrophage phenotypes is crucial for effective treatment. Some authors propose that TAM-targeted therapy should be divided into four categories for HCC: (1) inhibiting recruitment of monocytes, (2) eliminating TAMs already present in tumor tissue, (3) re-educating the functions of polarized TAMs by making M2 macrophages more M1-like, and (4) neutralizing the tumor-promoting factors of TAMs [4]. A limitation of these approaches is that to be effective, the specific target must be present. Standard IHC has not proven efficient for detecting the presence or absence of multiple TAM targets because it requires multiple slide levels, and tissue biopsies are scarce in most cases. MSI makes this approach much more feasible by enabling the detection of multiple markers in a single unstained tissue slide. For example, Saldarriaga et al. [13] identified numerous phenotypes of intrahepatic macrophages in different types of chronic liver diseases using only a single unstained slide from each patient’s liver biopsy.4. Cytometry by Time-of-Flight Workflow
5. Use of Cytometry by Time-of-Flight for Characterization of Multiple Macrophage Phenotypes in the Hepatic Microenvironment
In a study dissecting the cancer-immune landscape in HCC using CyTOF, it was observed that TAMs play an essential role in the configuration of an immunosuppressive gradient across the tumor, non-tumor, and peripheral blood microenvironments [14]. Interestingly, the study also identified a chemotactic gradient in the tissue microenvironment, composed of the chemokines CCL20 and CXCL10, attracting TAMs and resident natural killer (NK) cells. It was observed that both types of cells induced an immunosuppressive microenvironment via the expression of high levels of IL-10 by TAMs and low levels of granzyme B by NK cells. Furthermore, it is showed that HBV patients who developed HCC had increased expression of both IL-10 by TAMs and the exhaustion markers PD-1, CD152, and Lag-3 by tumor-infiltrating lymphocytes, as compared to non-tumor-infiltrating lymphocytes. The authors claimed that this observation suggests that HCC patients treated with either macrophage-targeted therapy or immune checkpoint inhibitors will not have an illicit off-target immune response in the remaining non-cancerous tissue infected with HBV [14]. What appears certainly, and others, is that targeting the TAM chemokine axis can enhance the effect of immune checkpoint inhibitors by recruiting and activating more CD8+ and CD4+ T cells, which increases the number of tumor-infiltrating lymphocytes and makes the microenvironment less immunosuppressive [15][16][17][18]. The topology of the tissue microenvironment was analyzed by Sheng et al. [11] using IMC since suspension CyTOF cannot adequately assess intratumoral heterogeneity in situ, in the context of intact architecture or spatial context [11][19]. IMC provides in situ information regarding the tissue architecture and neighboring cell interactions by limiting the tissue analysis to ROIs. The topological analysis of Sheng et al. [11] revealed three important observations. First, the tissue microenvironment of HCC is divided into regional cellular functional units that impact the prognosis of patients. Second, CD80+/86+ infiltrating macrophages activated CD8+ T cells via the CD28 signaling pathway. In contrast to CD80+/86+ infiltrating macrophages, Kupffer cells positive for the PD-L1 marker inactivated CD8+ T cells by dephosphorylating CD28. Third, in a mouse model, depletion of Kupffer cells augmented the number of infiltrating macrophages, reduced the tumor growth, and improved the efficacy of an anti-PD-1 inhibitor.6. Digital Spatial Profiling Workflow
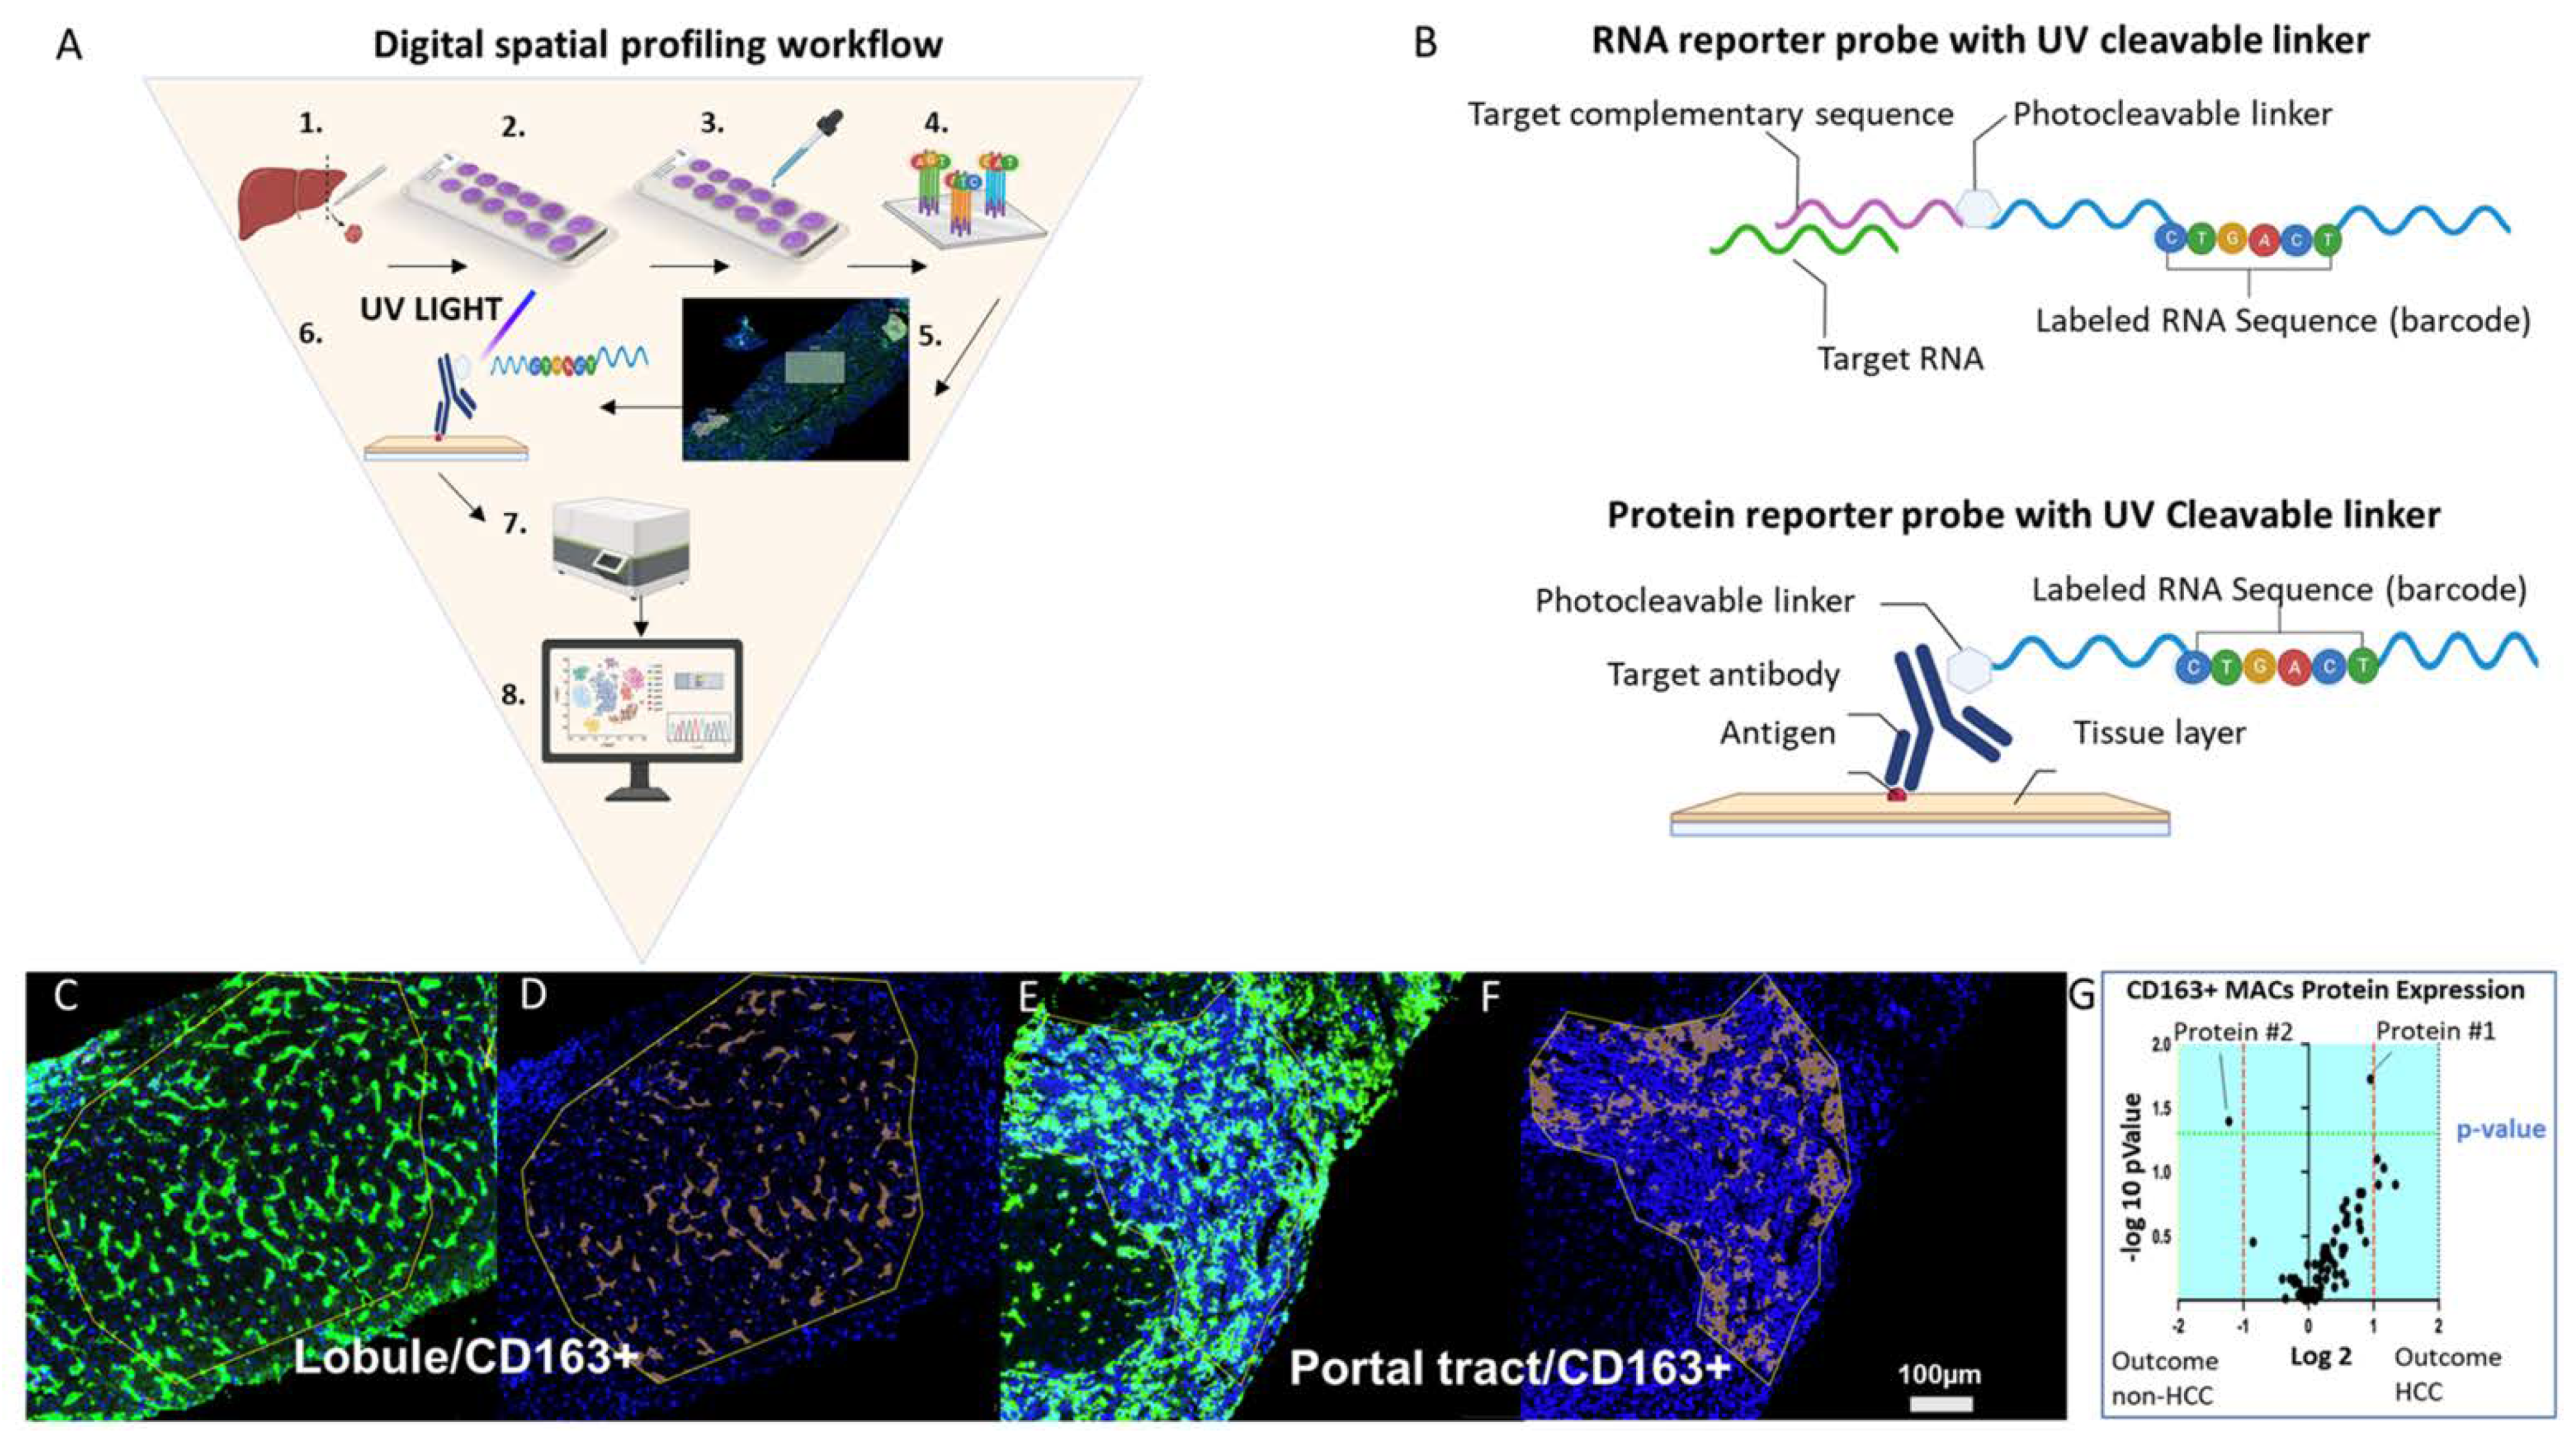 Figure 3. Digital spatial profiling workflow
Digital spatial profiling workflow (A) The workflow involves these steps: (1) tissue of interest is biopsied (e.g., liver), (2) tissue is sectioned and fixed to a positively charged glass slide, (3) the slide is stained with up to four morphology markers and a nuclear stain, (4) probes are incubated with the tissue; (5) regions of interest (ROIs) are selected after incubation; (6) target-specific barcodes are liberated by the ultraviolet laser from the selected ROIs, (7) targets are quantified by the nCounter platform, and (8) data are analyzed using a combination of imaging analysis software and R scripts, several of which are provided by the company. (B) The top image represents an RNA probe that is composed of a target complementary sequence conjugated with a photocleavable linker that bonds oligonucleotide RNA sequence barcode. The bottom image represents a protein probe that is composed of a target antibody conjugated with a photocleavable linker that bonds an oligonucleotide RNA sequence barcode. (C) Representative image of a ROI within the liver lobule and (D) represents the respective CD163+ tissue segmentation. (E) Representative image of a ROI within the portal tract and (F) represents the respective CD163+ tissue segmentation. (G) Example of a volcano plot showing enriched liver protein expression by CD163+ macrophages in the liver lobule of HCV+ patients with cirrhosis who did and did not develop HCC. The plot was generated by probing protein expression from a liver biopsy. Abbreviations: Ab, antibody; ROI, region of interest; UV, ultraviolet. Scale bar = 100 µm.
7. Digital Spatial Profiling of Biomarkers and Fetal-like TAMs
DSP techniques have been used in an elegant study to more closely examine the association between the onco-fetal reprogramming of endothelial cells and TAMs in HCC. In the study, Sharma et al. [20] investigated the link between phenotypic features of malignant cells and early development programs. They observed that the HCC tissue microenvironment was similar to the ecosystem of fetal development, expressing fetal-associated endothelial cells and fetal-like TAMs. The biological implication of this observation is that malignant cells take advantage of fetal programs to generate a fetal microenvironment that is immunologically more tolerogenic. In this fetal microenvironment, tumor cells evade the immune system, which is more tolerogenic than the adult microenvironment. Also, the identification of fetal TAMs agrees with the prevailing view that, within the tissue microenvironment, the behavior of each TAM is not biologically equivalent. The authors proposed that these fetal programs are potential targets for therapy and may yield biomarkers to stratify patients into immune checkpoint inhibitor responders and non-responders.8. Single-Cell RNA Sequencing Workflow
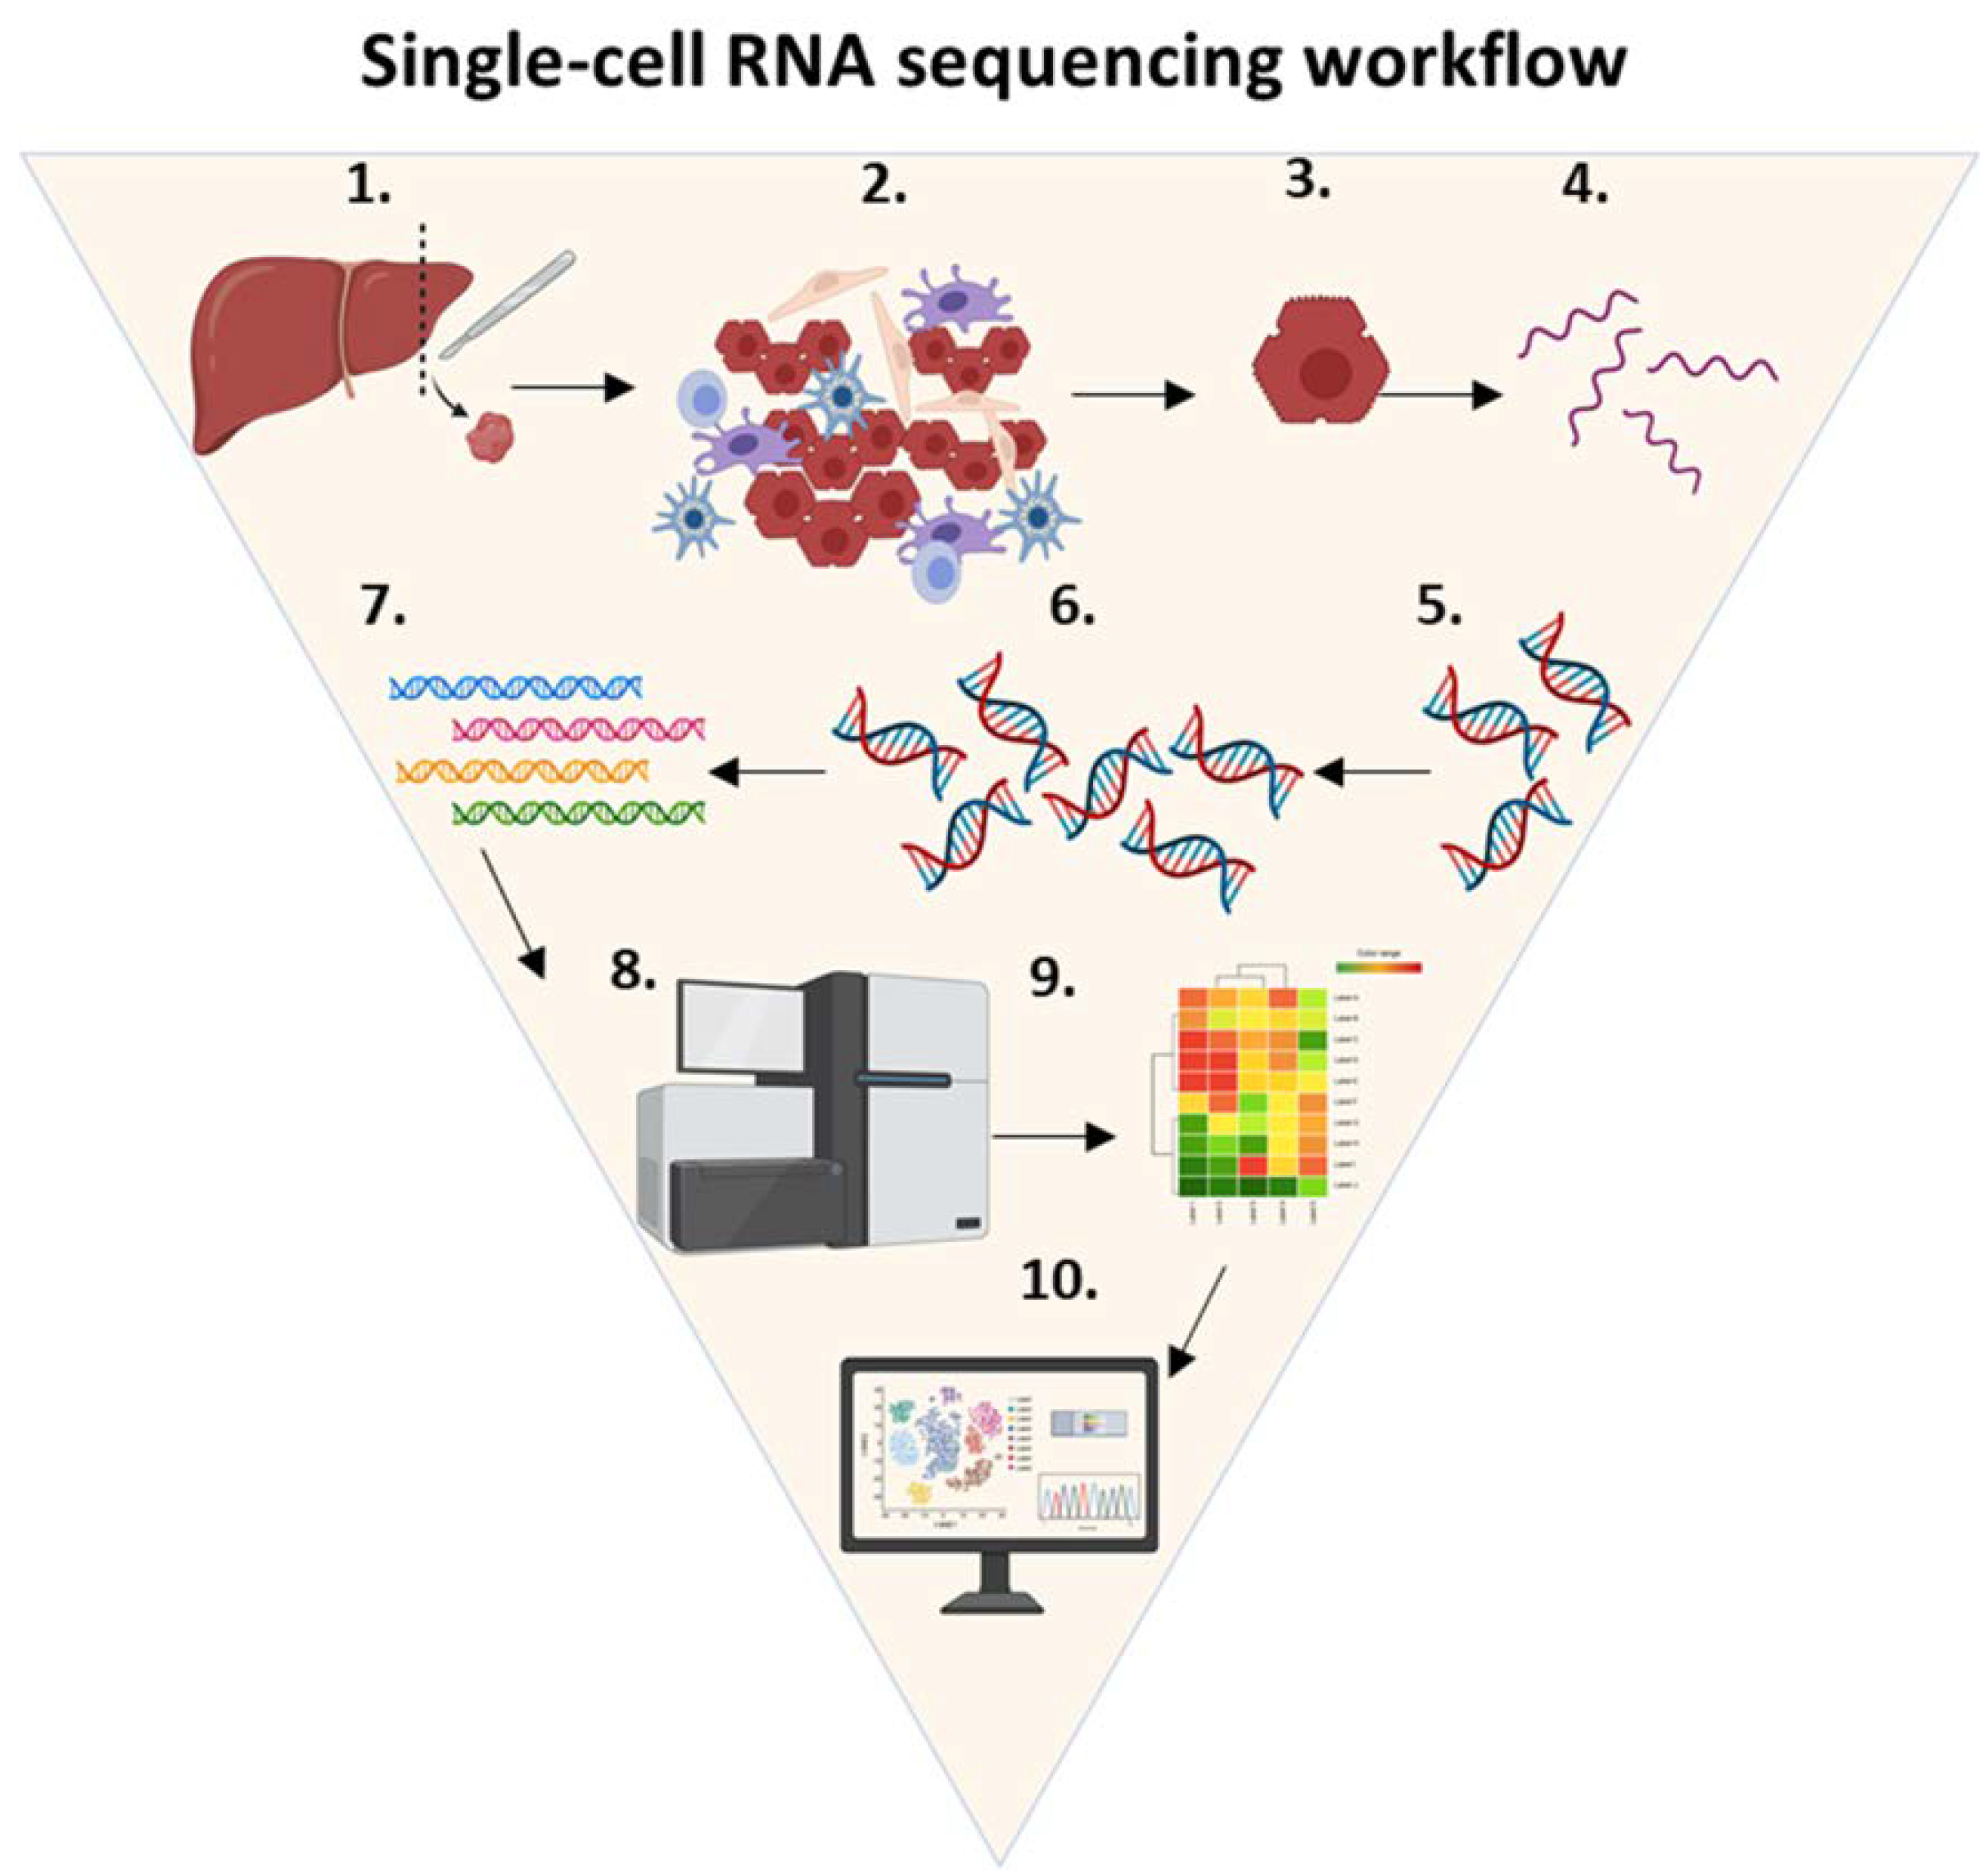
Figure 4. Single-cell RNA sequencing workflow.
Single-cell RNA sequencing workflow. ScRNA-seq is a technique that consists of the following steps: (1) tissue of interest is selected (e.g., liver), (2) the tissue is dissociated using enzymatic digestion, (3) isolated single cells are lysed, (4) RNA molecules of interest are purified and extracted from the total single-cell RNA, (5) a reverse transcription reaction is used to convert single-stranded RNA into complementary DNA, (6) complementary DNA is amplified using real-time polymerase chain reaction, (7) RNA-seq libraries are created by adding adapters and barcodes, (8) DNA is sequenced using a next generation sequencing platform, (9) the data generated by the NGS are trimmed, filtered and analyzed by computer software algorithms to yield single-cell expression profiles, and (10) cells are mapped to specific phenotypes and subpopulations of rare cell types. Abbreviations: cDNA, complementary DNA.
9. Decoding the Tumor Microenvironment of Hepatocellular Carcinoma One Cell at a Time
More studies using scRNA-seq are likely to reveal crucial aspects of the TME and TAM phenotypes, such as population heterogeneity and changes associated with chemotherapy, prognosis, and tumor progression. The tissue microenvironment of HCC is complex, as it is composed of multiple cellular phenotypes, such as TAMs, tumor infiltrating lymphocytes, stromal cells, malignant cells, cytokines and chemokines, and physical barriers, such as the extracellular matrix [21]. Single-cell resolution has revealed new paradigms in the crosstalk between macrophages and the microenvironment. For instance, ScRNA-seq was used to describe how some microenvironmental cues determine macrophage polarization and the fate of tissue fibrosis [22]. Another research group observed in a single-cell study, how transcriptional profiling of bone marrow macrophages identified which subpopulation was activated [23]. Furthermore, single-cell studies have shown that within the same tissue, subsets of immune cells respond differently to the same stimulus. Another study analyzed the immune system by using biopsies from a cohort of eight patients with HBV-associated HCC. They found a negative correlation between the proportion of M2 TAMs and the proportion of tumor-infiltrating T cells in scRNA-seq and deconvoluted bulk-cell RNA-seq datasets [21]. This result was confirmed by IHC of CD8+ T cells and CD163+ M2 TAMs in HCC biopsy specimens [21]. They also observed that expression of the immunosuppressive marker LAIR1 was enriched in TAM cell clusters expressing the cancer promoting M2 macrophage marker CD163 [21]. As a result of using scRNA-seq, certain TAM characteristics have been identified, which are potential therapeutic targets of immune checkpoint inhibitors.10. Conclusions
Several cutting-edge platforms are unveiling new paradigms in the role TAMs play in the tissue microenvironment of HCC. The advantages and disadvantages of each platform are highlighted in Table 1. Despite their unique methods, there is a common pattern in the experimental data. For example, experiments using the platforms discussed support the critical role TAMs play in the tumor immune microenvironment and progression of HCC [11][14][20][21][24]. Through unique pathways, each TAM phenotype can create an immunosuppressive tissue microenvironment that favors the proliferation of malignant cells [11][14][20][21][24]. This strongly suggests that no single TAM-targeted therapy will be effective in every HCC case and that more than one phenotype of TAM may have to be targeted in each patient. Two important questions that remain unanswered are whether M2 macrophages favor the progression of the tumor because they become dysfunctional, or because malignant cells take advantage of the immunosuppressive microenvironment created by M2 macrophages. These questions are crucial because they will provide substantial evidence to support the use of macrophage targeted therapy as an adjuvant therapy in the treatment of HCC.Table 1. Summary of strengths, weakness, opportunities, and threats for each platform.
|
Platform |
Strengths |
Weakness |
Opportunities |
Threats |
|
MSI |
Provides in situ visualization of multiple cell phenotypes, while preserving tissue architecture
Data can be used for spatial and nearest-neighbor analyses Allows data collection across entire tissue section |
Limited amount of markers can be analyzed
Spectral overlap can hinder colocalization analysis and biomarker quantification |
Presence of specific TAMs in the TME may allowed for personalized treatment Automated equipment for high throughput is available Can be incorporated into routine brightfield microscopy |
Additional standardization is needed prior to clinical implementation
Most pathologist lack training with MSI microscopy |
|
IMC |
Allows for in situ visualization of more than 40 targets No spectral overlapping The use of non-biologic markers increases signal-to-noise ratio |
Vaporization of cells and tissue ablation are irreversible steps |
Provides high-dimensional analysis of various cellular features Allows for stratification of patients into treatment responders and non-responders |
Targets with low exppression or specific populations of cells may be challenging to detect Complexity of data analysis |
|
DSP |
Spatial characterization of both RNA and protein expression using a limited amount of tissue Allows for morphological segmentation of a unique population of cells Combines high-plex microscopy and spatial genomics |
Analysis is limited to pre-selected proteins and RNA probes Gene and protein assays are evaluated on two sequential slide sections from a tissue block |
Gene expression and protein profiling in a single ROI Single cell resolution is in development |
High Cost Requires at least 150–200 cells per ROI for sufficient counts Rare target analysis is more costly and time consuming |
|
ScRNA-seq |
Single cell RNA resolution transcriptomics Accurate identification of specific phenotypes and subpopulations of rare cell types |
Loss of tissue architecture No spatial co-localization analysis |
Characterization of cellular crosstalk at single cell resolution Profile potential therapeutic targets for rare phenotypes |
Cell isolation method, number of cells per experiment, cost per cell and sensitivity vary between scRNA-seq platforms |