Volcanologists have demonstrated that carbon dioxide (CO2) fluxes are precursors of volcanic eruptions. Controlling volcanic gases and, in particular, the CO2 flux, is technically challenging, but we can retrieve useful information from magmatic/geological process studies for the mitigation of volcanic hazards including air traffic security. Existing techniques used to probe volcanic gas fluxes have severe limitations such as the requirement of near-vent in situ measurements, which is unsafe for operators and deleterious for equipment. In order to overcome these limitations, a novel range-resolved DIAL-Lidar (Differential Absorption Light Detection and Ranging) has been developed as part of the ERC (European Research Council) Project “BRIDGE”, for sensitive, remote, and safe real-time CO2 observations.
- volcanic eruptions
- volcanic plumes
- CO2 flux
- laser remote sensing
- lidar (light detection and ranging)
- DIAL-Lidar
- data processing techniques
- gas concentration retrieval
- wind measurement by correlation technique
1. Introduction
Volcanoes represent a significant threat and, at the same time, are a huge attraction since antiquity for populations living nearby due to their fertile lands. At present, large populations live near active or quiescent volcanoes and thus are at risk of their possible eruptions. It is well known that volcanic eruptions can determine increasing air pollution levels; furthermore, they can influence climate [1] and, in some circumstances, produce lethal eruptions that destroy the surrounding environment and cause serious losses to national/international economies. Cautious valuation of volcano comportment and activity state is required to mitigate these effects, which can be carried out by instruments dedicated to volcanic control [2].
Volcanologists can nowadays infer in real-time, by modern technological and modeling developments, the signals coming from seismic and ground deformations that usually happen before eruptions. It is possible to know of an imminent eruption by detecting the stress changes and magma accumulation/flow, thanks to the improvements in broadband seismometers, models, and tools for processing seismic signals [3], and the constant implementation of satellite-based (GPS, Global Positioning System [4] and InSAR, Interferometric Synthetic Aperture Radar [5]) geodetic observations [6].
The employment of modern systems and networks for volcanic gas observations [7][8][9][8,20,23] has made it possible to make significant progress in direct sampling techniques for volcano monitoring. This has resulted in an improvement in time resolution of traditional ground-based volcanic gas observations [10][24]. Moreover, taking advantage of fast advancements in optoelectronics, especially in the last two decades including new coherent sources, detection systems, and spectrometric devices, we have at present many optical remote techniques, both passive and active, ground-based, airborne, and even spaceborne, that apply to issues involving Earth CO2 degassing [11][12][12,14]. The improvements of volcanic gas measurements in terms of numbers, quality, and time duration are providing evidence that CO2 is the gas most directly linked to “pre-eruptive” degassing processes [13][21]. As confirmation of this fact, precursory increases in CO2 plume flux have been recently detected at several volcanoes [14][25] such as at Mt. Etna, the most active and dangerous volcano in Europe [15][26].
Lidar systems have increasingly been used since the early 1980s for the valuation of volcanic hazards (e.g., during the Soufriere and Mt. St. Helens eruptions in 1979 and 1981, respectively) [7][8]. Over the last 30 years, several lidars have been deployed to obtain data on the concentrations and fluxes of sulfate aerosol [16][17][18][27,28,29] and ash [19][30]. Furthermore, laser remote sensing systems have been used to detect volcanic particles in the troposphere at Mt. Etna (Italy) [20][31] and in the lower stratosphere during the Pinatubo eruption (Philippines) [21][32]. In particular, the lidar at Garmisch-Partenkirchen was one of the first examples of volcanic lidar implemented to observe the spread of the stratospheric volcanic plume (from 10 to 28 km) by evaluating the time-series of vertical profiles of the scattering ratio and vertically integrated column of the backscatter coefficient using a Nd:YAG laser operating at 532 nm. These measures were affected by the following average errors: peak scattering ratio: ±4–5% and integrated backscatter coefficient: ±10% [21][32].
DIAL-Lidar (Differential Absorption Light Detection and Ranging), or simply DIAL, is based on the fast switching of the wavelength of laser pulses on- and off-absorption of the molecule under study. From the application of the Beer-Lambert law to the ratio of the lidar signals (detected radiation vs. range) retrieved at both wavelengths, the range-resolved molecule concentrations (ppm) can be obtained, thus determining the two-dimensional or even three-dimensional plume morphology. This achievement is beyond the capabilities of FTIR, COSPEC (Correlation Spectrometer), and DOAS (Differential Optical Absorption Spectroscopy) [22][15], which provide the path length integrated concentrations (ppm m). DIAL has been deployed at the main Italian volcanoes with UV lasers for tracking the total fluxes of SO2 [17][23] [28,33]. In particular, the first example of the quantification of volcanic SO2 fluxes by using the DIAL (active) technique is reported in [23] [33] where it was extensively compared with passive monitoring techniques (DOAS and COSPEC). In the previously mentioned work, the lidar-based SO2 fluxes were 50% higher on average than those derived with other standard passive techniques (DOAS and COSPEC) commonly used in volcanology. This mismatch was interpreted as evidence of possible scattering-induced errors in the passive techniques.
2. The BILLI System
A lidar, also known as an optical radar, is an active range-resolving optical remote measurement system whose main components are composed of a transmitter (laser) and the receiver (telescope, optical analyzer/detector, data acquisition/computer). The principle of operation is the following [24][25][43,44]: the laser emits a light pulse into the atmosphere and its photons are scattered in all directions from molecules and aerosols (particles, droplets, etc.) present in the air. Part of the light is backscattered toward the telescope. Then, using a detector and computer, it is possible to analyze the detected signal vs. the time elapsed between the emission and detection (t). This makes it possible to characterize the chemico-physical properties of air along the beam. If R is the distance from the lidar of the backscattering layer and c is the speed of light, we can write R = ct/2. Going back and forth from the backscattering layer, the laser pulse undergoes attenuation by air, as expressed by its extinction coefficient, linked to the light absorption of its species. Often, the absorption lines of molecules are narrow, making it possible to employ DIAL to retrieve their concentration. This technique uses the idea of differential-absorption measurement in which two light pulses with slightly different wavelengths (ON: the light is strongly absorbed by the species under investigation, OFF: the light is not absorbed at all or at least much less) are emitted into the atmosphere, and two corresponding backscattered signals are detected concurrently. The difference between the two profiles is directly linked to the molecule abundance and this technique allows one to determine and map the concentrations of selected molecular species in ambient air [24][25][43,44].
BILLI (whose technical scheme and experimental setup are reported in Figure 1) is a monostatic-biaxial DIAL-Lidar system mounted in a small laboratory truck and is composed of a transmitter and receiver equipment [13][26][27][28][29][30][31][21,37,38,39,40,41,42].
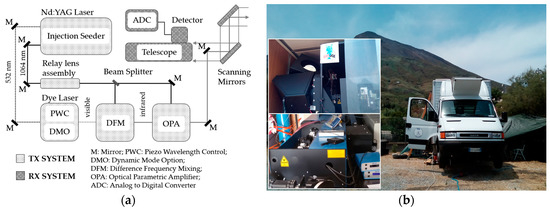
Figure 1. (a) Technical scheme of the BILLI DIAL system extrapolated and rearranged from the Figure 2 reported in [26][37]); (b) Experimental setup of the system during the Stromboli campaign (the volcano summit is visible above the two inset pictures). The scanning mirrors and the laser system are visible in the top and bottom inset picture, respectively.
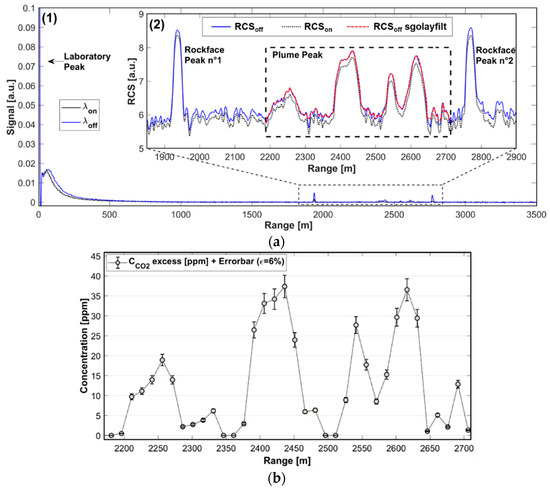
Figure 2. (a) Example of a lidar profile acquired during the Stromboli volcano field campaign on 26 June 2015. (1) Data profiles in the form of signal intensity (arbitrary units, a.u.) vs. range (in meters) cleaned by the noise. (2) Detail of the experimental RCS (Range Corrected Signal) and filtering of the OFF channel using a Savitzky–Golay filter algorithm with 13 points in which the plume peak is visible between two rockfaces in the range interval between 1800 and 2900 m. The laboratory peak in (1) provides the start time of the pulse emission and is due to the reflection of some laser radiation inside the mobile laboratory. The two rockface peaks (2), as their name indicates, are due to pulse backscattering by the rockfaces of Stromboli. Finally, the peaks from 2200 to 2700 m are linked to the backscattering of the laser pulse from the plume. (b) Particulars of the exceedance of in-plume CO2 concentration profile (acquired at 11:27, with an elevation 16.98° and azimuth 237.8°). The quadratic sum of statistical (2%) and systematic (5.5%) uncertainties led us to estimate an overall uncertainty of about 6%.
3. The BRIDGE DIAL Data Analysis Technique
As above-mentioned, from the literature [25][44], it is well known that the radiation returned to the lidar telescope vs. time is linked to the backscattering of the laser pulse by an atmospheric layer at a specific range from the system. Consequently, lidars provide range-resolved characterization of the atmosphere and its components (particulates and molecules) along the path of the laser pulse. This information can be displayed using intensity vs. distance graphs.
Considering that for our experiments a DIAL system was deployed, two different wavelengths—λON and λOFF, absorbed and not absorbed, respectively, by carbon dioxide—were used to acquire the intensity profiles. The difference between the two wavelengths was very small and, as a consequence, the behavior of the atmosphere (e.g., considering aerosol and molecular attenuation and turbulence effect on the beam transmission) was the same, except from the CO2 absorption. Thanks to the difference in return between the nearly simultaneous λON and λOFF signals (as stated in Table 1, the time interval between two successive laser pulses was 0.1 s), and using the previously mentioned technique, the operator can retrieve the range-resolved CO2 concentration profile in volcanic plumes.
Table 1. Main specifications of the BILLI system during the BRIDGE field campaigns.
| Transmitter | Pulse energy | 25 mJ |
| Pulse duration | 8 ns | |
| Repetition rate | 10 Hz | |
| Wavelengths | ON: 2009.537 nm, OFF: 2008.484 nm (Stromboli Volcano 2015, Mt. Etna 2016) | |
| ON: 2012.194 nm, OFF: 2011.1 nm (Pozzuoli Solfatara 2014) | ||
| Laser linewidth | 0.04 cm−1 | |
| Beam divergence | 0.5 mrad | |
| Receiver | Mirror coating | Al |
| Clear aperture | 300 mm | |
| Focal length | 900 mm | |
| Field of View | 1 mrad | |
| Scanning elliptical mirrors | Mirror coating | Al |
| Clear aperture | 320 mm × 451 mm | |
| Detector module | Photodiode | InGaAs PIN |
| Diameter | 1 mm | |
| Responsivity | 1.2 A∙W−1 | |
| Gain | 5.1∙104 V∙A−1 | |
| NEP | 10 pW∙Hz−1/2 | |
| Bandwidth | 0–10 MHz | |
| Analog-to-digital converter (ADC) | Dynamic range | 14 bit |
| Sampling rate | 100 MS∙s−1 |
The BRIDGE DIAL technique is a mathematical procedure written with MATLAB software that has been specifically developed for real-time data processing and graphic presentation of data, acquired during the field campaigns carried out by the BILLI system. As recalled before, throughout the years, both the system and the data analysis technique have been optimized. In this section, only the main steps of the technique are reported, and more details are given in previous works [13][26][27][28][29][30][31][21,37,38,39,40,41,42].
The values of CO2 concentrations reported both in the profiles (see Figure 2b) and the dispersion maps (see Figure 3a, Figure 4a, Figure 5b) were used to compute the carbon dioxide flux (see Figure 3b, Figure 4b, Figure 5c).
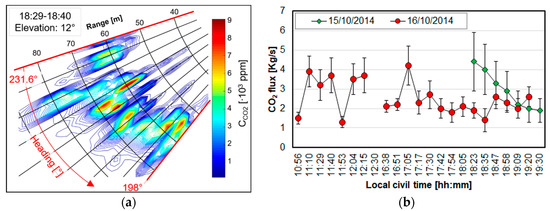
Figure 3. (a) An example of a lidar scan in polar coordinates through the plume at an elevation of 12° (15 October 2014). The contour lines show isopleths of background-corrected CO2 mixing ratios in the plume (expressed in ppm, the legend is the vertical colored bar), shown as a function of heading and range. (b) Time-series of lidar-derived CO2 fluxes from Pisciarelli obtained from 15 October (afternoon) to 16 October (afternoon), rearranged from Figure 4 reported in [13][21]. The timescale for the morning scans on 15 October is shown in green. Each point refers to a particular scan through the plume (time is the onset time of the scan, with each scan lasting 10–20 min) [13][21].
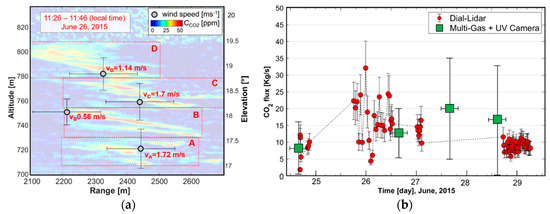
Figure 4. (a) In-plume CO2 concentration map acquired on 26 June 2015 at Stromboli. Carbon dioxide concentration varies as a function of increasing altitude (on the left of the map) and elevation (on the right of the map). The superimposed grey points represent the vertical wind profile retrieved by BILLI in the same dataset. Here, the mean value of the wind velocity was found about 1.3 m/s. The x-axis error bar is the weighted average standard uncertainty of wind velocity, equal to 0.52 m/s. Instead, the error bar on the y-axis represents the altitude halfwidth between adjacent regions (A, B, C, and D) [29][40]). This figure has been obtained by combining Figure 4 and Figure 8 reported in [29][40]. (b) Time-series of CO2 fluxes from the Stromboli volcano from 24 to 29 June 2015, rearranged from Figure 5 reported in [30][41]. The BILLI based fluxes (red circles) were obtained using the procedure detailed here [28][30][39,41]. For comparison, independent CO2 flux estimates, obtained by multiplying the in-plume CO2/SO2 ratio (from Multi-GAS) by the SO2 flux (from UV cameras) are also presented (green squares) [30][41].
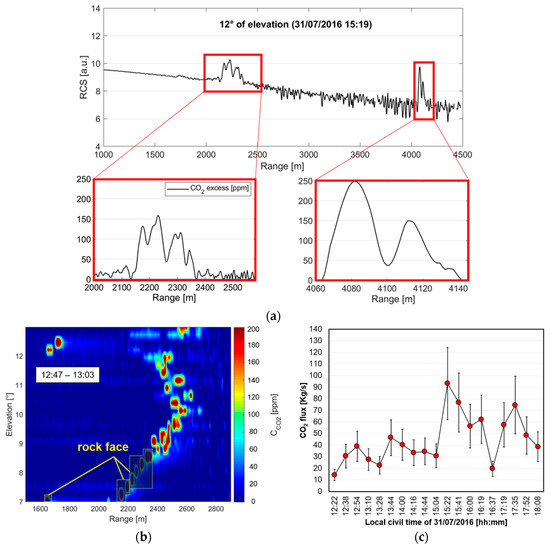
Figure 5. (a) Lidar return at 12° of elevation: two wide and jagged peaks from the volcanic plume are visible; the CO2 profiles inside the volcanic plume are shown in the two red boxes. The uncertainty was equal, respectively, to 6% for the left-side plume peak and 7.5% for the right-side plume peak. (b) Vertical scan (fixed azimuth: 230°) of the volcanic plume (CO2 excess) acquired on 31 July 2016 (12:47 p.m.–1:03 p.m., local civil time). With that fixed azimuth and in the elevation range 7–9°, rockfaces reflect the laser pulse, corresponding to peaks that are not linked to the plume (rockfaces are disentangled from plume because of the narrowness of peaks). (c) Carbon dioxide flux measured at the northeast crater on 31 July 2016 (12:22 p.m.–6:08 p.m., local civil time). The bars show the error in carbon dioxide flux (33%). Please note that the previous figures were extrapolated and rearranged from Figure 2a, Figure 4c, Figure 5, respectively, reported in [31][42].
4. Conclusions
In summary, the novelty/advantage of this work is that the proposed standoff DIAL system allows effective measurements (CO2 excess of a few tens of ppm has been detected) to be taken continuously and remotely (up to more than 4 km from the crater), therefore, from a safer location free from the risks to which operators are exposed during direct sampling. Besides, data have been acquired with much higher temporal (10 s) and spatial (5 m) resolution than conventional instruments (the plume was scanned in few minutes rather than over several hours). Then, a complete time-resolved plume evolution has been detected in several measurement sessions; this can be useful for the assessment of the wind velocity, a crucial parameter not only for the CO2 flux retrieval, but also for air traffic control applications. These performances allow the operator to characterize the spatio-temporal evolution of the plume, thus providing—24 h and real-time—accurate information on an important precursor of eruptions.
To our knowledge, our system performed, for the first time, range-resolved measurements of CO2 concentration and flux in a volcanic plume, and the findings reported laid down the basis for a new and smarter generation of active optical devices, specifically conceived for long-term volcanic gas observation. Even though several improvements have been made (high distances reached, fully automated operational routines, reduction of system weight, and independent measurements of wind velocity), further developments are still necessary before DIAL-Lidar systems can become operative tools for real-time volcano monitoring. Efforts will have to be made, in particular, to improve portability (the current system weight is about 1100 kg), to reduce power requirements (currently, 6.5 KW), and to integrate existing system control and data processing routines to create a unique, user-friendly, and fully automated software framework for the end-users.
Shortly, it will be desirable to deploy both ground-based (using a newly designed laser-based system such as the one described in this paper together with conventional sensors) and airborne (or spaceborne) platforms, forming a robust, integrated network for eruptions forecasting for prolonged periods. This will allow us to provide useful information to volcanologists, concerning the time evolution of volcanic gases in hazardous regions while working remotely and safely.