Microchip electrophoresis (MCE) is a miniaturized form of capillary electrophoresis. Electrophoresis is a common technique to separate macromolecules such as nucleic acids (DNA, RNA) and proteins. This technique has become a routine method for DNA size fragmenting and separating protein mixtures in most laboratories around the world. The application of higher voltages in MCE achieves faster and efficient electrophoretic separations.
- electrophoresis
- microchip electrophoresis
- microfluidics
- microfabrications
1. Introduction
Electrophoresis is an analytical technique that has been applied to resolve complex mixtures containing DNA, proteins, and other chemical or biological species. Since its discovery in the 1930s by Arne [1], traditional slab gel electrophoresis (SGE) has been widely used until today. Meanwhile, new separation techniques based on electrophoresis continue to be developed in the 21st century, especially in life sciences. Capillary electrophoresis (CE) provides a higher resolution of the separated analytes and allows the automation of the operation. Thus, it has been widely used to characterize proteins and peptides [2], biopharmaceutical drugs [3], nucleic acids [4], and the genome [5]. The development of microfabrication techniques has led to the further miniaturization of electrophoresis known as microchip electrophoresis (MCE). MCE offers many advantages over conventional capillary electrophoresis techniques such as the integration of different separation functions onto the chip, the consumption of small amounts of sample and reagents, faster analyses and efficient separations [6][7]. As a few additional functions such as sample preparation, washing, and incubation with antibodies and derivatization with dyes can be integrated on a single stamp size microchip, MCE has the potential to be adapted for portable POC and clinical diagnostics devices. Microchip electrophoresis provides separations within a minute or few seconds while capillary electrophoresis takes from minutes to hours to fully resolve the components of the sample mixture. MCE also offers the integration of detection methods such as electrochemical detections, laser induced fluorescence detections and interface with mass spectrometry. As a result, MCE has been used in a variety of applications, e.g., to analyze biomolecules in blood [8], saliva [9], tear [10], dialysate [11], and islets [12].
2. Principles of Microchip Electrophoresis
The working principle of MCE is based on the movement of charged analytes under the presence of an electric field. [13]. The electrophoretic movement of charged molecules is determined by the type of charge on the molecules and electric field strength. For example, negatively charged molecules travel towards the positive electrode, and vice versa. The electrophoretic velocity (νep) and electrophoretic mobility (µep) of the charged molecule are described by the equations given below (Equations (1)–(4)) [14]:
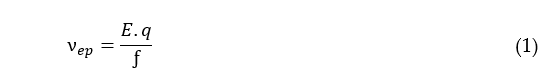
where E is an electric field applied (units: Volts/cm), q is the net charge on the molecule (units: Coulombs), ƒ is the frictional coefficient (units: Joule.s/m) which is friction against the electrophoretic mobility of the molecule, V is the voltage applied (units: Joule/Coulomb), L is the total length of the separation channel (units: cm), LD (units: cm) and t (units: s) are the length and time a molecule travels to reach the detection point, respectively [15]. Equations (1)–(4) show that (cm/s) of the molecule is proportional to the applied voltage and net charge on the molecule (q) but is inversely related to the ƒ of the molecule. Other factors such as temperature, structure of the molecule, separation medium concentration, and porosity also affect the electrophoretic velocity of the molecule [16].
Electroosmotic flow (EOF) in the capillary or channel can also affect the movement of charged molecules. MCE chips are usually made of fused silica with silanol groups present at the surface of the channel. At pH above 3, silanol groups are deprotonated in the buffer solution and form a negatively charged layer on the surface. The ionized silanol groups on the wall attract the oppositely charged ions from the buffer solution, and as a result of this, a double layer is formed on the channel wall, also known as a stern double layer. This layer results in zeta potential (ζ) which is defined as the electrokinetic potential at any given point in the double layer [17]. The value of zeta potential (ζ) decreases with increasing distance from the surface of the capillary wall. When an electric field is applied, the positively charged ions in the double layer of the wall are dragged towards the cathode, which produces bulk movement in the capillary towards the cathode [14], and therefore, EOF is formed, which is usually measured with electroosmotic mobility .
Proteins and nucleic acids are negatively charged typically at pH above 7 and travel towards the anode. Therefore, EOF must be controlled to develop MCE systems for the separation of such molecules. EOF can be suppressed by coating separation channels dynamically or permanently [18]. Polymer materials such as polymethyl methacrylate (PMMA) have lower surface charged groups and hence, have lower EOF values [19]. The commonly used aqueous solutions cannot wholly wet the hydrophobic surface of the separation channels. Thus different coatings have been applied to control EOF, such as amine-terminated PMMA surface [20], sol–gel treatment [21], evaporation coating [22], and polyelectrolyte multilayers [23].
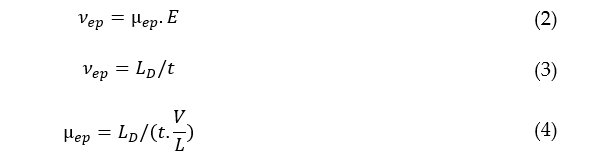
Figure 1 shows a typical MCE microchip. [24]. The separation microchip consists of two microchannels, i.e., sample loading microchannel and a separation microchannel. Firstly, a buffer solution is filled inside microchannels and the sample is dispensed into the sampling inlets. The sample is electrophoretically driven in the sample loading microchannel as shown in Figure 1. Secondly, an electric field is switched to the separation microchannel and a sample plug from the intersection of the cross channel is pinched into the separation microchannel. This step is known as sample dispensing. Separation occurs as the sample moves along the microchannel and separates into small bands [24][25]. Finally, the sample enters the detection point where the electropherograms are recorded (Figure 1).
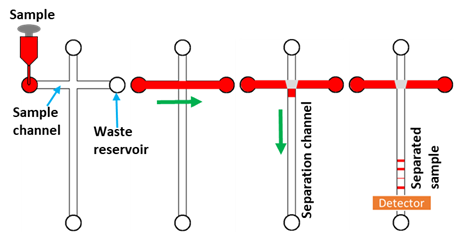
Figure 1. Schematic of the cross-chip illustrating the steps of sample loading, from the injection to the separation channel, separation, and detection. The sample is loaded into the cross-channel (red colour), and electrophoretically drives towards the sample waste reservoir (green arrow). The sample is then injected into the separation channel at the channel intersection upon the application of the electric field (purple arrow). The sample is resolved into its components in the separation channel and detected in the detection region [26].
Separation efficiency is quantified by two main factors known as separation resolution (R) and the number of theoretical plates (N) [16][26]. R measures how well the molecules are separated along with the separation medium. R is defined as the ratio of the time difference between two peaks (t2−t1) to the sum of the peak half widths (σ1+σ2) at the base (Equation (5)) as shown in Figure 2:
The number of theoretical plates, an indicator of the maximum separation efficiency of a separation column/channel, is as given in Equation (6):
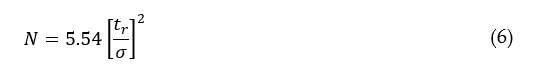
where is the width of the peak at half of the height (expressed in terms of time) and is the retention time.
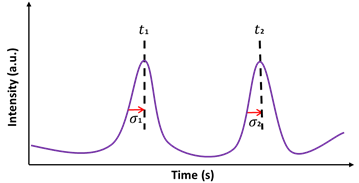
Figure 2. Schematic of the electropherogram for the calculation of separation resolution (R) and the number of theoretical plates (N). Here, are the widths of the peaks at half of the heights and are the times at maximum peak heights.
3. Applications of Microchip Electrophoresis
Microchip electrophoresis (MCE) has been a key technology to study proteomics, DNA sequencing, antibody–antigen immuno-separations, and POC diagnostics [27][28]. Different modes of MCE, along with highly advanced applications, are discussed in this section.
3.1. Microchip Capillary Zone Electrophoresis (Microchip CZE)
Microchip capillary zone electrophoresis (microchip CZE) separates the analytes on the basis of their sizes and charges on them. From its earlier development, CZE was used for the separation of amino acids [29] and proteins [30] to its use for proteomics coupled with mass spectrometry [31], environmental studies [32], and biomolecules [33]. In one of the examples, human serum proteins were separated in borate buffer and labeled with 2-Toluidinonaphthalene-6-sulfonate (TNS) after electrophoresis in microchip CZE [34]. The TNS labeling produces the fluorescent signal upon non-covalent interaction with the separated proteins. However, the authors could not achieve the separation of proteins in the true serum sample due to the weak signal produced by the labeling of TNS. Furthermore, Jacobson’s group [35] improved the microchip CZE separation performance at higher temperatures by applying higher voltages in the separation channel. The application of temperature inside the microchannels adds diffusion to the bands and hence the separation efficiency decreases. To this end, the authors applied higher voltages up to 1000 V/cm and achieved the separation of N-glycans at elevated temperatures between 22 and 45 °C.
Fanggui et al. [36] fabricated a microchip to quantify the carcinoembryonic antibody–antigen reaction for the detection of cancer disease in blood serum samples. Carcinoembryonic antigen (CEA) standards and serum samples from patients were incubated first with primary antibody (Ab1) and secondly with the fluorescently labeled secondary antibody (Ab2*). The reacted antibody and antigen samples consisted of Ab2*, Ab1-Ab2*, and Ab1-Ab2*–CEA, which were separated on MCE and quantified. In another study, serial immunoassays [12] within 10 s have been performed on a microchip for the detection of insulin secretion from pancreatic islets. Islets chambers were fabricated on the microchip, and all steps like washing, reaction with labeling antibody and insulin secretion, etc., were integrated on the chip. This type of study has the potential to be applied for competitive and non-competitive immunoassays of biomarkers from bodily fluids. However, these devices offer robust and faster analyses but still use the complex integration of multiple components and labeling requirements, which makes them less attractive for clinical diagnostics and hence they require further simplicity in handling and analysis.
3.2. Microchip Gel Electrophoresis
MCE has been widely used as a robust and reliable method for protein separations. High-resolution MCE separations can be achieved because of the smaller channel lengths and shorter separation times. Two types of gels are used to separate biomolecules such as sieving gels and agarose/polyacrylamide gels.
Hydrophilic polymers such as polyethylene oxide (PEO), linear polyacrylamide, polyvinyl alcohol (PVA), hexamethylcellulose and hexaethylcellulose, etc. are filled in the microchannels and serve as the sieving matrix for microchip capillary gel electrophoresis (microchip CGE). Different concentrations of polymers are prepared by dissolving polymers in separation buffers, and the viscosity and porosity are controlled by varying the concentrations and molecular weights of the polymer chain. Microchip sodium dodecyl sulphate CGE (SDS-CGE) has been mostly used in pharmaceutics for protein separations. As an alternative to sodium dodecyl sulphate polyacrylamide gel electrophoresis (SDS-PAGE), it can provide more reproducible results [37][38] such as in Root et al. [39], who separated the mixture of proteins on the cross-chip by using different concentrations of sieving matrices and a different surfactant called acid-labile surfactant which is suitable for downstream applications such as mass spectrometry (MS). Proteins have also been separated in two dimensions [40] such as microchip SDS-CGE, which was coupled with micellar electrokinetic chromatography (MEKC) to separate proteins (38 to 110 kDa). Zheng et al. [41] made a device with four capillary array channels and showed the consistent migration times and analyte intensities from channels to channels and from each different run using sieving matrices (PEO gel). These devices required low voltages and reproducible results were achieved in shorter times as compared to conventional gel electrophoresis. Moreover, the devices also offer on-chip labeling and detection via UV/Vis or fluorescent imaging.
Agarose gels are very popular in separating large molecular weight nucleic acid fragments because of the large pore sizes and non-reactivity towards DNA molecules [42]. Nucleic acid fragments are detected by intercalating dyes into the DNA base pairs, and the most used ones are Ethidium Bromide and Syber Green [17]. Agarose gels are chemically inert to nucleic acids, can be stored for later visualization, are non-toxic, easy to cast, and quick to run, but are expensive and cannot achieve the separation of small biomolecules such as proteins (below 200 KDa) because the pore size of agarose gel is larger than the size of the smaller proteins [42].
Acrylamide is a monomer and forms polyacrylamide gel when acrylamide molecules are polymerized with cross-linkers such as bisacrylamide by a free radical mechanism. The reaction is initiated using ammonium persulphate (APS) and catalyzed by N, N, N′, N′-tetramethylethylenediamine (TEMED) [13]. Polyacrylamide is mainly used for separating proteins or smaller fragments of nucleic acids. It has advantages over agarose gels on higher chemical stability, providing higher resolution, sharper peaks, greater capacity to load a large number of DNA fragments, and the efficient separation of molecules with smaller sizes [42]. The pore size of the polyacrylamide gels can be controlled by varying the concentrations of the monomer and cross-linker. Higher concentrations of the monomer and cross-linker yield smaller pores, and hence the gel can be used for the separation of smaller size molecules. The concentration of polyacrylamide gel is characterized by the relationship given below [43]:

where is equal to the total concentration of monomer and cross-linker. The higher values of %T result in gels with smaller pores, and lower values of %T produce gels with larger pore sizes. The normal values of %T used for protein separations are 1–10%. The proteins have zwitterion properties due to the presence of amino acid groups. Therefore, a surfactant such as SDS is used to denature proteins from tertiary structures to simple structures. SDS breaks the sulfide bonds between the proteins, denaturing them into their subunits, and provides an overall negative charge to the proteins [17].
Polyacrylamide gels can also be cured inside microchannels via the photoinitiation of monomers using UV light exposure such as in Herr et al. [44], who miniaturized SDS-PAGE for the first time for protein-SDS separations. Firstly, the separation channels were washed with Deionized (DI) water and then NaOH to deprotonate the silanol groups on the glass surface (Figure 3A). Secondly, acrylamide/bisacrylamide and 0.2% (w/v) photoinitiator solutions in tris/glycine/SDS buffer were filled in the separation channel and exposed to UV light to initiate the polymerization as shown in Figure 3B,C. A mask was also used to cross-link the monomer in only unmasked regions for the purpose of fabricating gradient gels (Figure 3D). Finally, the SDS-PAGE separation of R-lactalbumin, trypsin inhibitor, carbonic anhydrase, and alcohol dehydrogenase was performed in a microchannel polymerized with 6% polyacrylamide gel, as shown in Figure 3E. In another study, Kirby et al. [45] developed a two-step method to coat a microchip glass surface. Firstly, the microchannels were functionalized using 3-(trimethoxysilyl) propyl, methacrylate, and glacial acetic acid. Secondly, acrylamide, with a 5% photoinitiator, was flushed through the channel and then exposed to UV light. This method prepares a thin layer of polyacrylamide coating on the surface of the glass to control the polymerization of the separation gels.
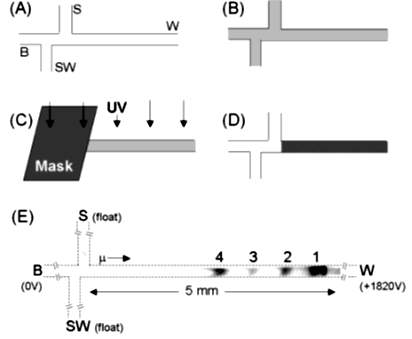
Figure 3. Photopolymerization of polyacrylamide gel inside the microchannel: (A) NaOH-treated channels; (B) monomers solutions filled in a microchannel; (C,D) the exposure of the UV source and cross-linked region in the microchannel; and (E) the SDS-PAGE separation of the proteins on the 6% photopatterning gel [44].
Photopolymerized gels have been vastly used for SDS protein separations in microchannels. Hughes et al. [46] photopolymerized gels inside the microchannels and developed a protocol for high specificity protein isoforms. In another development, Herr’s group [47] designed and fabricated free-standing photopolymerized polyacrylamide gels for protein electrophoresis. Without fabricating separation channels, the authors only used the polymerized gel on the glass cover sheet and separated proteins in free-standing gels. Han et al. [48] also used polymerized gel to separate proteins on a microchip. The authors photopatterned SDS-PAGE in microchannels and separated fluorescently labeled proteins. Gradient gels were also fabricated by controlling the UV exposure on the microchips [49]. The polyacrylamide gels with 3.5–10% concentration were polymerized on the chip used for protein separations. It was shown that the gradient gels provide protein separation in 4 s at an ultra-short distance of 3 mm. Mei et al. [50] photopatterned gels inside a microfluidic chip and studied protein immunoblotting. Proteins were separated in two dimensions by applying electric fields and integrated several immunoblotting steps onto the chip to improve the efficiency of the separation and provide faster analyses.
Over the last decade, microfluidic chips have been fabricated with arrays of channels for high throughput on-chip detections [51]. In a study done by He et al. [52], the authors fabricated three channels on the microchip and achieved parallel separations of 100 bp DNA weight marker, feline panleukopenia virus (FPV) DNA, and negative control. The method proved to be 100 times faster than the gel electrophoresis for DNA separations. Aborn et al. [53] presented a high-throughput system for DNA sequencing with 786 channels. The study used two plates each with 384 channels and the automatic system for sample handling, separation, detection, and plate movement. One plate was investigated first, and after the completion of the analysis, the detector was automatically moved to the second plate.
Bousse et al. [38] developed the microchip-based gel electrophoresis of proteins with the sequential separation of proteins or DNA fragments for up to 12 samples. Dye staining and destaining steps were also integrated onto the microchip for high-throughput results. Herr et al. [9] fabricated the microchip for the analysis of MMP-8, which is a disease biomarker for periodontitis in saliva. The microchip integrated the sample loading channels with a larger pore size photopolymerized gel, separation channels with a smaller pore size gel, and a membrane for on-chip sample concentration. Kelly et al. [10] reported the first rapid and sensitive chip-based immunoassay device to measure the tear-related disease biomarker from human tear fluids. The authors detected the Lactoferrin (Lf), which is a tear-specific biomarker for Sjogren’s Syndrome, and the results were comparable to ELISA measurements of Lactoferrin. These studies have proven the potential and importance of microchip electrophoresis as compared to standard gel electrophoresis, and offer superior performance in shorter times, with robustness and the integration of multiple functions such as washing, labeling and detections.
3.3. Microchip Western Blotting (µWB)
Western blotting (WB) is a powerful technique to detect specific and rare proteins from cell extracts [54]. The proteins are separated by SDS-PAGE and transferred to a membrane for immunodetection [55]. The working principle of Western blotting involves three steps. Firstly, proteins extracted from cells are loaded onto the polyacrylamide gel for separation by SDS-PAGE. Secondly, the gel containing protein bands is placed on a membrane to adsorb the molecules on the surface, and protein bands are transferred to a nitrocellulose or polyvinylidene fluoride (PVDF) membrane upon the application of an electric field in a vertical direction. Thirdly, membranes are incubated with antibodies (fluorescently labeled) to visualize the distinct protein bands from the cell. Western blotting can qualitatively analyze the proteins, but it cannot provide quantitative analysis and it also takes from 8 h to 1 day to complete the analysis [55]. Microchip Western blotting (µWB), on the other hand, provides fast and sensitive assays. For example, Kennedy’s group [56] attempted to miniaturize the Western blotting by precisely interfacing microchip electrophoresis with protein capture membrane, as shown in Figure 4A. The authors separated the SDS-complex proteins in a cross-chip and captured protein band on a moving PVDF membrane. The membrane was further used for incubation with antibodies and detection purposes. While the authors were successful in capturing multiple bands on the membrane, the separation of a complex protein sample can be challenging due to the increased number of bands, diffusivity and separation efficiency.
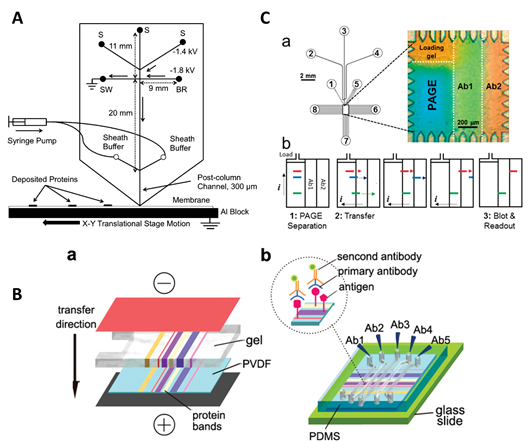
Figure 4. Overview of the microchip Western blotting (µWB) techniques. (A) The schematic of the microchip interfaced with the polyvinylidene fluoride (PVDF) membrane. Separated proteins are captured on the membrane in narrow bands moving under the separation channels [56]; (B) the schematic of the microchip electroblotting: (a) protein transfer to membrane; (b) the polydimethyl siloxane (PDMS) microchip is interfaced with the membrane and different antibody solutions are filled in the channels [55]; (C) schematic of the immunoblotting device: (a) design of the microfluidic chip and microfluidic chamber showing native gel electrophoresis and antibody labeling regions; and (b) the schematic of the protocols for Western blotting regions [57].
Pan et al. [55] developed a method for microfluidic Western blot and integrated sample loading, separation and antibody labeling on a single microchip, as shown in Figure 4B. Briefly, the proteins were separated by SDS-PAGE on a microchip, transferred to a PVDF membrane incorporated into the microchip device, and immune-reacted with antibodies introduced into the parallel microfluidic channels. Figure 4C shows another example of Western blotting assay on a single microchip to separate multianalytes [57]. Without any pre-relabeling steps, the robust and automated analyses required only 5 min to complete and provided the highest sensitivity as compared to the previous Western blot analyses [55][56]. The transfer of bands to membranes offers some advantages generally gained via standard Western blotting, however, the multiple labeling steps add complexity in the process where the flow of these antibodies/labeling reagents requires external controls or efficient deposition into the microchannels. Furthermore, the injection of the ultra-low amount of samples into separation channels makes it difficult to detect low concentration bands on the microchip.
3.4. Microchip Isoelectric Focusing (Microchip IEF)
The amphoteric molecules, like proteins, can be separated by adjusting different pH conditions in the buffer system. Briefly, the proteins in various regions of pH gradients have a different net charge and migrate in the opposite direction under the presence of an electric field. Each protein reaches a particular region of pH where its net charge becomes zero and the migration of the protein stops. This point is known as the isoelectric point (pI). This results in the focusing of different proteins along the gradient known as isoelectric focusing (IEF). The focused bands are passed through the detector by hydrodynamic or electrophoretic movement [58]. However, this movement adds band-broadening effect and hence, other techniques such as whole column imaging can reduce this effect [59].
From its earlier development [60], microchip IEF has been developed with the advancement of fabrication methods [61][62][63][64]. Shameli et al. [61] developed a polydimethyl siloxane (PDMS) hybrid chip for the separation of proteins by microchip IEF and detection by imaging the whole microchannel as shown in Figure 5A. Recently, Zhao et al. [62] developed a SlipChip-based method to perform microchip IEF in discrete droplets. The device was composed of two micromilled plastic layers with wells fabricated on both. The layers were aligned in such a way that the continuous zig-zag channel was formed as shown in Figure 5B. Furthermore, these droplets containing IEF components were collected for further analysis. Figure 5C shows six focused pI markers (pI 4.0, 5.5, 7.2, 7.6, 8.1 and 9.0) in the IEF channel. The fluorescent images illustrate the focused band (pI 5.5) before and after compartmentalization in a zig-zag channel.
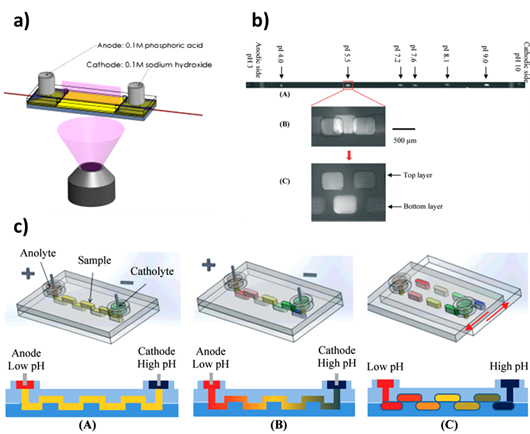
Figure 5. Overview of isoelectric focusing (IEF)–microchip electrophoresis (MCE): a) the schematic of the quarts substrate with the whole chip imaging via the SU-8 slit [61]; b) the schematic of IEF SlipChip illustrating the sample loading and pH gradient establishment in a zig-zag channel (A,B) and the droplet generation (C) of IEF fragments [62]; and (c) the separation of pI markers (pI 4.0, 5.5, 7.2,7.6, 8.1 and 9.0) in the IEF channel (A) and fluorescent images of the focused band (pI 5.5) before (B) and after (C) compartmentalization [62].
IEF is usually coupled with electrophoresis to increase the resolving power known as 2D-gel electrophoresis and was first used by Farrel [65] in 1975 to separate proteins by isoelectric focusing and SDS-PAGE in two directions. The separation in 2D-electrophoresis is achieved in three steps. Firstly, proteins are separated on the basis of the differences in their pI value at different pH regions. Secondly, proteins focused by IEF are equilibrated with SDS to break disulphide bonds and provide them with net negative charges. Thirdly, the proteins are separated in the second direction with SDS-PAGE. The ampholytes are removed by mixing trichloroacetic acid (TCA) with staining dye, and the gel is discolored with acetic acid [66][67].
2D-electrophoresis in microfluidics can be very advantageous as IEF can focus proteins in very narrow and concentrated bands. For instance, plastic microchip was fabricated with the IEF channel in one direction and CE channels were perpendicular. Actuated valves embedded in the PDMS layer were used to inject IEF focused proteins into separation channels [68]. In another development, Shuang et al. [69] fabricated a 2D separation device with 10 channels for isoelectric focusing in one direction and the cross channel for electrophoretic separation in second direction. The microchip ran the IEF separation in one direction and after focusing the protein bands in the channel, the second dimensional SDS-PAGE was achieved in 10 long channels.
References
- Tiselius, A. A new apparatus for electrophoretic analysis of colloidal mixtures. Trans. Faraday Soc. 1937, 33, 524–531.Tiselius, A. A new apparatus for electrophoretic analysis of colloidal mixtures. Trans. Faraday Soc. 1937, 33, 524–531.
- Ostergaard, J.; Jensen, H. Simultaneous evaluation of ligand binding properties and protein size by electrophoresis and Taylor dispersion in capillaries. Anal. Chem. 2009, 81, 8644–8648.Ostergaard, J.; Jensen, H. Simultaneous evaluation of ligand binding properties and protein size by electrophoresis and Taylor dispersion in capillaries. Anal. Chem. 2009, 81, 8644–8648.
- Migneault, I.; Dartiguenave, C.; Vinh, J.; Bertrand, M.J.; Waldron, K.C. Two Glutaraldehyde-Immobilized Trypsin Preparations for Peptide Mapping by Capillary Zone Electrophoresis, Liquid Chromatography, and Mass Spectrometry. J. Liq. Chromatogr. Relat. Technol. 2008, 31, 789–806.Migneault, I.; Dartiguenave, C.; Vinh, J.; Bertrand, M.J.; Waldron, K.C. Two Glutaraldehyde-Immobilized Trypsin Preparations for Peptide Mapping by Capillary Zone Electrophoresis, Liquid Chromatography, and Mass Spectrometry. J. Liq. Chromatogr. Relat. Technol. 2008, 31, 789–806.
- Pereira, F.; Hassard, S.; Hassard, J.; deMello, A. CE of dsDNA in low-molecular-weight polyethylene oxide solutions. Electrophoresis 2009, 30, 2100–2109.Pereira, F.; Hassard, S.; Hassard, J.; deMello, A. CE of dsDNA in low-molecular-weight polyethylene oxide solutions. Electrophoresis 2009, 30, 2100–2109.
- Huang, X.C.; Quesada, M.A.; Mathies, R.A. DNA sequencing using capillary array electrophoresis. Anal. Chem. 2002, 64, 2149–2154.Huang, X.C.; Quesada, M.A.; Mathies, R.A. DNA sequencing using capillary array electrophoresis. Anal. Chem. 2002, 64, 2149–2154.
- Haeberle, S.; Zengerle, R. Microfluidic platforms for lab-on-a-chip applications. Lab Chip 2007, 7, 1094–1110.Haeberle, S.; Zengerle, R. Microfluidic platforms for lab-on-a-chip applications. Lab Chip 2007, 7, 1094–1110.
- Koutny, L.B.; Schmalzing, D.; Taylor, T.A.; Fuchs, M. Microchip electrophoretic immunoassay for serum cortisol. Anal. Chem. 1996, 68, 18–22.Koutny, L.B.; Schmalzing, D.; Taylor, T.A.; Fuchs, M. Microchip electrophoretic immunoassay for serum cortisol. Anal. Chem. 1996, 68, 18–22.
- Karns, K.; Herr, A.E. Human tear protein analysis enabled by an alkaline microfluidic homogeneous immunoassay. Anal. Chem. 2011, 83, 8115–8122.Karns, K.; Herr, A.E. Human tear protein analysis enabled by an alkaline microfluidic homogeneous immunoassay. Anal. Chem. 2011, 83, 8115–8122.
- Herr, A.E.; Hatch, A.V.; Throckmorton, D.J.; Tran, H.M.; Brennan, J.S.; Giannobile, W.V.; Singh, A.K. Microfluidic immunoassays as rapid saliva-based clinical diagnostics. Proc. Natl. Acad. Sci. USA 2007, 104, 5268–5273.Herr, A.E.; Hatch, A.V.; Throckmorton, D.J.; Tran, H.M.; Brennan, J.S.; Giannobile, W.V.; Singh, A.K. Microfluidic immunoassays as rapid saliva-based clinical diagnostics. Proc. Natl. Acad. Sci. USA 2007, 104, 5268–5273.
- Wang, M.; Roman, G.T.; Perry, M.L.; Kennedy, R.T. Microfluidic chip for high efficiency electrophoretic analysis of segmented flow from a microdialysis probe and in vivo chemical monitoring. Anal. Chem. 2009, 81, 9072–9078.Wang, M.; Roman, G.T.; Perry, M.L.; Kennedy, R.T. Microfluidic chip for high efficiency electrophoretic analysis of segmented flow from a microdialysis probe and in vivo chemical monitoring. Anal. Chem. 2009, 81, 9072–9078.
- Dishinger, J.F.; Reid, K.R.; Kennedy, R.T. Quantitative monitoring of insulin secretion from single islets of Langerhans in parallel on a microfluidic chip. Anal. Chem. 2009, 81, 3119–3127.Dishinger, J.F.; Reid, K.R.; Kennedy, R.T. Quantitative monitoring of insulin secretion from single islets of Langerhans in parallel on a microfluidic chip. Anal. Chem. 2009, 81, 3119–3127.
- Magdeldin, S. Gel Electrophoresis–Principles and Basics; BoD–Books on Demand: Norderstedt, Germany, 2012. [Google Scholar]Magdeldin, S. Gel Electrophoresis–Principles and Basics; BoD–Books on Demand: Norderstedt, Germany, 2012.
- Gel Electrophoresis: Nucleic Acids (Essential Techniques); Wiley-Blackwell: Hoboken, NJ, USA, 1995.
- Stellwagen, E.; Stellwagen, N.C. Determining the electrophoretic mobility and translational diffusion coefficients of DNA molecules in free solution. Electrophoresis 2002, 23, 2794–2803.
- Lin, S.-K. Physical Biochemistry: Principles and Applications. By David Sheehan. Molecules 2000, 5, 1517.
- Landers, J.P. Handbook of Capillary and Microchip Electrophoresis and Associated Microtechniques, 3rd ed.; CRC Press: Boca Raton, FL, USA, 2007. [Google Scholar]
- Dolník, V. Wall coating for capillary electrophoresis on microchips. Electrophoresis 2004, 25, 3589–3601.
- Dolnik, V.; Liu, S.; Jovanovich, S. Capillary electrophoresis on microchip. Electrophoresis 2000, 21, 41–54.
- Llopis, S.L.; Osiri, J.; Soper, S.A. Surface modification of poly(methyl methacrylate) microfluidic devices for high-resolution separations of single-stranded DNA. Electrophoresis 2007, 28, 984–993.
- Qu, H.; Wang, H.; Huang, Y.; Zhong, W.; Lu, H.; Kong, J.; Yang, P.; Liu, B. Stable microstructured network for protein patterning on a plastic microfluidic channel: Strategy and characterization of on-chip enzyme microreactors. Anal. Chem. 2004, 76, 6426–6433.
- Okada, H.; Kaji, N.; Tokeshi, M.; Baba, Y. Rinse and evaporation coating of poly(methyl methacrylate) microchip for separation of sodium dodecyl sulfate-protein complex. J. Chromatogr. A 2008, 1192, 289–293.
- Currie, C.A.; Shim, J.S.; Lee, S.H.; Ahn, C.; Limbach, P.A.; Halsall, H.B.; Heineman, W.R. Comparing polyelectrolyte multilayer-coated PMMA microfluidic devices and glass microchips for electrophoretic separations. Electrophoresis 2009, 30, 4245–4250.
- Ermakov, S.V.; Jacobson, S.C.; Ramsey, J.M. Computer simulations of electrokinetic injection techniques in microfluidic devices. Anal. Chem. 2000, 72, 3512–3517.
- Harrison, D.J.; Manz, A.; Fan, Z.; Luedi, H.; Widmer, H.M. Capillary electrophoresis and sample injection systems integrated on a planar glass chip. Anal. Chem. 1992, 64, 1926–1932.
- Hardt, S.; Schönfeld, F. Microfluidic Technologies for Miniaturized Analysis Systems; Springer Science & Business Media: Berlin/Heidelberg, Germany, 2007. [Google Scholar]
- Giddings, J.C. Unified Separation Science; John Wiley Sons: New York, NY, USA, 1991; pp. 97–101. [Google Scholar]
- Dolnik, V.; Liu, S. Applications of capillary electrophoresis on microchip. J. Sep. Sci. 2005, 28, 1994–2009.
- Novotny, M.; Springston, S.R.; Peaden, P.A.; Fjeldsted, J.C.; Lee, M.L. Capillary supercritical fluid chromatography. Anal. Chem. 1981, 53, 407A–414A.
- Lauer, H.H.; McManigill, D. Capillary zone electrophoresis of proteins in untreated fused silica tubing. Anal. Chem. 1986, 58, 166–170.
- Li, Y.; Champion, M.M.; Sun, L.; Champion, P.A.D.; Wojcik, R.; Dovichi, N.J. Capillary Zone Electrophoresis-Electrospray Ionization-Tandem Mass Spectrometry as an Alternative Proteomics Platform to Ultraperformance Liquid Chromatography-Electrospray Ionization-Tandem Mass Spectrometry for Samples of Intermediate Complexity. Anal. Chem. 2012, 84, 1617–1622.
- Stewart, D.T.; Celiz, M.D.; Vicente, G.; Colón, L.A.; Aga, D.S. Potential use of capillary zone electrophoresis in size characterization of quantum dots for environmental studies. TrAC-Trends Anal. Chem. 2011, 30, 113–122.
- Joneli, J.; Wanzenried, U.; Schiess, J.; Lanz, C.; Caslavska, J.; Thormann, W. Determination of carbohydrate-deficient transferrin in human serum by capillary zone electrophoresis: Evaluation of assay performance and quality assurance over a 10-year period in the routine arena. Electrophoresis 2013, 34, 1563–1571.
- Colyer, C.L.; Mangru, S.D.; Harrison, D.J. Microchip-based capillary electrophoresis of human serum proteins. J. Chromatogr. A 1997, 781, 271–276.
- Hayes, M.A.; Kheterpal, I.; Ewing, A.G. Electroosmotic flow control and surface conductance in capillary zone electrophoresis. Anal. Chem. 1993, 65, 2010–2013.
- Mitra, I.; Marczak, S.P.; Jacobson, S.C. Microchip electrophoresis at elevated temperatures and high separation field strengths. Electrophoresis 2014, 35, 374–378.
- Ye, F.; Shi, M.; Huang, Y.; Zhao, S. Noncompetitive immunoassay for carcinoembryonic antigen in human serum by microchip electrophoresis for cancer diagnosis. Clin. Chim. Acta Int. J. Clin. Chem. 2010, 411, 1058–1062.
- Cianciulli, C.; Hahne, T.; Wätzig, H. Capillary gel electrophoresis for precise protein quantitation. Electrophoresis 2012, 33, 3276–3280.
- Bousse, L.; Mouradian, S.; Minalla, A.; Yee, H.; Williams, K.; Dubrow, R. Protein sizing on a microchip. Anal. Chem. 2001, 73, 1207–1212.
- Root, B.E.; Zhang, B.; Barron, A.E. Size-based protein separations by microchip electrophoresis using an acid-labile surfactant as a replacement for SDS. Electrophoresis 2009, 30, 2117–2122.
- Shadpour, H.; Soper, S.A. Two-dimensional electrophoretic separation of proteins using poly(methyl methacrylate) microchips. Anal. Chem. 2006, 78, 3519–3527.
- Shen, Z.; Liu, X.; Long, Z.; Liu, D.; Ye, N.; Qin, J.; Dai, Z.; Lin, B. Parallel analysis of biomolecules on a microfabricated capillary array chip. Electrophoresis 2006, 27, 1084–1092.
- Lee, P.Y.; Costumbrado, J.; Hsu, C.-Y.; Kim, Y.H. Agarose gel electrophoresis for the separation of DNA fragments. J. Vis. Exp. 2012, e3923.
- Kurien, B.T.; Scofield, R.H. Western blotting. Methods 2006, 38, 283–293.
- Herr, A.E.; Singh, A.K. Photopolymerized cross-linked polycrylamide gels for on-chip protein sizing. Anal. Chem. 2004, 76, 4727–4733.
- Kirby, B.J.; Wheeler, A.R.; Zare, R.N.; Fruetel, J.A.; Shepodd, T.J. Programmable modification of cell adhesion and zeta potential in silica microchips. Lab Chip 2003, 3, 5–10.
- Hughes, A.J.; Lin, R.K.C.; Peehl, D.M.; Herr, A.E. Microfluidic integration for automated targeted proteomic assays. Proc. Natl. Acad. Sci. USA 2012, 109, 5972–5977.
- Duncombe, T.A.; Herr, A.E. Photopatterned free-standing polyacrylamide gels for microfluidic protein electrophoresis. Lab Chip 2013, 13, 2115–2123.
- Han, J.; Singh, A.K. Rapid protein separations in ultra-short microchannels: Microchip sodium dodecyl sulfate-polyacrylamide gel electrophoresis and isoelectric focusing. J. Chromatogr. A 2004, 1049, 205–209.
- Lo, C.T.; Throckmorton, D.J.; Singh, A.K.; Herr, A.E. Photopolymerized diffusion-defined polyacrylamide gradient gels for on-chip protein sizing. Lab Chip 2008, 8, 1273–1279.
- Hou, C.; Herr, A.E. Ultrashort separation length homogeneous electrophoretic immunoassays using on-chip discontinuous polyacrylamide gels. Anal. Chem. 2010, 82, 3343–3351.
- Hassan, S.U.; Morgan, H.; Zhang, X.; Niu, X. Droplet Interfaced Parallel and Quantitative Microfluidic-Based Separations. Anal. Chem. 2015, 87, 3895–3901.
- Nan, H.; Yoo, D.J.; Kang, S.H. Fast parallel detection of feline panleukopenia virus DNA by multi-channel microchip electrophoresis with programmed step electric field strength. J. Sep. Sci. 2013, 36, 350–355.
- Aborn, J.H.; El-Difrawy, S.A.; Novotny, M.; Gismondi, E.A.; Lam, R.; Matsudaira, P.; Mckenna, B.K.; O’Neil, T.; Streechon, P.; Ehrlich, D.J. A 768-lane microfabricated system for high-throughput DNA sequencing. Lab Chip 2005, 5, 669–674.
- Hames, B.D. An Introduction to Polyacrylamide Gel Electrophoresis. Gel Electrophoresis of Proteins: A Practical Approach, 3rd ed.; Oxford University Press: New York, NY, USA, 1988. [Google Scholar]
- Pan, W.; Chen, W.; Jiang, X. Microfluidic western blot. Anal. Chem. 2010, 82, 3974–3976.
- Jin, S.; Anderson, G.J.; Kennedy, R.T. Western blotting using microchip electrophoresis interfaced to a protein capture membrane. Anal. Chem. 2013, 85, 6073–6079.
- Tia, S.Q.; He, M.; Kim, D.; Herr, A.E. Multianalyte on-chip native western blotting. Anal. Chem. 2011, 83, 3581–3588.
- Rodriguez-Diaz, R.; Wehr, T.; Zhu, M. Capillary isoelectric focusing. Electrophoresis 1997, 18, 2134–2144.
- Castro, E.R.; Manz, A. Present state of microchip electrophoresis: State of the art and routine applications. J. Chromatogr. A 2015, 1382, 66–85.
- Mao, Q.; Pawliszyn, J. Demonstration of isoelectric focusing on an etched quartz chip with UV absorption imaging detection. Analyst 1999, 124, 637–641.
- Shameli, S.M.; Elbuken, C.; Ou, J.; Ren, C.L.; Pawliszyn, J. Fully integrated PDMS/SU-8/quartz microfluidic chip with a novel macroporous poly dimethylsiloxane (PDMS) membrane for isoelectric focusing of proteins using whole-channel imaging detection. Electrophoresis 2011, 32, 333–339.
- Zhao, Y.; Pereira, F.; deMello, A.J.; Morgan, H.; Niu, X. Droplet-based in situ compartmentalization of chemically separated components after isoelectric focusing in a Slipchip. Lab Chip 2014, 14, 555–561.
- Walowski, B.; Hüttner, W.; Wackerbarth, H. Generation of a miniaturized free-flow electrophoresis chip based on a multi-lamination technique-isoelectric focusing of proteins and a single-stranded DNA fragment. Anal. Bioanal. Chem. 2011, 401, 2465–2471.
- Ishibashi, R.; Kitamori, T.; Shimura, K. Two-step perpendicular free-solution isoelectric focusing in a microchamber array chip. Lab Chip 2010, 10, 2628–2631.
- O’Farrell, P.H. High resolution two-dimensional electrophoresis of proteins. J. Biol. Chem. 1975, 250, 4007–4021. [Google Scholar]
- Mackintosh, J.A.; Choi, H.Y.; Bae, S.H.; Veal, D.A.; Bell, P.J.; Ferrari, B.C.; Van Dyk, D.D.; Verrills, N.M.; Paik, Y.K.; Karuso, P. A fluorescent natural product for ultra sensitive detection of proteins in one-dimensional and two-dimensional gel electrophoresis. Proteomics 2003, 3, 2273–2288.
- Cid, C.; Garcia-Descalzo, L.; Casado-Lafuente, V.; Amils, R.; Aguilera, A. Proteomic analysis of the response of an acidophilic strain of Chlamydomonas sp. (Chlorophyta) to natural metal-rich water. Proteomics 2010, 10, 2026–2036.
- Gu, P.; Liu, K.; Chen, H.; Nishida, T.; Fan, Z.H. Chemical-Assisted Bonding of Thermoplastics/Elastomer for Fabricating Microfluidic Valves. Anal. Chem. 2011, 83, 446–452.
- Yang, S.; Liu, J.; Lee, C.S.; DeVoe, D.L. Microfluidic 2-D PAGE using multifunctional in situ polyacrylamide gels and discontinuous buffers. Lab Chip 2009, 9, 592–599.