Your browser does not fully support modern features. Please upgrade for a smoother experience.
Please note this is a comparison between Version 3 by Nora Tang and Version 2 by Nora Tang.
The Barnett critique states that there is an internal inconsistency between the theory that is implied by simple sum monetary aggregation (perfect substitutability among components) and the economic theory that produces the models within which those aggregates are used. That inconsistency causes the appearance of unstable demand and supply for money. The incorrect inference of unstable money demand has caused serious harm to the field of monetary economics.
- Divisia monetary aggregates
- demand for money
- Barnett critique
- index number theory
- aggrega-tion theory
1. History
The term “Barnett Critique” was coined and defined in a British paper published by the St. Louis Federal Reserve Bank, “Empirical Evidence on the Recent Behavior and Usefulness of Simple-Sum and Weighted Measures of the Money Stock” by Chrystal and MacDonald
The term “Barnett Critique” was coined and defined in a British paper published by the St. Louis Federal Reserve Bank, “Empirical Evidence on the Recent Behavior and Usefulness of Simple-Sum and Weighted Measures of the Money Stock” by Chrystal and MacDonald
[1]
. By conducting empirical tests with the St. Louis Federal Reserve’s reduced form policy equation (originated by Andersen and Jorden
[2]
), Chrystal and MacDonald compared the statistical properties of differently defined monetary aggregates, including simple sum and Divisia aggregates, among others. As explained below, the Divisia monetary aggregates are produced using the Divisia quantity index formula with user cost prices. Chrystal and MacDonald found that the Divisia aggregates, derived and advocated by Barnett
[3]
, performed best as an economic indicator by showing the strong causal relationship with important economic variables and recommended that Divisia monetary aggregates be produced and supplied by the Federal Reserve at all levels of aggregation, so that researchers can test thoroughly the performance of these indicators. Subsequent confirming reconsideration of the Barnett Critique was published by Belongia and Ireland
[4]
among many others, using all available criteria.
Since 1970, economies throughout the world have been experiencing substantial monetary and financial innovation. As the structure of financial innovation has been expanding, internal consistency of monetary aggregation with economic theory is growing in importance. Divisia aggregation is directly derived from economic theory and assures consistency with economic theory at all levels of aggregation. An international library of Divisia monetary and financial aggregation research and data are maintained online by the Center for Financial Stability (CFS) in New York City.
The appearance of instability of the demand for money function disappears, if the relevant neoclassical microeconomic aggregation and index number theories are used to produce the monetary aggregates, which then would nest properly within the money demand functions. In fact, studies of the demand for money function using competently produced monetary aggregates and state-of-the-art demand system modeling methodology have found the demand for money function to be more stable and more easily modeled than the demand for most other consumer goods. See, e.g.,
[5]
(ch. 2, 7, 9, 16, 17, 18, 24),
[6]
(ch. 1, 4, 8), and
[7] (pp. 92–110).
1.1. A Competition
The date 26 September 1983 could be remembered as that on which an unusual controlled experiment of the Barnett critique was conducted. On that same day, Milton Friedman and William A. Barnett both went on the record by publishing their conflicting views and forecasts in major magazines, providing opposite conclusions about the likelihood of inflation and recession, based on analogous data sources, differing only by the method of aggregation. In “A Case of Bad Good News,” Friedman wrote in Newsweek magazine (p. 84) that a huge spike in the growth rate of the M2 money supply had occurred; would surely cause inflation; and would be followed by a recession caused by overreaction of the Federal Reserve to the inflation.
Friedman’s last conclusion, of “unavoidable recession,” was a uniquely monetarist view. Not all economists agreed with that inclusion. For example, economists of the Real Business Cycle school did not agree that an overreaction of monetary policy would cause a recession. They would have agreed with an unavoidable spike of inflation caused by a huge spike in the growth rate of money, but not subsequent changes in real variables, such as unemployment and output. According to that view, the Federal Reserve has no control over real variables, only nominal. At the time of Friedman’s dramatic article in Newsweek, there had indeed been a huge spike in the growth rate of simple sum M2. Friedman was very confident of his inflation forecast, which did not contradict the views of non-monetarist real business cycle theorists.
According to the Barnett Critique, Friedman should have used a properly measured index number for M2, such as Divisia, Fisher ideal, Paasche, or Laspeyres. In his article with the title “What Explosion?” in Forbes magazine on that exact same day, Barnett wrote (p. 196), that there had been no spike in Divisia M2; there would be no surge in inflation and no recession from a Federal Reserve overreaction to an inflation surge that would not occur.
1.2. Results of the Competition
There was no surge in inflation or recession following the non-inflation. History proved that Barnett’s conclusion was right, and Friedman’s was wrong, although the huge surge in simple sum M2 seen by Friedman did indeed occur. Barnett explained that the reason for the misleading spike in simple sum M2 was a change in regulation. The Federal Reserve had just permitted banks to introduce a new type of monetary asset, Money Market Deposit Accounts (MMDA), which, at that time, were yielding a higher market interest rate than other assets included in M2. Of less importance, the Federal Reserve had also just permitted banks to introduce super-NOW accounts, which similarly were at that time providing high market interest rates. Many economic agents transferred money into those new high-yielding accounts with the source of funds often coming from outside M2 as, for example, from money market mutual funds and Treasury bills, being held largely for investment motives, while yielding high unregulated market interest rates.
The transfer of investment motivated funds into MMDA accounts in banks (and less importantly super-NOW accounts) caused the simple sum aggregates to surge, since deposits entered into the newly permitted accounts were being added into the simple-sum monetary aggregates without weights. But the new deposits were largely motivated by their interest rate yields, as opposed to currency and demand deposits, which did not yield interest and were being held for their monetary services in transactions. However, since the new deposit types were yielding very high-interest rates, their user cost prices, reflecting the opportunity cost from foregone interest, were very low. Divisia monetary aggregates remove the investment motive. Those new monetary innovations, priced at their low user cost prices, smoothly integrated into the Divisia monetary aggregates without creating a spike. The excessive weighting of MMDAs (and super-NOWs) in the simple sum monetary aggregates was the reason that the simple sum and Divisia growth rates at the time of the innovation were so drastically different.
(pp. 92–110).
A Competition
The date 26 September 1983 could be remembered as that on which an unusual controlled experiment of the Barnett critique was conducted. On that same day, Milton Friedman and William A. Barnett both went on the record by publishing their conflicting views and forecasts in major magazines, providing opposite conclusions about the likelihood of inflation and recession, based on analogous data sources, differing only by the method of aggregation. In “A Case of Bad Good News,” Friedman wrote in Newsweek magazine (p. 84) that a huge spike in the growth rate of the M2 money supply had occurred; would surely cause inflation; and would be followed by a recession caused by overreaction of the Federal Reserve to the inflation.
Friedman’s last conclusion, of “unavoidable recession,” was a uniquely monetarist view. Not all economists agreed with that inclusion. For example, economists of the Real Business Cycle school did not agree that an overreaction of monetary policy would cause a recession. They would have agreed with an unavoidable spike of inflation caused by a huge spike in the growth rate of money, but not subsequent changes in real variables, such as unemployment and output. According to that view, the Federal Reserve has no control over real variables, only nominal. At the time of Friedman’s dramatic article in Newsweek, there had indeed been a huge spike in the growth rate of simple sum M2. Friedman was very confident of his inflation forecast, which did not contradict the views of non-monetarist real business cycle theorists.
According to the Barnett Critique, Friedman should have used a properly measured index number for M2, such as Divisia, Fisher ideal, Paasche, or Laspeyres. In his article with the title “What Explosion?” in Forbes magazine on that exact same day, Barnett wrote (p. 196), that there had been no spike in Divisia M2; there would be no surge in inflation and no recession from a Federal Reserve overreaction to an inflation surge that would not occur.
2. Reconsideration of the Competition Results
In retrospect, it would be interesting to ask now whether Barnett might have found a spike in a broader Divisia monetary aggregate, such as Divisia M4, currently favored by the Center for Financial Stability. We have done so in Figure 1. Comparing the monthly rate of growth of simple sum M2 and of the broad Divisia M4, an unusual spike in the growth rate of simple sum M2 was identified at the beginning of 1983 but not of Divisia M4. Based on Figure 1, the growth rate of simple sum M2 spiked to 3% a month. Annualized, that would have been about 36% a year, the alarming growth rate Milton Friedman saw and warned about. That would indeed have been an unusual rate of growth of the money supply. However, Divisia M4 displayed no evidence of such a spike at all, further confirming Barnett’s finding with Divisia M2 in the Forbes article.
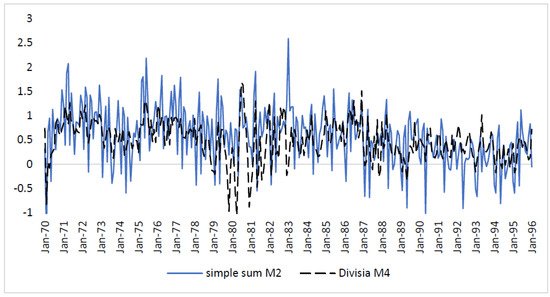
Figure 1. Monthly percentage growth rates of simple sum M2 and Divisia M4. Source: Federal Reserve Economic Data (Simple sum M2), Center for Financial Stability (Divisia M4).
The introduction of MMDAs was not a supply-side phenomenon. The Federal Reserve was not suddenly pumping up the money supply. The Federal Reserve had permitted entry of a new account type, permitting banks to compete with money market mutual funds. The result was a demand-side phenomenon. People were moving funds into those new assets at banks. The Federal Reserve itself was not increasing the money supply.
Results of the Competition
3. The High Road versus the Low Road
The Barnett Critique defined the “high road” in [8] to be research that insists on internal coherence (consistency) among data, theory, and econometrics. In contrast, along the “low road”, researchers can play fast and loose with data, theory, and econometrics. A consequence of low road research is paradoxes, puzzles, and controversies at every turn. Unfortunately, many empirical monetary economists have been influenced by the low road. The basic point to be made by the Barnett Critique is that low-road research inherently contains internal logical inconsistencies. The origin of many controversies in monetary economics has been the internal inconsistency of the formulas used to produce the data with the theory producing the models within which the data were used.
3.1. Implications of the Low Road
Does internal consistency matter? In the 1950s, monetary aggregates initially included only assets yielding no interest. Simple sum aggregation implies that all of its components are perfect substitutes having identical prices. That implicit assumption was satisfied by the earliest monetary aggregates, since the user cost price of all of the components was the same alternative rate of return on capital. The component assets had no own rates of interest of their own. However, if components have different user cost prices but are nevertheless perfect substitutes, there will be a corner solution. Economic agents will buy only the cheapest among the perfectly substitutable component assets. The asset having the lowest user cost prices (foregone interest) will be the assets having the highest own rate of interest.
Now that most component monetary assets yield interest, simple sum monetary aggregation implies a corner solution with only the highest yielding component remaining in existence. The other components logically cannot exist, since no one would hold them. If all monetary assets are perfect substitutes, as implied by simple sum aggregation, currency and non-interest-bearing demand deposits cannot exist. Their appearance in the economy and in the Federal Reserve’s monetary aggregates is an illusion. Assuming perfect substitutability consistent with simple sum aggregation, we could conclude that non-negotiable certificates of deposit can exist at a corner solution, since their yield is often higher than the yields on other components of simple sum monetary aggregates. In short, the simple sum monetary aggregates imply that we all are suffering from delusions, since we all believe that other monetary assets, such as currency and demand deposits, exist and are being held by many consumers—including ourselves. That is an implication of the simple sum monetary aggregation. The simple sum aggregates, based on incompetent index number and aggregation theory, should not be used within macroeconomic models based on economic theory.
3.2. Policy Errors
Numerous examples of policy errors exist of following the low road. A particularly dramatic example is documented in [9]. During the period of the “monetarist experiment” from 1980–1982, the Federal Reserve’s objective was to lower the rate of growth of the money supply from the double digit levels reached in the late 1970s to about 10% to decrease the inflation rate from double digit levels, with the intention of subsequently slowly lowering the rate of growth of the money supply to lower levels in the long run. The Federal Reserve had not intended to drop the rate of growth of the money supply immediately to long run target levels, since such a monetary shock was expected to cause a recession.
The simple sum monetary aggregates were indeed brought down to about 10% growth, as intended during that period. But the Divisia monetary aggregates were brought down to half that level, which did cause a recession. If the Federal Reserve had been targeting Divisia instead of simple sum money, the subsequent recession could have been avoided. During that time period, the Federal Reserve admirably followed a non-inflationary policy and successfully ended the inflation that had been accelerating during the prior decade, but the severity of the contractionary shock during the period of the “monetarist experiment” was unintended and caused by targeting simple sum rather than Divisia money, as clearly demonstrated in [9].
There was no surge in inflation or recession following the non-inflation. History proved that Barnett’s conclusion was right, and Friedman’s was wrong, although the huge surge in simple sum M2 seen by Friedman did indeed occur. Barnett explained that the reason for the misleading spike in simple sum M2 was a change in regulation. The Federal Reserve had just permitted banks to introduce a new type of monetary asset, Money Market Deposit Accounts (MMDA), which, at that time, were yielding a higher market interest rate than other assets included in M2. Of less importance, the Federal Reserve had also just permitted banks to introduce super-NOW accounts, which similarly were at that time providing high market interest rates. Many economic agents transferred money into those new high-yielding accounts with the source of funds often coming from outside M2 as, for example, from money market mutual funds and Treasury bills, being held largely for investment motives, while yielding high unregulated market interest rates.
4. Index Number Theory
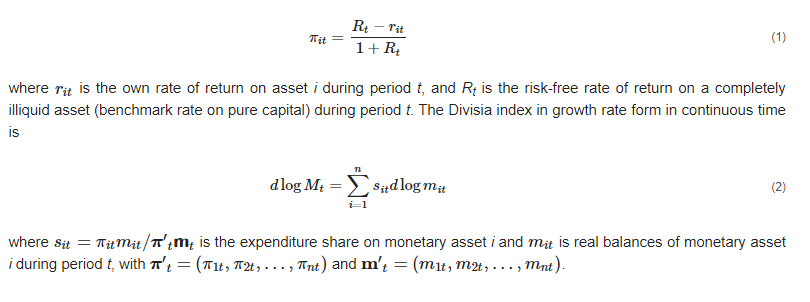
The Divisia index was originated by Francois Divisia [10] as a line integral in continuous time for perishable consumer goods. The growth rate of the Divisia index is a weighted average of component growth rates. At each instant of time, the weights in the growth rate aggregate are the expenditure shares of the components with user cost pricing. But the level of the index is not a weighted average of the levels of the components. The level is a deeply nonlinear line integral. The Divisia index is directly derived from optimizing consumer behavior. There is no approximation error. But economic data are not available in continuous time.
To discretize the continuous time Divisia index, it is necessary to decide where to measure the share weights within the discrete time interval. Tornqvist [11] proposed using the average of the share at the beginning and the share at the end of the discrete time period. The resulting index is chained, not fixed base, since the average shares move over time. Henri Theil [12] also advocated that discretization. Based on the research of Tornqvist and Theil, the resulting index often is called the Tornqvist–Theil Divisia index, or the Tornqvist–Theil index. Barnett simply calls it the “Divisia index in discrete time,” since the Tornqvist weighting is now universally accepted as providing the best discretization and resembles the Simpson’s rule approximation to the continuous-time line integral.
Another highly regarded index is the “Fisher ideal” index. That index consists of the geometric mean of the Laspeyres index and the Paasche index. The Fisher ideal index is used in many fields. The Commerce Department in the U.S. uses it in producing data for the national accounts. An important property of the Fisher ideal is self-duality: the dual to the Fisher ideal quantity index is the Fisher ideal price index. In practice, the difference between the growth rate of the Fisher ideal index and of the discrete time Divisia index is less than the roundoff error in the component data.
Compared to the Fisher ideal index, Divisia has two advantages. First, the formula of the Fisher index, as the geometric mean of two different indexes, is highly nonlinear and therefore difficult to explain to the people without expertise in index number theory. On the other hand, the Divisia index in growth rate form is much easier to explain as the share weighted average of component growth rates. Second is the relationship to its continuous time form. The original Divisia index in continuous time, under normal neoclassical optimality assumptions, is always exactly true, not an approximation. Divisia derived his index directly from the first-order conditions for constrained utility maximization under perfect certainty. Therefore, under perfect certainty, the continuous time Divisia index is a direct implication of microeconomic theory, so long as the existence assumption (weak separability of the components from other goods) is satisfied.
A literature exists on extension of index number theory to risk. The resulting theory replaces the perfect certainty first-order conditions with Euler equations and user cost prices with risk adjusted values. Examples of applications to monetary aggregation can be found in [13]. But so far, such extensions of Divisia monetary aggregates to risk have been found to be of limited empirical significance and hence are not presented further in this Encyclopedia entry.
On the other hand, the Tornqvist–Theil index is a statistical index number, as is the Fisher ideal index. Hence, the Divisia index in discrete time is an approximation. As with all discrete time statistical index numbers, the Tornqvist–Theil index has an error term. That error term is third order in the component changes. That third-order error is negligible, since the index is chained, aggregating typically over small monthly changes. The Fisher ideal and Tornqvist–Theil indexes are both second-order approximations in discrete time, with third-order remainder terms usually ignored in the data. Since the Divisia index in continuous time is exact, we can characterize the Tornqvist–Theil index as a second-order approximation to Francois Divisia’s continuous time index.
Erwin Diewert [14] defined the class of “superlative index numbers” as those producing a second-order approximation to the unknown exact aggregator function. He proved that both the Tornqvist–Theil and Fisher ideal indexes are in that class. When used to measure aggregate monetary services in accordance with Barnett’s formulas [3], both indexes produce almost identical velocity of money and monetary growth.
The Divisia Monetary Aggregates
Barnett [3][15] derived the user-cost price formula needed to apply aggregation and index number theory to monetary aggregation. In particular, Barnett [3] proposed the discrete time Divisia monetary aggregates or the nearly identical Fisher ideal index to measure demand-side monetary services, using economic aggregation and index number theory. Barnett, Offenbacher, and Spindt [16] applied the resulting formula for the Divisia monetary aggregates to show that they perform far better than the corresponding simple sum aggregates relative to the tests being used at that time to compare monetary aggregates. As observed in that paper, Barnett’s Divisia monetary aggregates are elements of Diewert’s class of superlative quantity index numbers. While simple sum implies the same weighting of each component monetary asset, Divisia properly weights each monetary asset in accordance with aggregation and index number theory. Divisia monetary aggregates should be strictly preferable to the simple sum aggregates, since the component monetary assets are not perfect substitutes. The aggregation theoretic derivation assumes only that the weak separability condition necessary for existence of a quantity aggregator function holds. Without such existence, there is nothing to be approximated by aggregation and index number theory.
As derived by Barnett [3][15], the real user cost (equivalent rental price) of a monetary asset among n such assets is
5. Credit-Card Augmented Divisia Monetary Aggregates
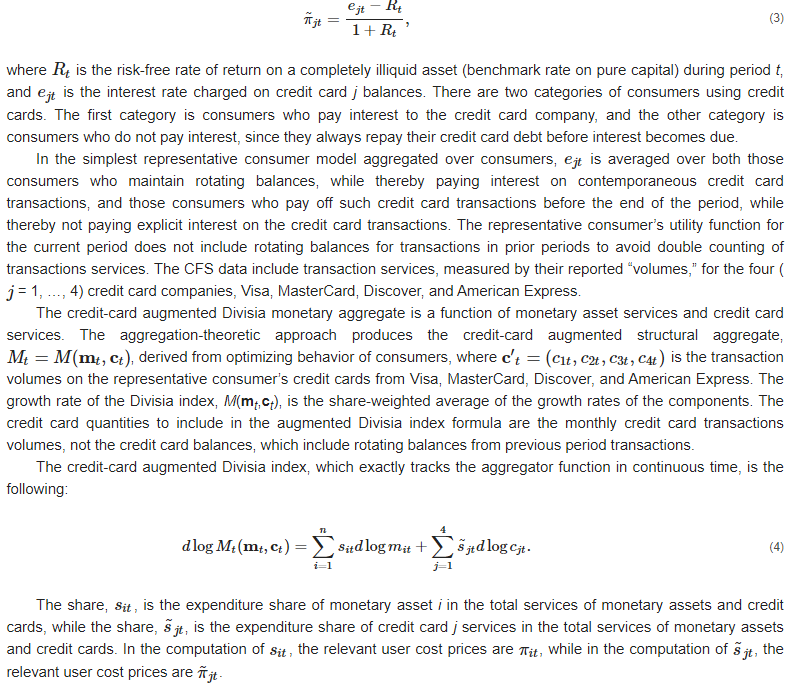
Credit-Card augmented Divisia monetary aggregates measure the money supply, including credit card transaction services. Barnett and Su [13] introduced the new monetary aggregates, including credit card transaction volume services. These new Divisia aggregates are provided to the public by the CFS along with the original Divisia aggregates not including credit card services. Credit cards had never before been included in simple sum measures of the money supply, despite the fact that credit cards clearly provide transaction services. The reason is accounting conventions. Accounting, and therefore simple sum aggregation, do not permit adding liabilities to assets. But by using economic theory instead of accounting, monetary and credit card services can be entered into a derived utility function to reflect the fact that money and credit cards provide similar services, such as liquidity and transactions services. In particular, credit cards provide deferred payment services not provided by money. The theory permits the measurement of the joint services of credit cards and money in accordance with index number theory. Index number theory measures service flows and is based on microeconomic aggregation theory, not accounting.5.1. Demand-Side Formula
The real user cost of credit card services, derived in Barnett and Su [13], is
5.2. Supply Side
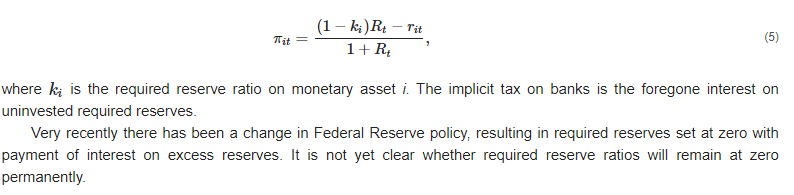
While demand-side aggregation theory is based on the microeconomic theory of rational consumer behavior, supply-side aggregation theory is based on rational firm behavior. Barnett and Su [17], derived the supply-side monetary aggregation theory for banks, which produce monetary services along with credit card deferred payment services. That theory is also relevant to shadow banking production of such services. The existence condition for an exact monetary services aggregate on the demand side is weak separability of the components within consumer utility functions, while on the supply side the existence condition is weak separability of the aggregate’s components within the financial intermediary’s technology. The existence of non-interest-bearing required reserves imposes an implicit tax on banks. This has been the case during most of US Federal Reserve history. Under those circumstances, Barnett [5] (pp. 49–99) derived the user cost price received by banks for providing and servicing monetary asset type i to be
6. Recent Literature
Following the appearance of the Barnett critique, considerable literature has found that Divisia is a far more appropriate money measure than simple sum for use within economic models. Divisia stabilizes those models and provides better model performance. For example, Belongia and Ireland [4] found that a Divisia monetary aggregate tracks the true aggregate almost perfectly, following a wide variety of macroeconomic shocks, both real and nominal. Keating and Smith [18] confirmed that a constant Divisia monetary aggregate growth rate rule would outperform all other rules using simple sum monetary aggregates or the monetary base, while a constant simple sum monetary growth rate rule would cause very high welfare loss.
Using economic aggregation theory, Drake and Fleissig [19] constructed UK aggregates for both consumption goods and monetary assets. They then estimated the elasticities of substitution between various consumption goods and monetary aggregates. They found that use of simple sum monetary aggregates often produces incorrect estimates of substitutability and misleading policy insights. Fisher, Hudson, and Pradhan [20] present evaluation of Divisia measures of money and appraisal of the theoretical foundations for the Divisia approach to monetary aggregation. They also describe the Bank of England’s construction of its Divisia monetary index for the UK.
In multiple research papers, Divisia outperforms simple sum in prediction ability. For example, Barnett, Chauvet, and Leiva-Leon [21] found that a model containing information on real economic activity, inflation, interest rates, and Divisia monetary aggregates produces the most accurate real time nowcasts of nominal GDP growth. Schunk [22] similarly provides the forecasting performance of Divisia monetary aggregates with a four-variable vector autoregression including real GDP, GDP deflator, Treasury bill rate, and monetary aggregates. Ellington [23] evaluates the relative empirical benefits of Divisia monetary aggregates and finds a strong link between Divisia money and economic activity over the business cycle, with that link substantially less prominent when using simple sum monetary aggregation. These studies also confirm the forecasting ability of Divisia aggregates by using out-of-sample forecasts of economic activity. Hundreds of papers have been published about the Barnett critique in over 40 countries throughout the world. A convenient source is the international library maintained online by the Center for Financial Stability (CFS) in New York City.
Barnett has authored or coauthored a very large number of papers published on the validity of the Barnett critique in solving problems associated with the use of simple sum monetary aggregation in modeling and in policy. Many of the most important of those studies have been reprinted in two books, Barnett and Serletis [5] and Barnett and Chauvet [6], with presentation and discussion of that research made widely available to the general public in Barnett [7].
Virtually every proposed method of evaluating the performance of monetary aggregates has been used in comparing simple sum versus Divisia monetary aggregates and in comparing narrow versus broad aggregation, beginning with [16]. Those results also have been gathered together in survey articles and books. See, e.g., [8] and Chapter 7 of [5]. The results by all available methods of comparison overwhelmingly support Divisia over simple sum at each level of aggregation. In comparing levels of aggregation, the Divisia monetary aggregates that perform best relative to most criteria are the properly weighted broadest aggregates, Divisia M3 and Divisia M4. But with simple sum aggregation, M2 performs better than the broader M3 and M4 (formerly called L) aggregates. The reason is that simple sum M3 and M4 place excessive weight on distant substitutes for monetary services. As a result, most central banks throughout the world have correctly discontinued publication of simple sum M3 and M4.
Finally, it should be observed that Equations (2) and (4) require the components of the monetary aggregate to be blockwise weakly separable in utility. That separability condition is the factorability assumption necessary for existence of an aggregator function to be tracked by an index number. Unlike strong separability, which is often rejected in econometric tests, clusterings of components that satisfy tests for weak separability tests are common. A large literature has appeared on testing that existence condition for the monetary aggregator function tracked by (2). Unfortunately, the currently available competing tests do not always produce the same results on admissible groupings. More research is needed on econometric tests for weak separability. A recent test for that existence condition for the credit card augmented aggregator function in (4) has appeared in [24].
7. Conclusions
Ongoing economic and financial innovations are continuing to produce substitutes for currency and demand deposits relevant to the economy’s liquidity, transactions services, and other services normally associated with money. As a result, simple sum aggregation and the Barnett critique are increasing in relevancy and in understanding evolving defects in macroeconomic modeling and policy. Internal consistency among aggregation theoretic assumptions and the assumptions and structure relevant to the models within which the data are used is critically important. These considerations need to be taken into account and correctly utilized at the beginning of the data generation process to avoid cumulative misunderstandings and errors in subsequent research and policy. Getting this right at the start would avoid the need for future research on the sources of induced instability in functions resulting from internal inconsistencies between data generation and modeling methodology. The currently fashionable view that money should be ignored, since central bank measures are so poor, is likely to produce serious long-term costs to the profession and to economies throughout the world.
The Center for Financial Stability (CFS) provides Divisia monetary aggregates data for the United States. This site incorporates the most recent advances of the Barnett critique and supplies the results without charge to the public. The Divisia data without credit-card augmentation normalize levels to equal 100 in January 1967, while the credit-card augmented Divisia monetary aggregates and credit-card augmented Divisia inside money aggregates normalize levels to equal 100 in July 2006. The CFS supplies its Divisia monetary aggregates at eight levels of aggregation, DM1, DMZM, DM2M, DM2, DALL, DM3, DM4-, and DM4. Moreover, CFS produces broad money aggregates such as Divisia M3 and Divisia M4, while the Federal Reserve no longer provides the broad aggregates, M3 and M4, since the Federal Reserve has recognized that adding distant substitutes for money to transaction balances involves seriously defective weighting of the component monetary services.
The transfer of investment motivated funds into MMDA accounts in banks (and less importantly super-NOW accounts) caused the simple sum aggregates to surge, since deposits entered into the newly permitted accounts were being added into the simple-sum monetary aggregates without weights. But the new deposits were largely motivated by their interest rate yields, as opposed to currency and demand deposits, which did not yield interest and were being held for their monetary services in transactions. However, since the new deposit types were yielding very high-interest rates, their user cost prices, reflecting the opportunity cost from foregone interest, were very low. Divisia monetary aggregates remove the investment motive. Those new monetary innovations, priced at their low user cost prices, smoothly integrated into the Divisia monetary aggregates without creating a spike. The excessive weighting of MMDAs (and super-NOWs) in the simple sum monetary aggregates was the reason that the simple sum and Divisia growth rates at the time of the innovation were so drastically different.
References
- Chrystal, A.K.; MacDonald, R. Empirical Evidence on the Recent Behaviour and Usefulness of Simple-Sum and Weighted Measures of the Money Stock. St. Louis Fed. Reserve Bank Rev. 1994, 76, 73–109.Chrystal, A.K.; MacDonald, R. Empirical Evidence on the Recent Behaviour and Usefulness of Simple-Sum and Weighted Measures of the Money Stock. St. Louis Fed. Reserve Bank Rev. 1994, 76, 73–109.
- Anderson, L.C.; Jordan, J.L. Monetary and Fiscal Actions: A Test of Their Relative Importance in Economic Stabilization. St. Louis Fed. Reserve Bank Rev. 1968, 50, 11–23.Anderson, L.C.; Jordan, J.L. Monetary and Fiscal Actions: A Test of Their Relative Importance in Economic Stabilization. St. Louis Fed. Reserve Bank Rev. 1968, 50, 11–23.
- Barnett, W.A. Economic Monetary Aggregates: An Application of Aggregation and Index Number Theory. J. Econom. 1980, 14, 11–48.Barnett, W.A. Economic Monetary Aggregates: An Application of Aggregation and Index Number Theory. J. Econom. 1980, 14, 11–48.
- Belongia, M.T.; Ireland, P.N. The Barnett Critique after Three Decades: A New Keynesian Analysis. J. Econom. 2014, 183, 5–21.Belongia, M.T.; Ireland, P.N. The Barnett Critique after Three Decades: A New Keynesian Analysis. J. Econom. 2014, 183, 5–21.
- Barnett, W.A.; Serletis, A. The Theory of Monetary Aggregation; North Holland: Amsterdam, The Netherlands, 2000.Barnett, W.A.; Serletis, A. The Theory of Monetary Aggregation; North Holland: Amsterdam, The Netherlands, 2000.
- Barnett, W.A.; Chauvet, M. Financial Aggregation and Index Number Theory; World Scientific: Singapore, 2011.Barnett, W.A.; Chauvet, M. Financial Aggregation and Index Number Theory; World Scientific: Singapore, 2011.
- Barnett, W.A. Getting It Wrong: How Faulty Monetary Statistics Undermine the Fed, the Financial System, and the Economy; MIT Press: Cambridge, MA, USA, 2012.Barnett, W.A. Getting It Wrong: How Faulty Monetary Statistics Undermine the Fed, the Financial System, and the Economy; MIT Press: Cambridge, MA, USA, 2012.
- Barnett, W.A. Which Road Leads to Stable Money Demand? Econ. J. 1997, 107, 1171–1185.
- Barnett, W.A. Recent Monetary Policy and the Divisia Monetary Aggregates. Am. Stat. 1984, 38, 162–172.
- Divisia, F. L’indice monetaire et la theorie de la monnaie. Rev. d’Economie Polit. 1925, 39, 842–864.
- Tornqvist, L. The Bank of Finland’s Consumption Price Index. Bank Finl. Rev. 1936, 10, 1–8.
- Theil, H. Economics and Information Theory; North Holland: Amsterdam, The Netherlands, 1967.
- Barnett, W.A.; Su, L. Joint Aggregation over Money and Credit Card Services under Risk. Econ. Bull. 2016, 36, 2301–2310.
- Diewert, E. Exact and Superlative Index Numbers. J. Econom. 1976, 4, 115–145.
- Barnett, W.A. The User Cost of Money. Econ. Lett. 1978, 1, 145–149.
- Barnett, W.A.; Offenbacher, E.K.; Spindt, P.A. The New Divisia Monetary Aggregates. J. Political Econ. 1984, 92, 1049–1085.
- Barnett, W.A.; Su, L. Financial Firm Production of Inside Monetary and Credit Card Services: An Aggregation Theoretic Approach. Macroecon. Dyn. 2018, 24, 1–31.
- Keating, J.W.; Smith, A.L. The optimal monetary instrument and the (mis)use of causality tests. J. Financ. Stab. 2019, 42, 90–99.
- Drake, L.; Fleissig, A. A Note on the Policy Implications of Using Divisia Consumption and Monetary Aggregates. Macroecon. Dyn. 2008, 12, 132–149.
- Fisher, P.; Hudson, S.; Pradhan, M. Divisia Indices for Money: An Appraisal of Theory and Practice. 1993. Available online: https://www.bankofengland.co.uk/-/media/boe/files/working-paper/1993/divisia-indices-for-money-an-appraisal-of-theory-and-practice.pdf (accessed on 7 September 2021).
- Barnett, W.A.; Chauvet, M.; Leiva-Leon, D. Real-time Nowcasting of Nominal GDP with Structural Breaks. J. Econom. 2016, 191, 312–324.
- Shunk, D.L. The Relative Forecasting Performance of the Divisia and Simple Sum Monetary Aggregates. J. Money Credit Bank. 2001, 33, 272–283.
- Ellington, M. The Case for Divisia Monetary Statistics: A Bayesian Time-Varying Approach. J. Econ. Dyn. Control 2018, 96, 73–109.
- Liu, J.; Serletis, A. Credit Cards, the Demand for Money, and Monetary Aggregation. Macroecon. Dyn. 2021, in press.
More