The purpose of this article is to provide a review of the impact of the COVID-19 on Australian household finances and understand how the pandemic had significant repercussions for household finances and their behaviour towards saving and spending goals. Based on a national survey conducted by Australian Bureau of Statistics in December 2020, during COVID-19,we report that financial shocks continued to hit low-income households and one parent family with dependent children the hardest. The lowest income households had to forfeit a week’s worth of income on a less expensive shock but then three times of weekly income to absorb a more expensive shock. The overall households also had a low rate in seeking financial information, counselling or advice from a professional. The findings will have implications for the policymakers and advisors who assist households in sustaining their finances and wellbeing.
1. Introduction
Financial shocks affect many households at one stage or another
., but do we understand financial shocks? How did financial shocks affect Australian households during the period of COVID-19? How did they cope, and how can Australian households be equipped to become more financially resilient? There has been a resurgence in interest in exploring the ways to build households’ financial resilience to absorb financial shocks
[1].
Here, we provide a brief review of the impact of the COVID-19 pandemic on Australian household finances, and our observations and insights from analysing household financial shocks and the level of financial resilience are expected to yield useful implications for policymakers.Household financial shocks can result from either decreases in income, such as from job loss or a reduction in hours of work, or increases in expenses from emergencies such as illness or injury of family or damage to household possessions in a natural disaster. Pew Charitable Trusts defines these events as financial shocks
[2]. A household financial shock is often unexpected and costs a family between AUD 1500 and AUD 2000
[3][4]. Statistics show that 60 percent of U.S. households have experienced some sort of financial shock in the past 12 months
[2]. Low- and moderate-income households are more vulnerable to financial shocks
[5][6] and have lower emergency savings to buffer against shocks
[3].
Differing from a financial shock, financial stress is the hardships and difficulties that a household may have in meeting basic needs due to a shortage of money
[7]. Financial stress is also viewed as “financial reasons for being unable to have a holiday, to have meals with family and friends, to engage in hobbies and other leisure activities, and general money management”
[8]. Material financial hardships and difficulties often have an immediate effect on households’ consumption and their ability to cover the cost of basic needs. Likewise, households may find difficulty in covering the costs of food, clothing, utilities, transport and other essential consumables. The households with a high level of financial stress are more vulnerable, and they are particularly exposed to an adverse shock. Financial shocks can also lead to households’ financial stress and vulnerability. Aboagye and Jung
[9] and Comerton-Forde et al.
[10] documented that financial shocks are negatively associated with material hardships; in a more specific form, financial shocks are associated with increased rates of skipping essential bills
[11] and medical care
[12], as well as increased food insecurity
[13].
An immediate consequence of financial shocks is the decline in financial well-being. The CFPB’s study compares the U.S. households with and without a financial shock, and the results show that the financial well-being score of households that experienced a financial shock in the past 12 months is significantly lower than households that did not experience a shock
[14]. Roll et al.
[15] find that financial shocks in the form of income shocks are particularly stronger than expense shocks, and these financial shocks are associated with a significantly lower level of financial well-being. Aboagye and Jung
[9] and Comerton-Forde et al.
[10] reported a similar finding that financial shocks are negatively associated with financial well-being. Financial shocks and financial stress not only threaten an individual’s well-being, but they may also trigger physiological stress, which diminishes a variety of household outcomes
[16][17][18]. Ianole-Calin et al.
[19] suggest that financial well-being can be extended to two other dimensions, financial anxiety and financial security, as emotions, feelings and a sense of control are essential components of financial well-being. Using an online sample of 1602 participants in Romania, Ianole-Calin et al.
[19] find that financial anxiety and financial security along with financial education have been neglected by the financial services sector, and they argue that to improve the financial well-being in Romania, the financial services sector should focus on diminishing financial anxiety and increasing financial security.
2. The Scope of Financial Shocks among Australian Households
The analysis is based on data from the Australian Bureau of Statistics (ABS), a nationally representative survey of more than 9700 households in December 2020
[20]. Participants were asked about financial shocks that occurred in the 12 months before the survey. Due to COVID-19 restrictions, there was no face-to-face interviewing, and the households completed the survey online. Initially, selected households received a letter in the mail with instructions for completing the survey online. If households were unable to complete the survey online, they had an option to complete the survey by telephone. For each household, one adult (aged 18 years and above) acted as the representative and answered the questions. The survey questions cover a household’s financial situation, such as income, wealth, rent, rates, loan payments as well as information about education and employment status. The detailed questionnaire is available to access on the ABS website.
In the ABS national survey, an unexpected expense is estimated at two different levels: (1) unable to raise AUD 2000 in a week and (2) unable to raise AUD 500 in a week, for something important or an emergency.
We use these two levels of measure as proxies for financial shocks that cost Australian households between AUD 500 and AUD 2000.
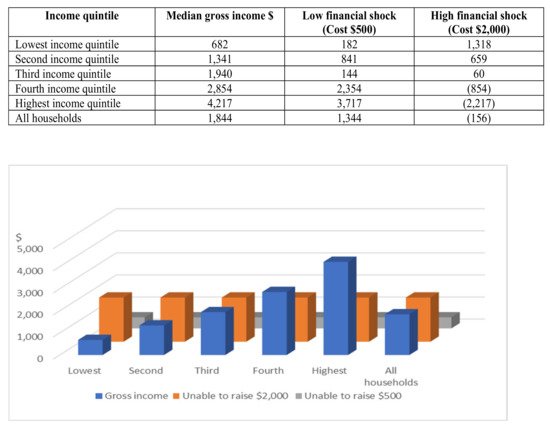
In December 2020, many Australian households had experienced some sort of financial shock in the past 12 months.
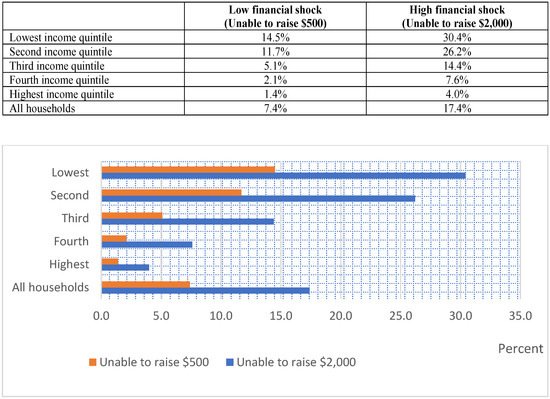
Figure 1 shows that 17 percent of households were unable to raise AUD 2000 in a week and 7 percent of households were unable to raise AUD 500 in a week for an emergency. This indicates that one in six households in Australia had an expensive shock in the past 12 months. The proportion of households that experienced the shocks varied by income level. The highest proportions are evident from the lowest-income quintile households, where 30 percent, that is, one in three households, were unable to raise AUD 2000 in a week and 14 percent were unable to raise AUD 500 in a week; this is almost 7 times and 14 times, respectively, compared to the highest-income quintile households. The second-lowest-income households also suffered in raising money for an emergency.
Figure 1. Proportion of households in each income quintile by low and high financial shock.
In terms of family composition,
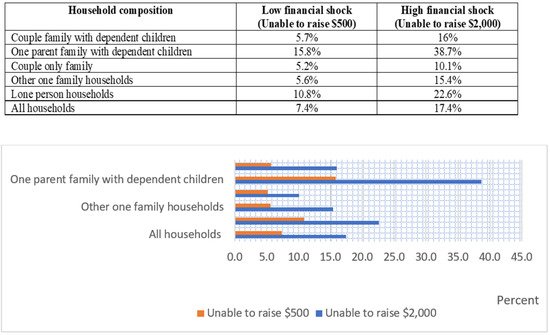
Figure 2 shows that 38 percent of one-parent families with dependent children (almost one in three households) had experienced the most expensive shock, followed by single-person households, couples with dependent children, other one-family households, and couples only. When comparing with average Australian households, a significantly higher proportion of one-parent families with dependent children had experienced financial shocks in the past 12 months.
Figure 2. Proportion of households for each family composition by low and high financial shock.
3. The Level of Financial Stress among Australian Households
Shocks also have adverse effects on household well-being. Many households have struggled to “make ends meet” after their most expensive financial shocks.
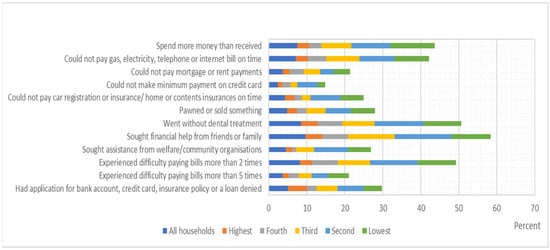
Figure 3 shows in December 2020, about 8.5 percent of Australian households could not afford dental treatment; 7.5 percent spent more money than received; 7.1 percent could not pay gas, electricity, telephone or internet bills on time; 4.3 percent could not pay car registration or home insurance on time; 3.6 percent could not pay mortgage or rent payments; and 2.4 percent could not make minimum payments on credit cards. Moreover, about 11 percent, or one in nine Australian households, experienced three or more types of financial stress.
Figure 3. Level of financial stress by income quintile.
To meet their basic needs, 9.7 percent of surveyed households sought financial help from friends or family, 4.8 percent sold or pawned something and 4.5 percent sought assistance from welfare and/or community organisations.
The financial stress level was particularly higher in the lowest-income households, that is, 11.7 percent spent more money than received, 10 percent went without dental treatment and 10.3 percent sought financial help from friends or family. In addition, 10 percent of lowest-income households experienced difficulty in paying bills more than two times.
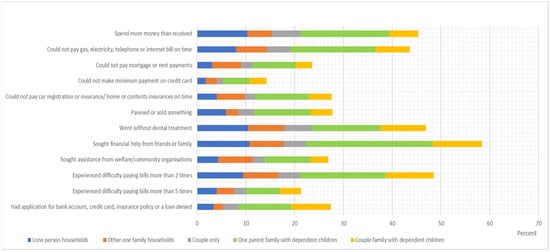
Figure 4 suggests that the financial stress level was also higher among one-parent families with dependent children and single-person households: 18 percent of one-parent families with dependent children spent more money than received; 17 percent could not pay gas, electricity, telephone or internet bills on time; 14 percent went without dental treatment; 11 percent could not pay car registration or home insurance on time; 8 percent could not pay mortgage or rent payments; and 5 percent could not make minimum payments on credit cards.
Figure 4. Level of financial stress by family types.
To meet their basic needs, 26 percent of one-parent families with dependent children sought financial help from friends or family, 11 percent sold or pawned something and 9.5 percent sought assistance from welfare and/or community organisations. Moreover, 17 percent of one-parent families with dependent children experienced difficulty in paying bills more than two times, and 10 percent had applications for a bank account, credit card, insurance policy or loan denied. Overall, about 24 percent of one-parent families with dependent children experienced three or more types of stress, which means almost one in four one-parent families with dependent children suffered to make ends meet.
4. How Did Australian Households Cope during the COVID-19 Pandemic?
The December 2020 survey reveals that the average household spent more than one week’s income on its most expensive shock, and low- and moderate-income households were more vulnerable to financial shocks; particularly, the households with the lowest income level spent three times their weekly income to absorb the most expensive shock.
Figure 5 shows that the median gross income for Australian households was AUD 1800 per week, which is slightly low to absorb a shock cost of AUD 2000. The lowest-income households had to forfeit a week’s worth of income on the least expensive shock of AUD 500, while in the event of the most expensive shock of AUD 2000, the lowest-income households had to use three times their weekly income to absorb the shock. For the highest-income households with a median gross income of AUD 4200 per week, they spent about half a week’s income on the most expensive shock.
Figure 5. Household weekly gross income for each income quintile by low and high financial shock.
To cope with financial shocks and hardships, households need access to sufficient liquid assets, emergence funds and savings, or be able to borrow. Australian households navigated against financial shocks particularly by drawing on savings; borrowing from banks, family or friends; or having arrears on debt repayments or household bills.
In December 2020, 9.6 percent of households had to draw on their savings or term deposits; 4 percent took out a personal loan or entered into a loan agreement with friends or family; 3.8 percent reduced home loan payments; and 3.1 percent increased the balance owed on credit cards by AUD 1000 or more. These were the dissaving actions taken in the past 12 months. Furthermore, 6.7 percent of households sold their assets. Surprisingly, the dissaving actions were not mostly undertaken by lowest-income households; in fact, there were more households from the second and third income quintiles.
This is not difficult to understand, as low-income households tend to have less savings that could be drawn upon in handling a shock.
5. The Level of Financial Resilience among Australian Households
TWe assessed the financially resilient actions
are assessed taken by Australian households in December 2020 and
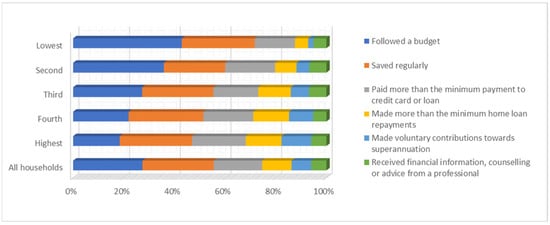
Figure 6 shows that in the past 12 months, nearly 48 percent of the overall households were able to follow a budget; 49 percent saved regularly (almost half of the households); 33 percent paid more than the minimum payment required by credit card companies or loan providers; 20 percent made more than the minimum home loan repayment; 13 percent made voluntary contributions toward superannuation; and 10 percent received financial information, counselling or advice from a professional.
Figure 6. Level of financial resilience by income quintile.
The lowest-income households performed well in following a budget (almost one in two lowest-income households). However, there is a significant gap in regular savings: only 32 percent of lowest-income households saved regularly compared to 72 percent of highest-income households. A similar observation was made for other resilient actions, such as paying more than the minimum payment required by a credit card company or loan provider, paying more than the minimum home loan repayment and making voluntary contributions toward superannuation.
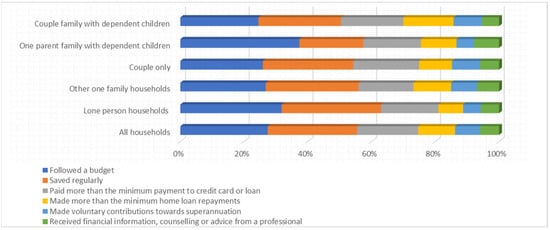
Figure 7 reveals the level of financial resilience by family type. Most couples with dependent children, one-parent families with dependent children, couples only, other one-family households and single-person households were able to follow a budget. However, one-parent families with dependent children were among the lowest (28 percent) in terms of saving regularly, paying more than the minimum payment required by a credit card company or loan provider (25 percent) and making voluntary contributions toward superannuation (7 percent).
Figure 7. Level of financial resilience by family type.
Among all financial resilience actions taken in the past 12 months, the overall households tended to have a lower rate (10 percent) of seeking financial information, counselling or advice from a professional. Only 5.9 percent of the lowest-income households received financial information, counselling or advise from a professional, but even for the highest-income households, the proportion was not high (15 percent). Among different families, 8 percent of single-person households received financial information, counselling or advice from a professional, which is the lowest.