The vegetation optical depth (VOD) parameterizes the extinction (attenuation & scattering) effects due to the vegetation affecting the microwave radiations propagating through the vegetation canopy. It is retrieved from both passive and active microwave remotely sensed observations. It is related almost linearly tto the vegetation water content and indirectly to vegetation water status and t high frequency and to the biomass. It has been retrieved from several satellites operating at different frequencies and at low frequency. It provides a long-term record of the vegetation dynamics over land surfaces since 1978. VOD is complementary to classically used vegetation indices derived from multi-spectral images but it is and less affected by sun illumination andthan them by the presence of water in the atmospheric effects than optical vegetation indicese.
- vegetation optical depth (VOD)
- brightness temperature (TB)
- backscattering
- radiative transfer
- vegetation
- above ground biomass (AGB)
- vegetation water content (VWC)
Dear author, the following contents are excerpts from your papers. They are editable.
(Due to the lack of relevant professional knowledge, our editors cannot complete a complete entry by summarizing your paper, so if you are interested in this work. you may need to write some contents by yourself. A good entry will better present your ideas, research and results to other scholars. Readers will also be able to access your paper directly through entries.)
1. Introduction
Vegetation is a key element in the energy, water and carbon balances over the land surfaces and is strongly impacted by climate change and anthropogenic effects. Remotely sensed observations are commonly used for the monitoring of vegetation dynamics and its temporal changes from regional to global scales. Among the different indices derived from Earth observation satellites to study the vegetation, the vegetation optical depth (VOD), which is related to the intensity of extinction effects within the vegetation canopy layer in the microwave domain and which can be derived from both passive and active microwave observations, is increasingly used for monitoring a wide range of ecological vegetation variables. Based on different frequency bands used to derive VOD, from L- to Ka-bands, these variables include, among others, the vegetation water content/status and the above ground biomass for the top-layer canopy (at high frequencies) and the whole canopy (at lower frequencies as L-band).
2. VOD retrievals from active and passive microwave observations
VOD can be retrieved from both passive and active microwave data [1]. Radiometers measure the thermal radiation emitted by the Earth’s surface at a given frequency. It is given in terms of brightness temperature (TB) representing the temperature of an equivalent blackbody emitting the same radiation [2][61]. Emission of land surfaces (i.e., a rough soil covered with vegetation) in the microwave electromagnetic (EM) fieldomain can be simulated using a radiative transfer (RT) model [3][63]. The brightness temperature measured by the sensor onboard a satellite platform is the linear combination of effective temperatures Tsoil and Tveg of soil and vegetation, and the downwelling cold sky Tsky weighted by EM dependent emissivities. Experimental studies have revealed a good linear relationship between VOD and vegetation water content (VWC, kg/m2) over crops fields (VOD ~ b. VWC, where b is depending on vegetation type and structure, growth stage, water status, etc.) [4][5]. 2-Parameter retrievals of soil moisture and VOD from multi-angular L-band observations has been first demonstrated from in situ data sets [6][7]. Following studies based on the L-MEB model (L-band microwave emission of the biosphere)[7], were extended to simulated [8] and actual SMOS observations [9]. Multi-orbit and/or multi-angular retrievals of VOD, and SM or other vegetation or soil parameters (soil roughness, effective scattering albedo) have also been developed [8][10][25].
Radars measure the power of the electromagnetic wave (EM) backscattered by the Earth’s surface (Pr). The reflecting properties of the surface are expressed through the backscattering coefficient (σ0) which is function of the emitted and reflected powers (Pe and Pr respectively), the characteristics of the antenna and of the illuminated area. Numerous models were developed to simulate the radar backscattering of land surfaces in the active domain, VOD is one of the variable used to describe the effects of vegetation in the backscattering of a soil-land surface covered with vegetation media. The Water Cloud Model (WCM) expressed the total backscattering of the land surface as the sum of the direct backscattering of the vegetation, the backscattering of the soil twice attenuated by the vegetation cover and the multiple scattering from soil-vegetation interactions.
3. Advantages and Drawbacks of VOD
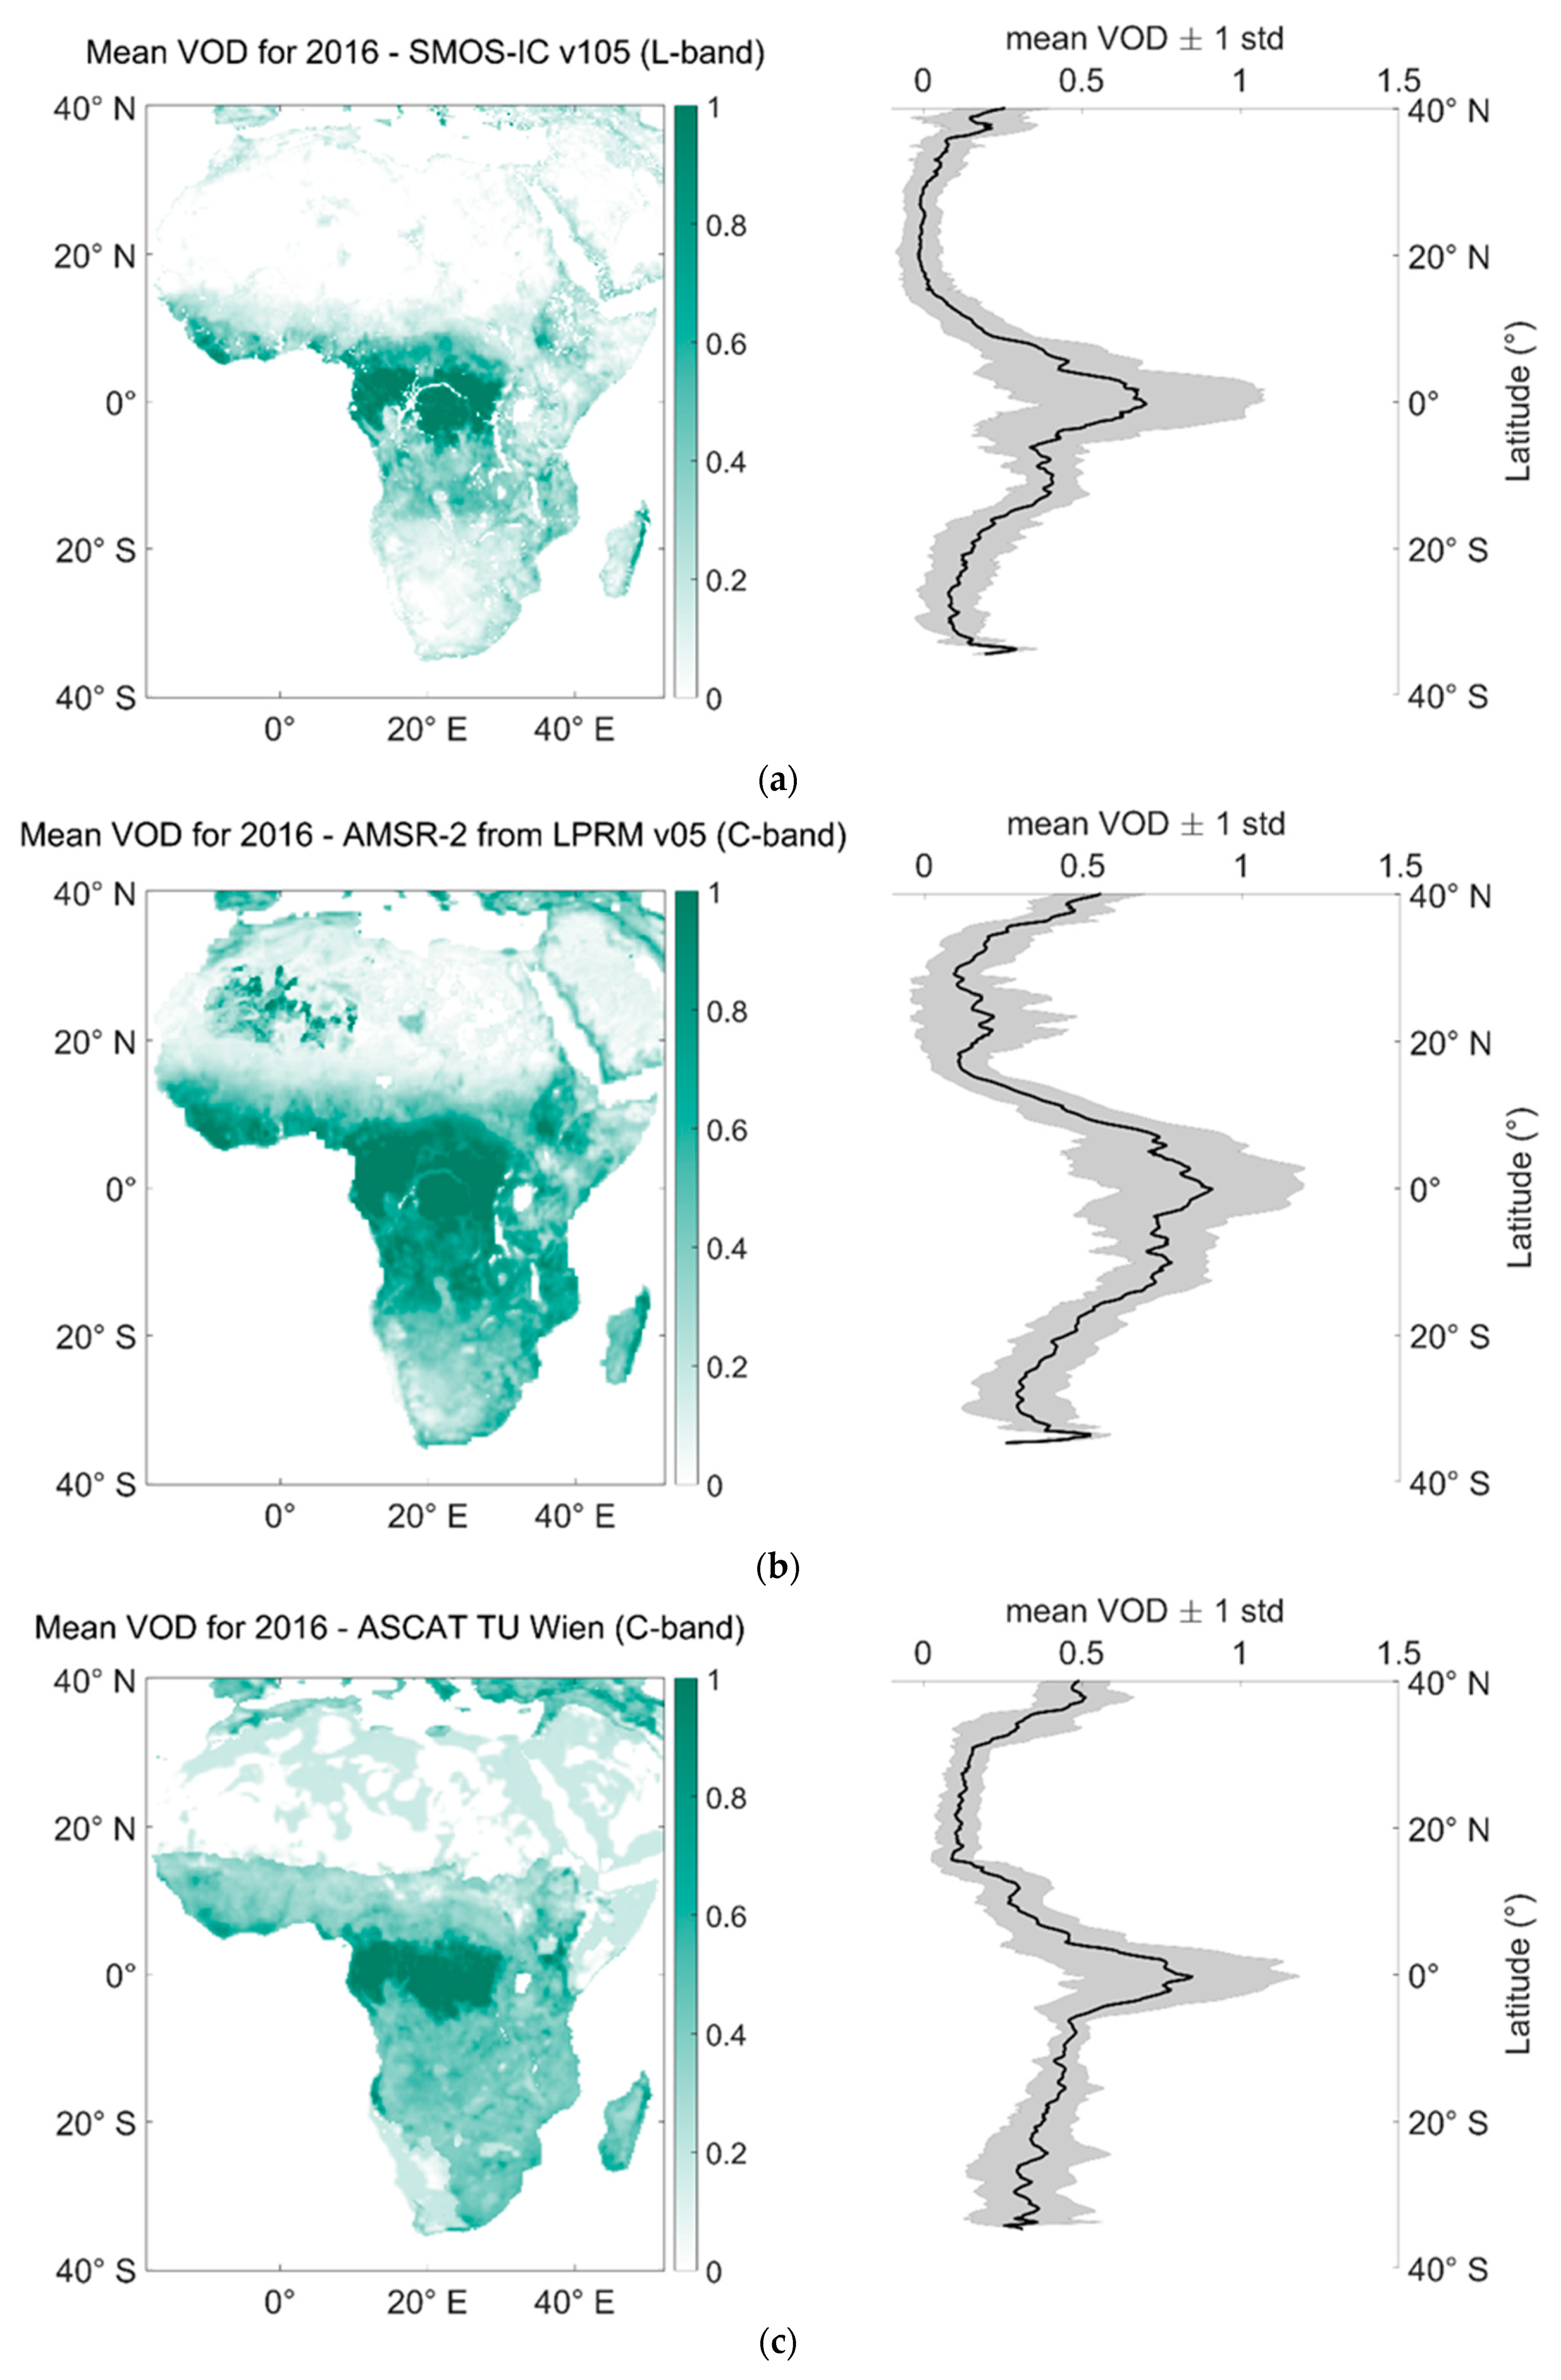
Compared to vegetation indices derived from reflectance acquired by sensors operating in the visible and the infra-red domains, VOD is not affected by the presence of clouds and less sensitive to the presence of water in the atmosphere. Thus, the different microwave sensors are likely to provide reliable information related to VWC on both the green and non-green vegetation components [11][155], at a quasi-daily temporal resolution, at different frequencies and over several decades [12][13][14][157,180,181]. VOD gives access to complementary information to NDVI or LAI on the vegetation dynamics. Ffor instance, [182]. sSignificant time-lags were observed between LAI and LPRM (AMSR-E) VOD in the Amazon rainforest [15]. It was observed that the growth of the biomass canopy and the phenological activity exhibit maximum time-lags in areas characterized by shorter dry seasons in the west of the basin. This time-lag progressively decreases along a west-to-east longitudinal wetness gradient as the length of the dry season increases indicating an adaptation of forest to water and light availability [16]. In the western pa recent study, a time-lagrt of the Amazon Basin, where the dry period is short, water is allocated to non-photosynthetical vegetation components as a priority when PAR is low (and water availability is maximum), causing an increase in VOD, whereas LAI and PAR exhibit quasi-synchronous temporal variations. In the eastern part of the Amazon Basin, where the duration of three to sixe dry season is longer, LAI, and VOD are synchronous with the temporal variations of water availability [183]. In a recent study, a time-lag of three months between LAI and L-VOD from SMOS-IC L-VOD was determined in the savannah/woodland region of Miombo, in southern Africa. The latter one exhibits a peak at the end of the rainy season and in beginning of the dry season that was attributed to tree growth during this period and was confirmed by in situ observations [17][184]. X-band VOD is strongly correlated to leaf water potential [18][154]. As VWC is related to leaf water potential (ΨL), the differences between VOD estimates at mid—day and midnight was used to derive an isohydricity parameter at ecosystem-scale [19][185]. As isohydricity is an indicator of the stomatal and xylem flow regulation, which is an important factor in drought-induced reduction of the biomass and plant mortality that cannot be derived from land cover type, VOD is a good candidate for analyzing the spatio-temporal responses of vegetation to water stress. VOD presents saturation for higher biomass values than NDVI, the saturation occurring for lower biomass values as the frequency increases [20][134]. L-band VOD from SMOS VODLevel 2 was reported to reach saturation for biomass around 40350 Mg ha−1 in equatorial forests of South America and Africa [21][22][186]. In spite of differences in spatio-temporal patterns between VODs derived from different sensor types, and at various frequencies and, for different inversion approaches (see for instance Figure 1), very few inter-comparison studies have been achieved yet. A first study based on one year (2003) of AMSR-E TB acquired at C- (6.925 GHz), X- (10.65 GHz), and K -(18.7 GHz) bands showed a greater sensitivity of microwave data acquired at higher frequencies to the photosynthetically active component of vegetation (crown and leaves), whereas, TB acquired at lower frequencies are more sensitive to the woody component of the vegetation [155]. These results were confirmed when comparing L- (SMAP MT-DCA data), X- and C- (AMSR-2 LPRM version 5 data) bands VOD to AGB over tropical forests [23][135]. Comparisons between different L-band VOD from SMOS (i.e., SMOS Level 2, SMOS Level 3 and SMOS-IC v105) and three different AGB datasets, as well as three height NDVI and EVI also exhibited very good agreement between the different parameters. Among the L-VOD products, SMOS-IC v105 obtained the higher correlations and lower dispersion against all the evaluated VOD datasets [24][144].
A large intercomparison was recently made and highlighted the large complementarity between VODs from different sensors and at different frequencies for monitoring vegetation [25]. High frequency VODs are better correlated to optical indices (in time and space) and low frequency VODs are better correlated to biomass; but this general rule has many exceptions depending on sensors and products
The major drawbacks of the current VOD products from radiometers and scatterometers are their sensitivity to RFI, the loss of accuracy in presence of water bodies in the sensor footprint, and their coarse spatial resolutions. Concerning the important issue of the RFI, preprocessing approaches are increasingly improving to filter out the data impacted by these perturbations. For example, in the version 2 of the SMOS-IC data, available at [26][103], a special attention was devoted to the prefiltering step allowing to improve the quality of the VOD retrievals compared to v105 [25][187]. To tackle with the loss of accuracy of VOD in presence of open water, the solution currently used is to filter out pixels containing a percentage of water higher than a threshold. Corrections are difficult as they would require very accurate and Near Real Time (NRT) maps of the water bodies. But inundation fractions are retrieved from SSM/I [27][28] [188,189] and SMOS [29] [190,191] for instance. A possible solution would be to retrieve simultaneously the surface water fraction, SM and VOD combining information from several frequencies, and/or polarizations. Improvement in the VOD spatial resolution already started with the availability of Level 1c SMAP TB at a spatial resolution of 9 km instead of 36 km owing to the use of a Backus-Gilbert approach [30][110]. But no similar product has been yet developed for SMOS. A promising technique, based on the combination of successive acquisitions and the application of constraints based on the expected climatology-based range of variations of the inverted parameters, and the Sobolev-norm regularization, was recently applied on TB from SMAP over the Contiguous United States (CONUS). This approach, denominated “combined constrained multi-channel algorithm” (C-CMCA), allowed simultaneous retrievals of SM and VOD at spatial resolutions from 1 to 5 km decreasing the RMSE values on VOD estimates by 81% and 7% respectively compared with non-constrained and single source techniques, respectively [31][192]. Other techniques were also implemented to other space-borne observations. Using pan-sharpening technique on TB acquired by AMSR-E at Ka- (higher resolution) and C- (lower resolution) band, high resolution SM and VOD were obtained from LPRM at the spatial resolution of 10 km instead of 25 km [32][193].
4. Conclusions
VOD retrieved from both passive and active microwave remotely sensed observations has been providing a long-term record of the vegetation dynamics over land surfaces since 1978. It has been shown, in many studies that VOD offers complementary information to the commonly used vegetation indices derived from multi-spectral images as NDVI, LAI or fPAR and presents several advantages compared to these indices. It is much less affected by the presence of water in the atmosphere and is a proxy of the vegetation water content and indirectly of/ the biomass of the whole the canopy even layer in the tropical forests (at low frequencies as at L-band). The various frequencies available and the different sensing modes of the space-borne sensors give access to a wide range of vegetation variables as essential as the water status of the top-canopy layer at higher frequencies and the biomass at lower frequencies. Yet, the synergy between observations acquired for different frequencies and sensing modes (active and passive) need to be explored further to better understand the functioning of the vegetation in a context of both climate change and increased anthropogenic pressure on the vegetation ecosystems. The launch of satellite missions such as CIMR and Biomass in the years to come will ensure the continuity in the monitoring of land surfaces using passive microwave sensors and offer new information based on the use of multi-frequency bands (for CIMR) of low frequency P-band (for Biomass), respectively.