Your browser does not fully support modern features. Please upgrade for a smoother experience.
Please note this is a comparison between Version 2 by Conner Chen and Version 3 by Conner Chen.
Maximum Power Point Tracking (MPPT), or sometimes just Power Point Tracking (PPT), is a technique used with variable power supplies to maximize energy extraction as conditions change.
- impedance matching
- maximum power point tracking (MPPT)
- DC-DC converter
- solar PV (SPV) systems
1. Introduction
In the following decade, energy demand has surged enormously worldwide. This resulted in an arduous challenge of gush in energy demand as a result of overall socio-economic growth [1]. Prominent among prevailing renewables, the photovoltaic cell (solar PV) is on the leading edge [2], but the efficiency of the solar PV structure is not adequate so as to boost the efficiency; it must be driven at a point where it can extort the utmost potential power from it. Current literature reveals that research exertions are being made to boost the output of modules in the context of MPPT. The characteristics of an SPV module are non-linear and its power vs. voltage characteristics indicate that there subsists a solitary point (Pm) at which the module delivers maximum power [3]. The point Pm deviates due to change in temperature and/or insolation [4][5]. Consequently, the mismatch between the source and load characteristics lessens the availability of the utmost potential accessible power transmitted to the load, leading to huge power losses. To minimize power loss, the MPPT algorithm ensures that the impedance of the source will be equal to or near to the load impedance which is done by the DC-DC converter. Classification and comparison of MPPT techniques are also available in the literature [6][7][8]. MPPT techniques in solar photovoltaic systems under uniform insolation [9][10][11] and partially shaded conditions [12][13][14] are also compared in the literature.
2. Operating Strategy of MPPT
The functioning of MPPT has explicated an example for tracking maximum power through the changes in insolation, as depicted in Figure 1a. Figure 1b depicts characteristics of a solar cell for a linear resistive-type load (RL = 10 Ω); it has three maximum power points (MPPs) which are A′, B′, and C′ on three different insolation level. Since the load is linear, the operating points of the cell and the respective terminal voltages are A, B, and C. It is apparent from Figure 1a,b that the power delivered via the solar cell concerning A, B, and C is less than the power available [15].
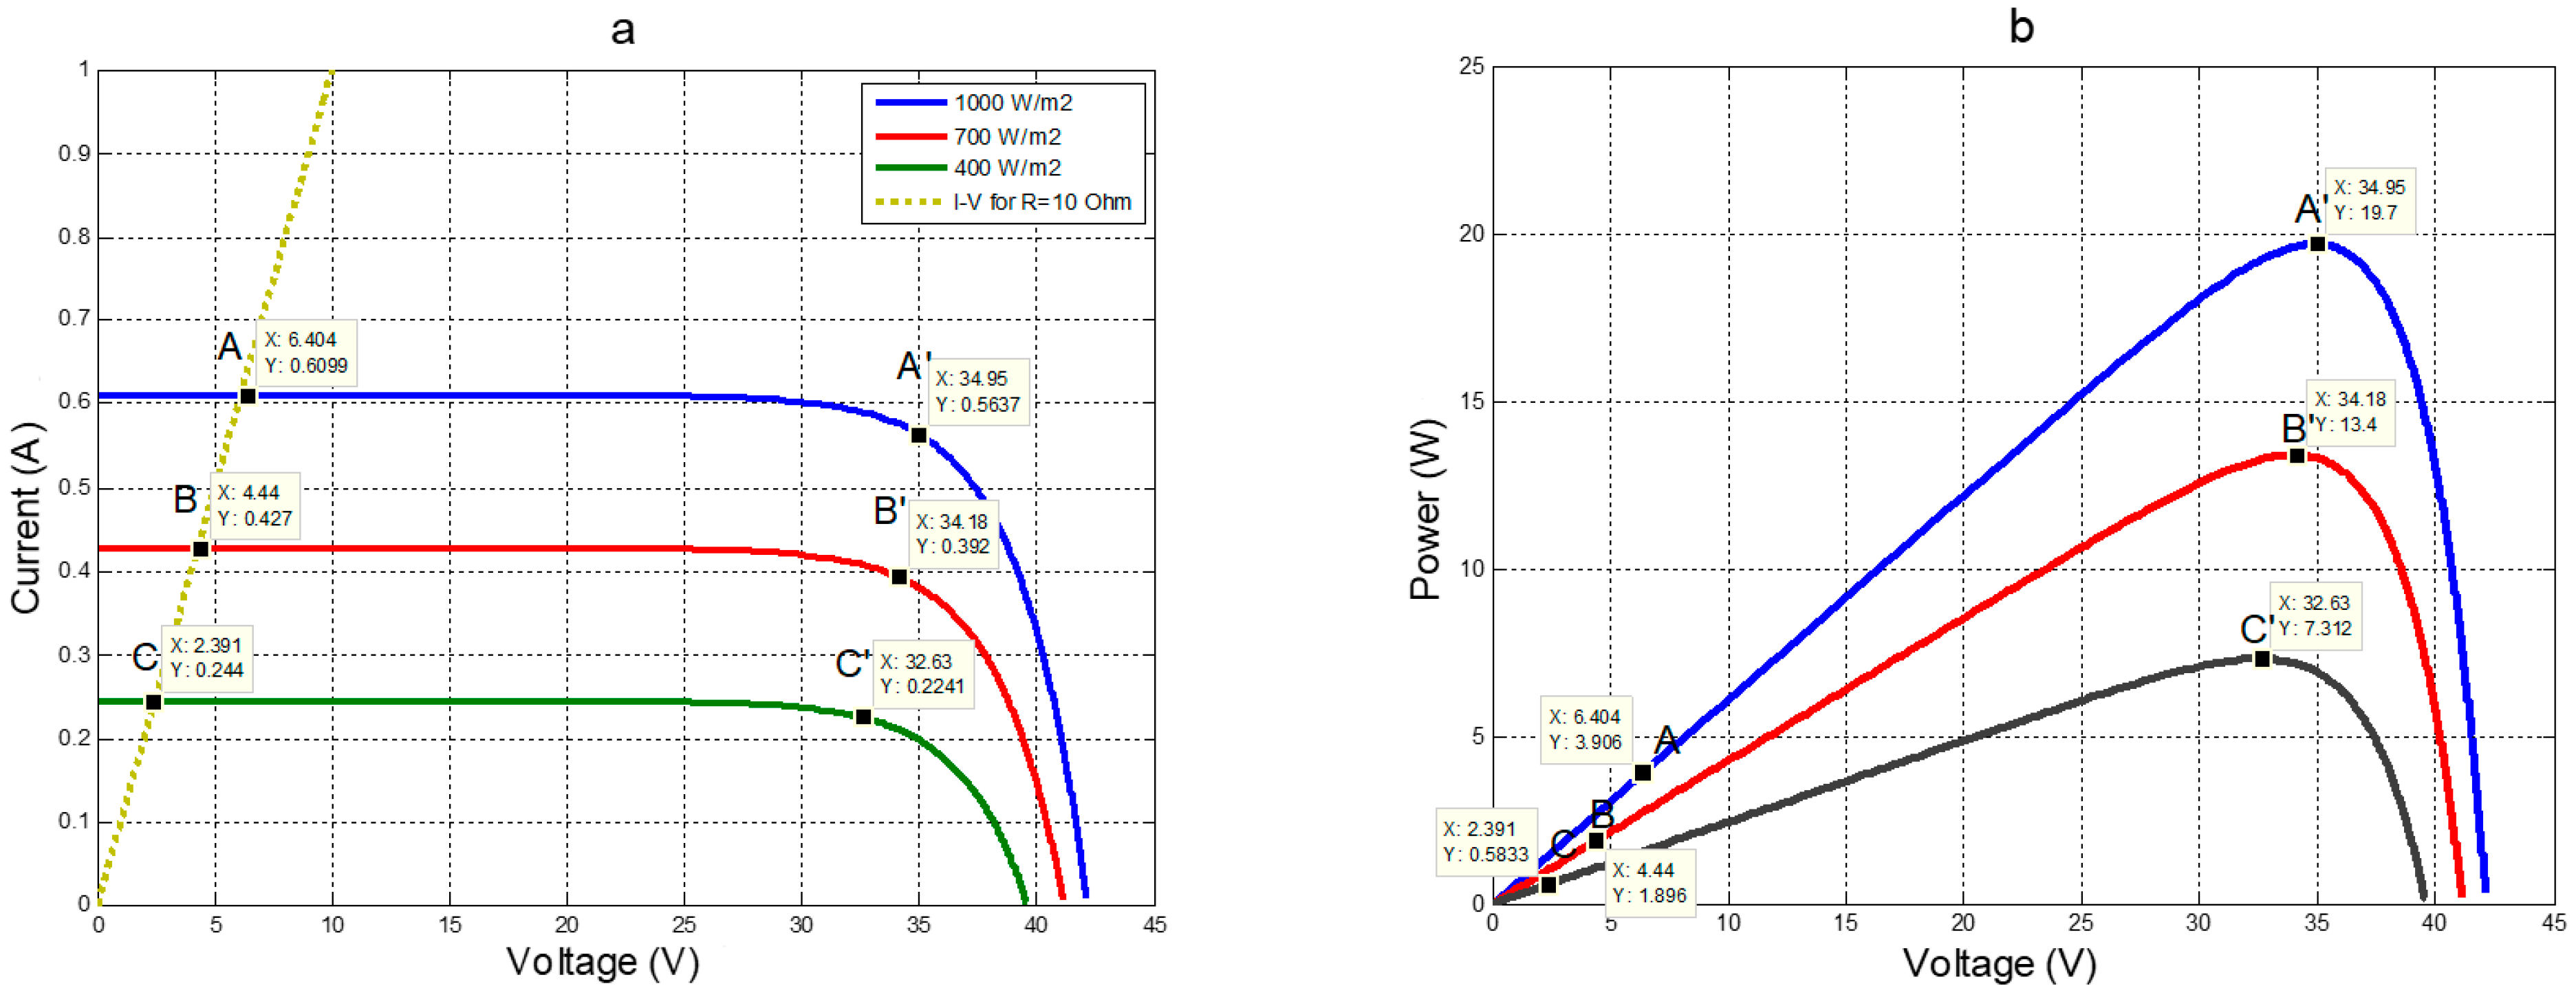
Figure 1. MPP for different insolation on (a) current vs. voltage curve and (b) power vs. voltage curve.
The MPPT functioning evokes the concept of seizing the terminal voltage corresponding to the MPPs which are A′, B′, and C′ in place of the operating points A, B, and C. To heave the operating point of the solar cell at the MPP, an electronic circuitry recognized as the DC-DC converter was utilized in MPPT [16][17][18].
3. Impedance Matching by DC-DC Converter in MPPT Operation
In the tracking of MPP, the DC-DC converter is a vital component as the source is capable of delivering the utmost power only corresponding to VMPP or IMPP. Although, in designing a DC-DC converter, it is quite problematic to move the terminal voltage (Vi) or current (Ii) of an SPV module in consequence to a VMPP or IMPP. Here demonstrates the MPPT algorithms based on various designs of the DC-DC converter [15] in which the impedance as perceived from a solar PV (Zsource) matches the analogous impedance at the MPP (Zmpp = Vmpp/Impp). Figure 2 depicts the block illustration of the general MPPT operation. A comparison of MPPT algorithms and the control of DC-DC converters is presented in [19][20][21][22].
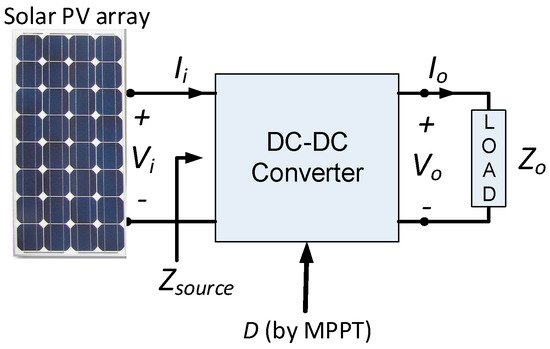
Figure 2. Block illustration of general MPPT operation.
To authenticate the response of the converters, simulations are accomplished in MATLAB’s SIMSCAPE library, which is closer to the practical design. The N-channel MOSFET is utilized for the switching function and it is directed through a voltage-controlled PWM generator. The general operation of MPPT is depicted in Figure 2, wherein the input constraints are sensed and processed by the MPPT controller, thus the duty cycle is set accordingly by the MPPT algorithm. The DC-DC converter works at this duty cycle to deliver the utmost power to the load. More than 31 MPPT techniques have been found in the literature and of these 31 techniques, the perturbation and observation (P&O) or hill climbing is well-liked, with the benefits of ease of realization and involving less complex circuitry.
4. P&O/Hill Climbing Technique of MPPT
The P&O technique is one of the well-liked MPPT techniques. The technique is fundamentally an iterative approach. In this technique, the operating point of the SPV module swings around the MPP. The power vs. voltage curve of a solar PV shows that the change in power in regards to voltage (dP/dV) is positive, negative, and zero for the province before the MPP, after the MPP, and at the MPP, respectively [23][24].
This technique is realized by perturbing the duty ratio at regular intervals and swinging around the point dP/dV = 0, i.e., MPP. This operation is explicated in Figure 3 and the methodology is given in Table 1.
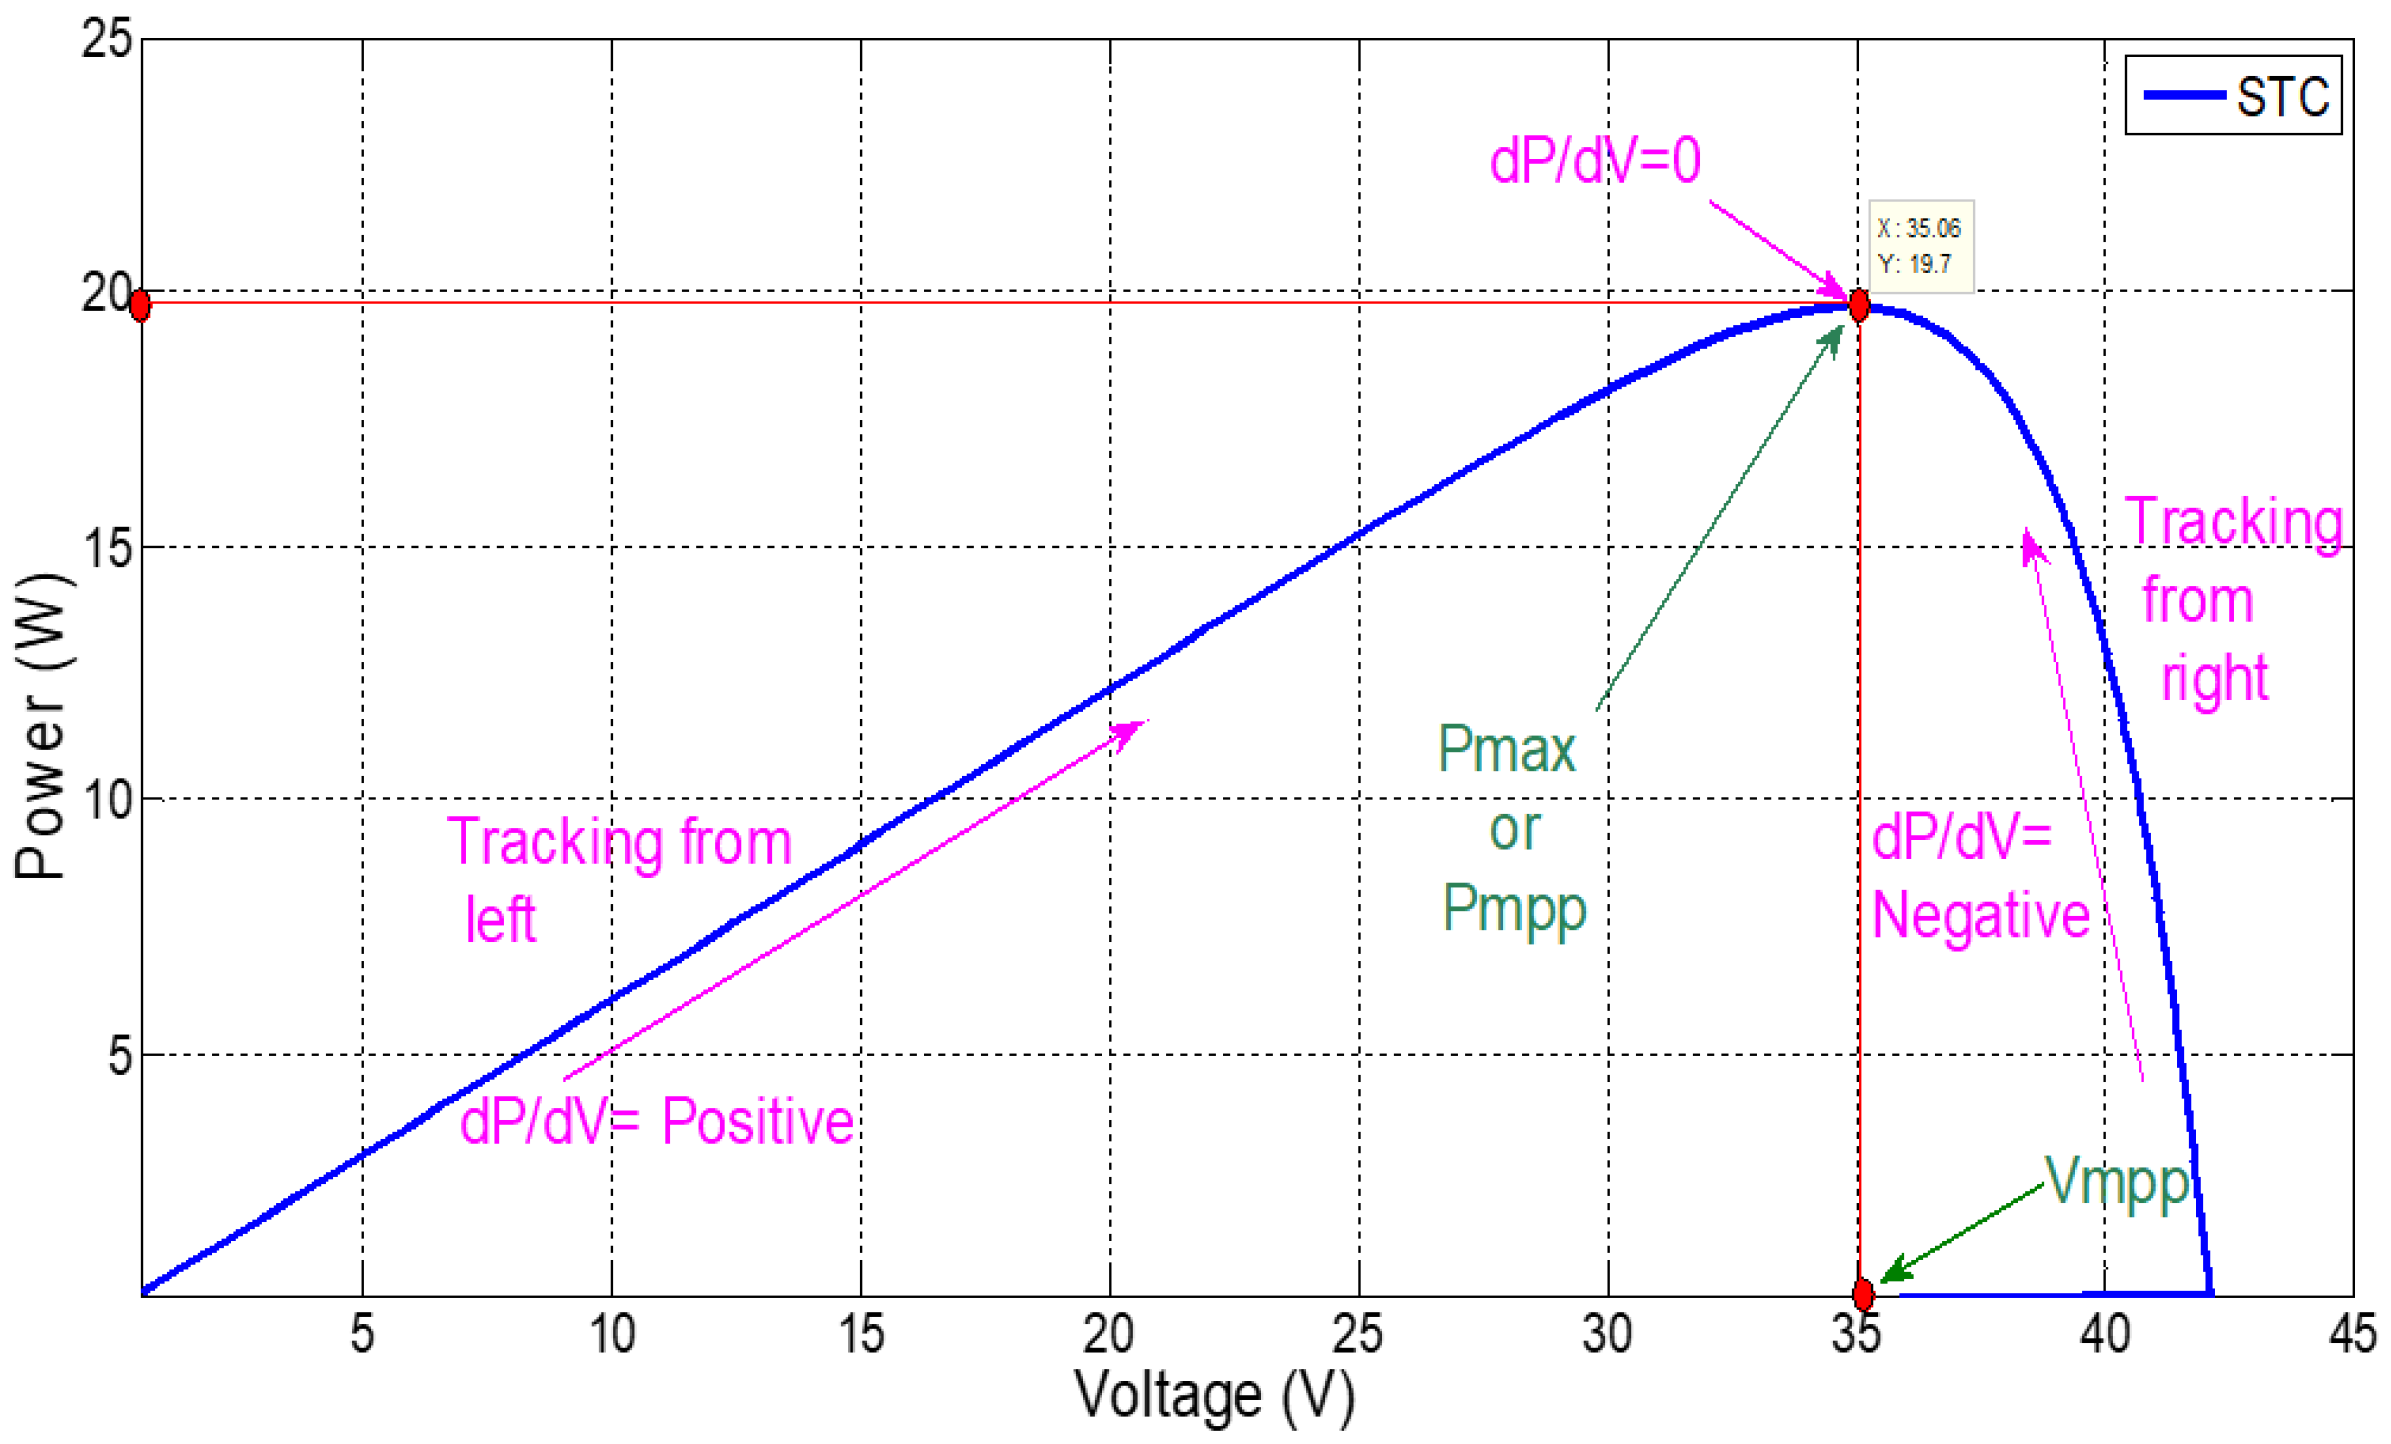
Figure 3. Power characteristic of SPV in perspective with P&O MPPT.
Table 1. Methodology of P&O technique [23].
| Perturbation | Change in Power | Next Perturbation |
|---|---|---|
| (+) Positive | (+) Positive | (+) Increment in duty ratio ‘D’ |
| (+) Positive | (−) Negative | (−) Decrease in duty ratio ‘D’ |
| (−) Negative | (+) Positive | (−) Decrease in duty ratio ‘D’ |
| (−) Negative | (−) Negative | (+) Increment in duty ratio ‘D’ |
5. Proposed MPPT Technique
The proposed MPPT technique is based on a modified converter design [15] as the DC-DC converters are playing a very important role in MPPT. The design of DC-DC converters is an essential part of any MPPT scheme [25][26]. Application of conventional DC-DC buck converters [27][28], boost converters [29][30][31], buck-boost converters [32][33][34], novel converters [35][36], and multilevel inverters [37][38] are also reported in the literature for MPPT operation.
The behavior of DC-DC converters is observed for variation in the duty cycle for the buck, boost, and buck-boost converters in here and is explained in the subsequent section.
5.1. Boost Converter: Relation between Output Voltage, Output Current, Output Power, and VPV
A graph of the output voltage, output current, output power, and VPV with variation in the duty cycle is presented in Figure 4. It shows that the point of maximum power occurs when the load voltage is at the maximum.
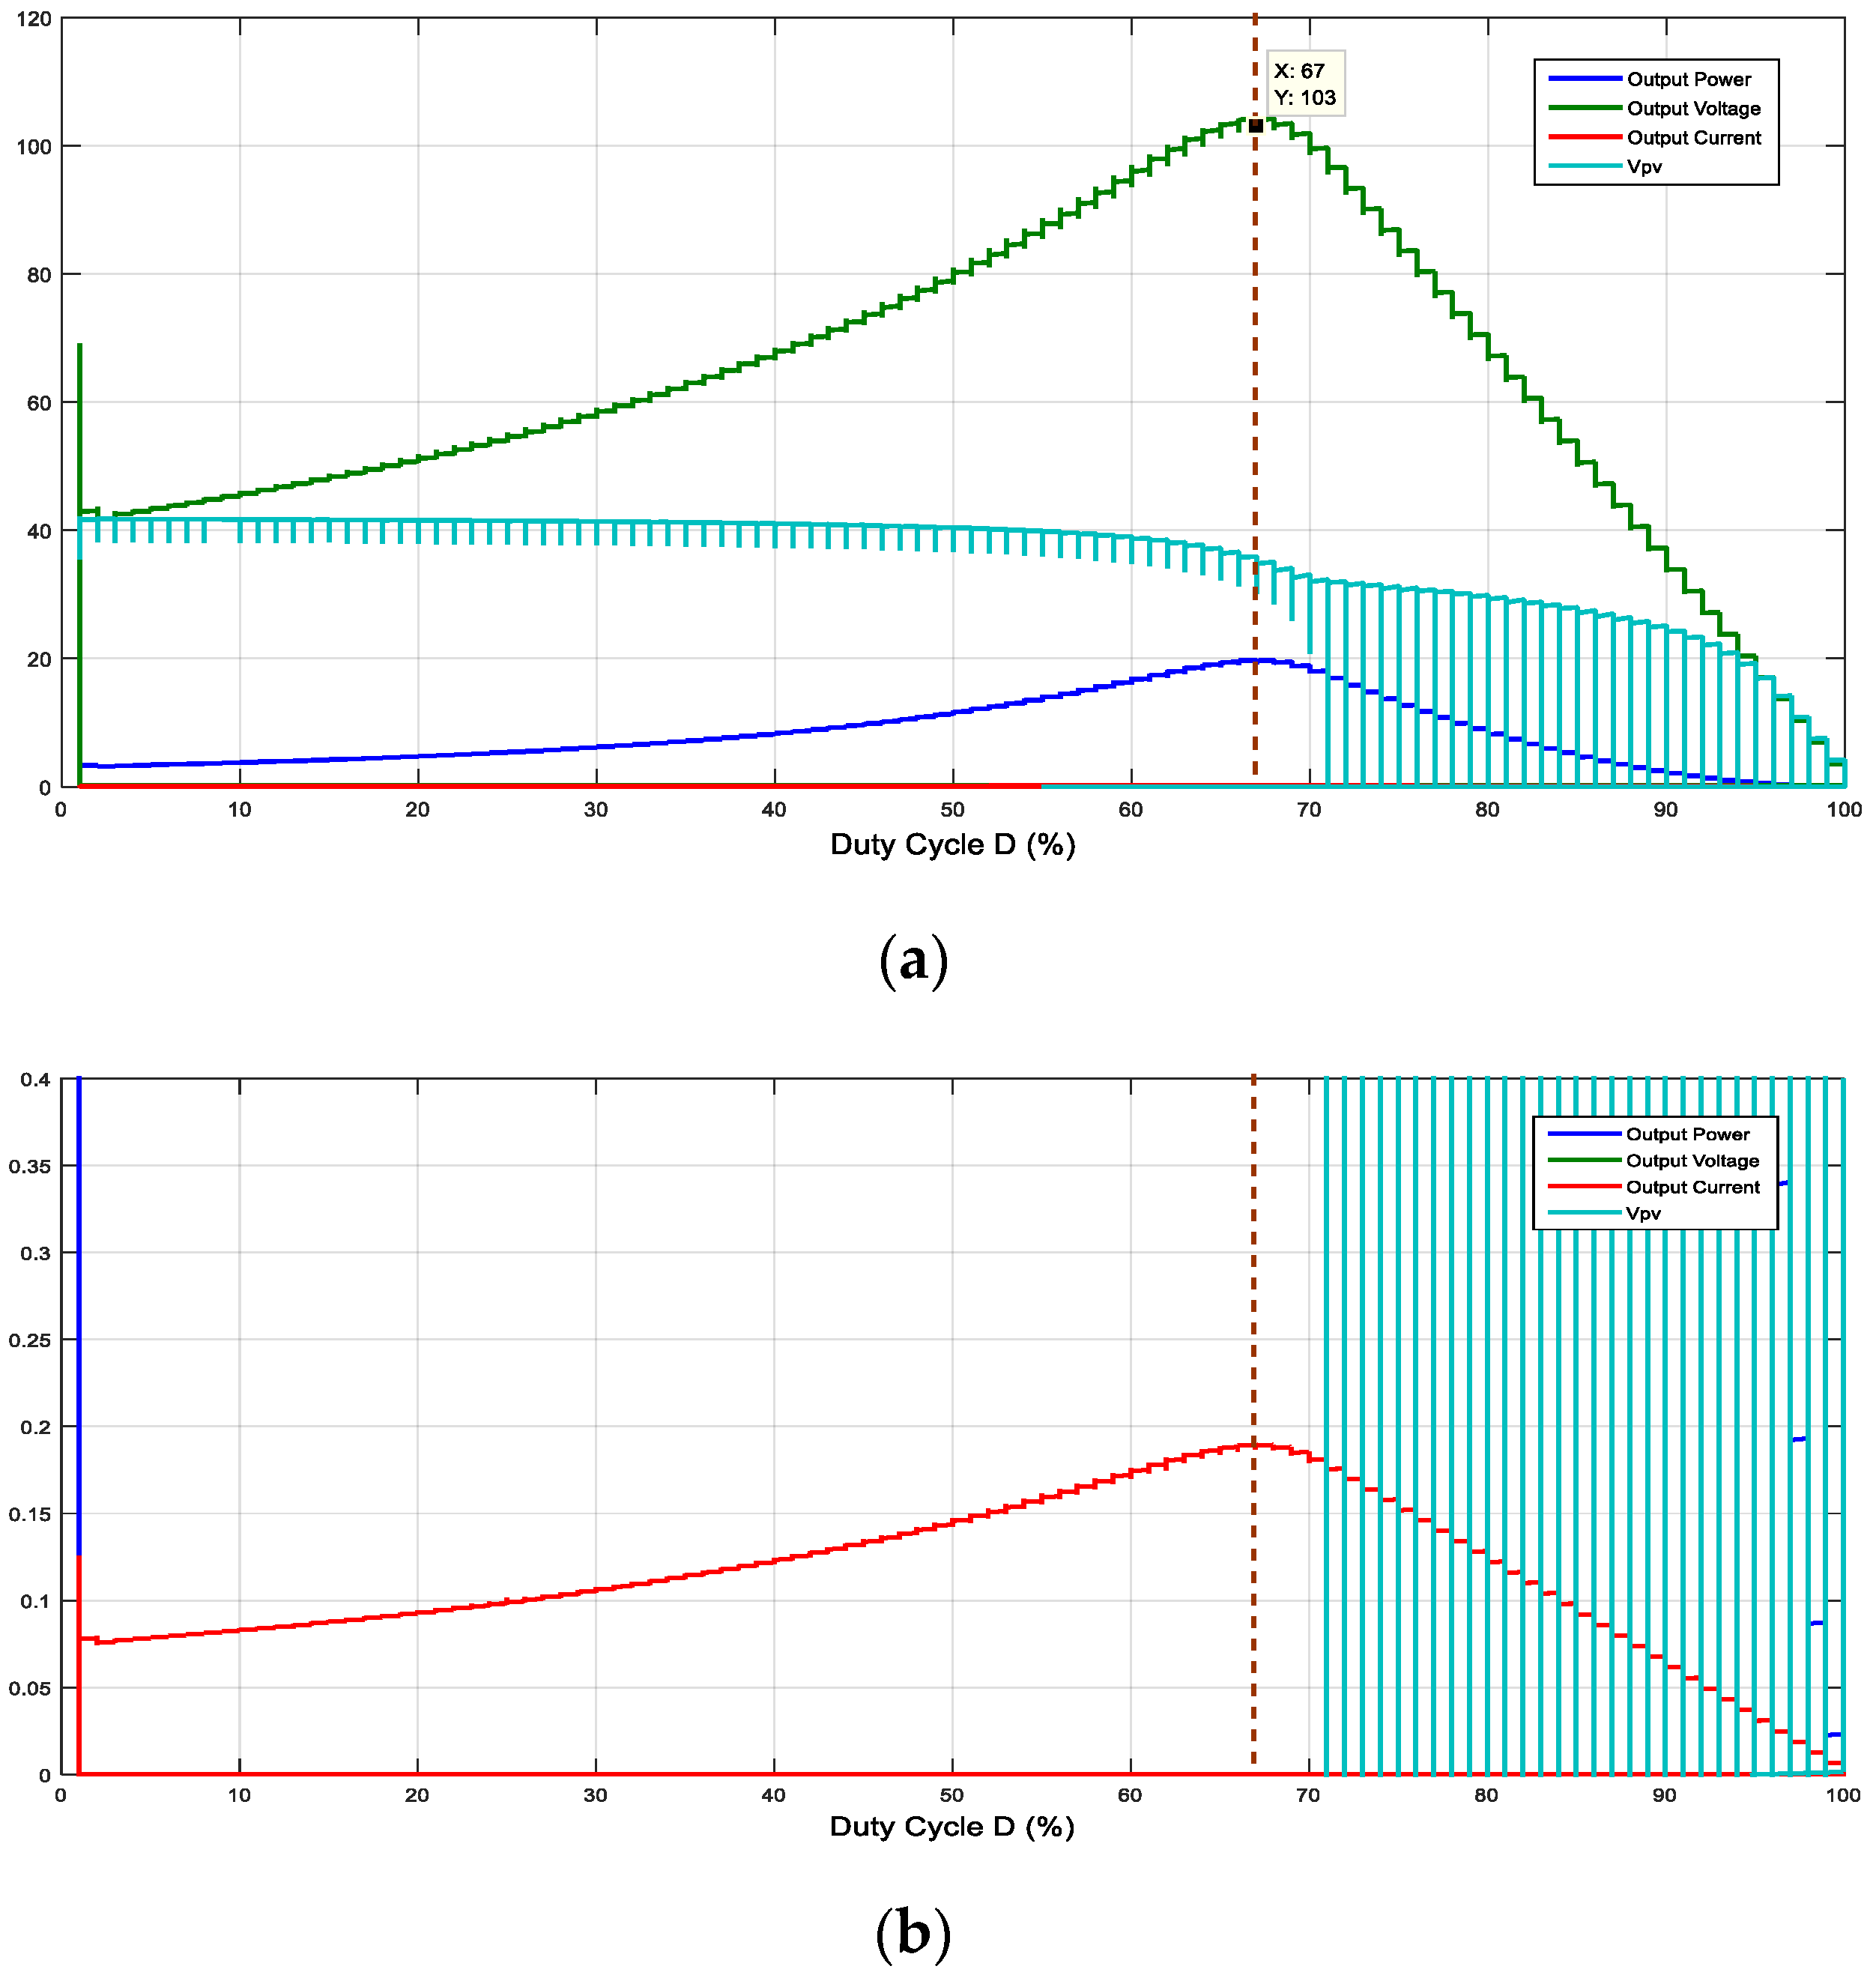
Figure 4. Boost converter: graph of output current, output power, and VPV with duty cycle.
The current is also at the maximum where the power is maximum ay D = 67%, which is not visible in Figure 4a; by zooming in at the Y-axis, it is clear in Figure 4b.
5.2. Buck Converter: Relation between Output Voltage, Output Current, Output Power, and VPV
A graph of the output voltage, output current, output power, and VPV with the duty cycle is presented in Figure 5.
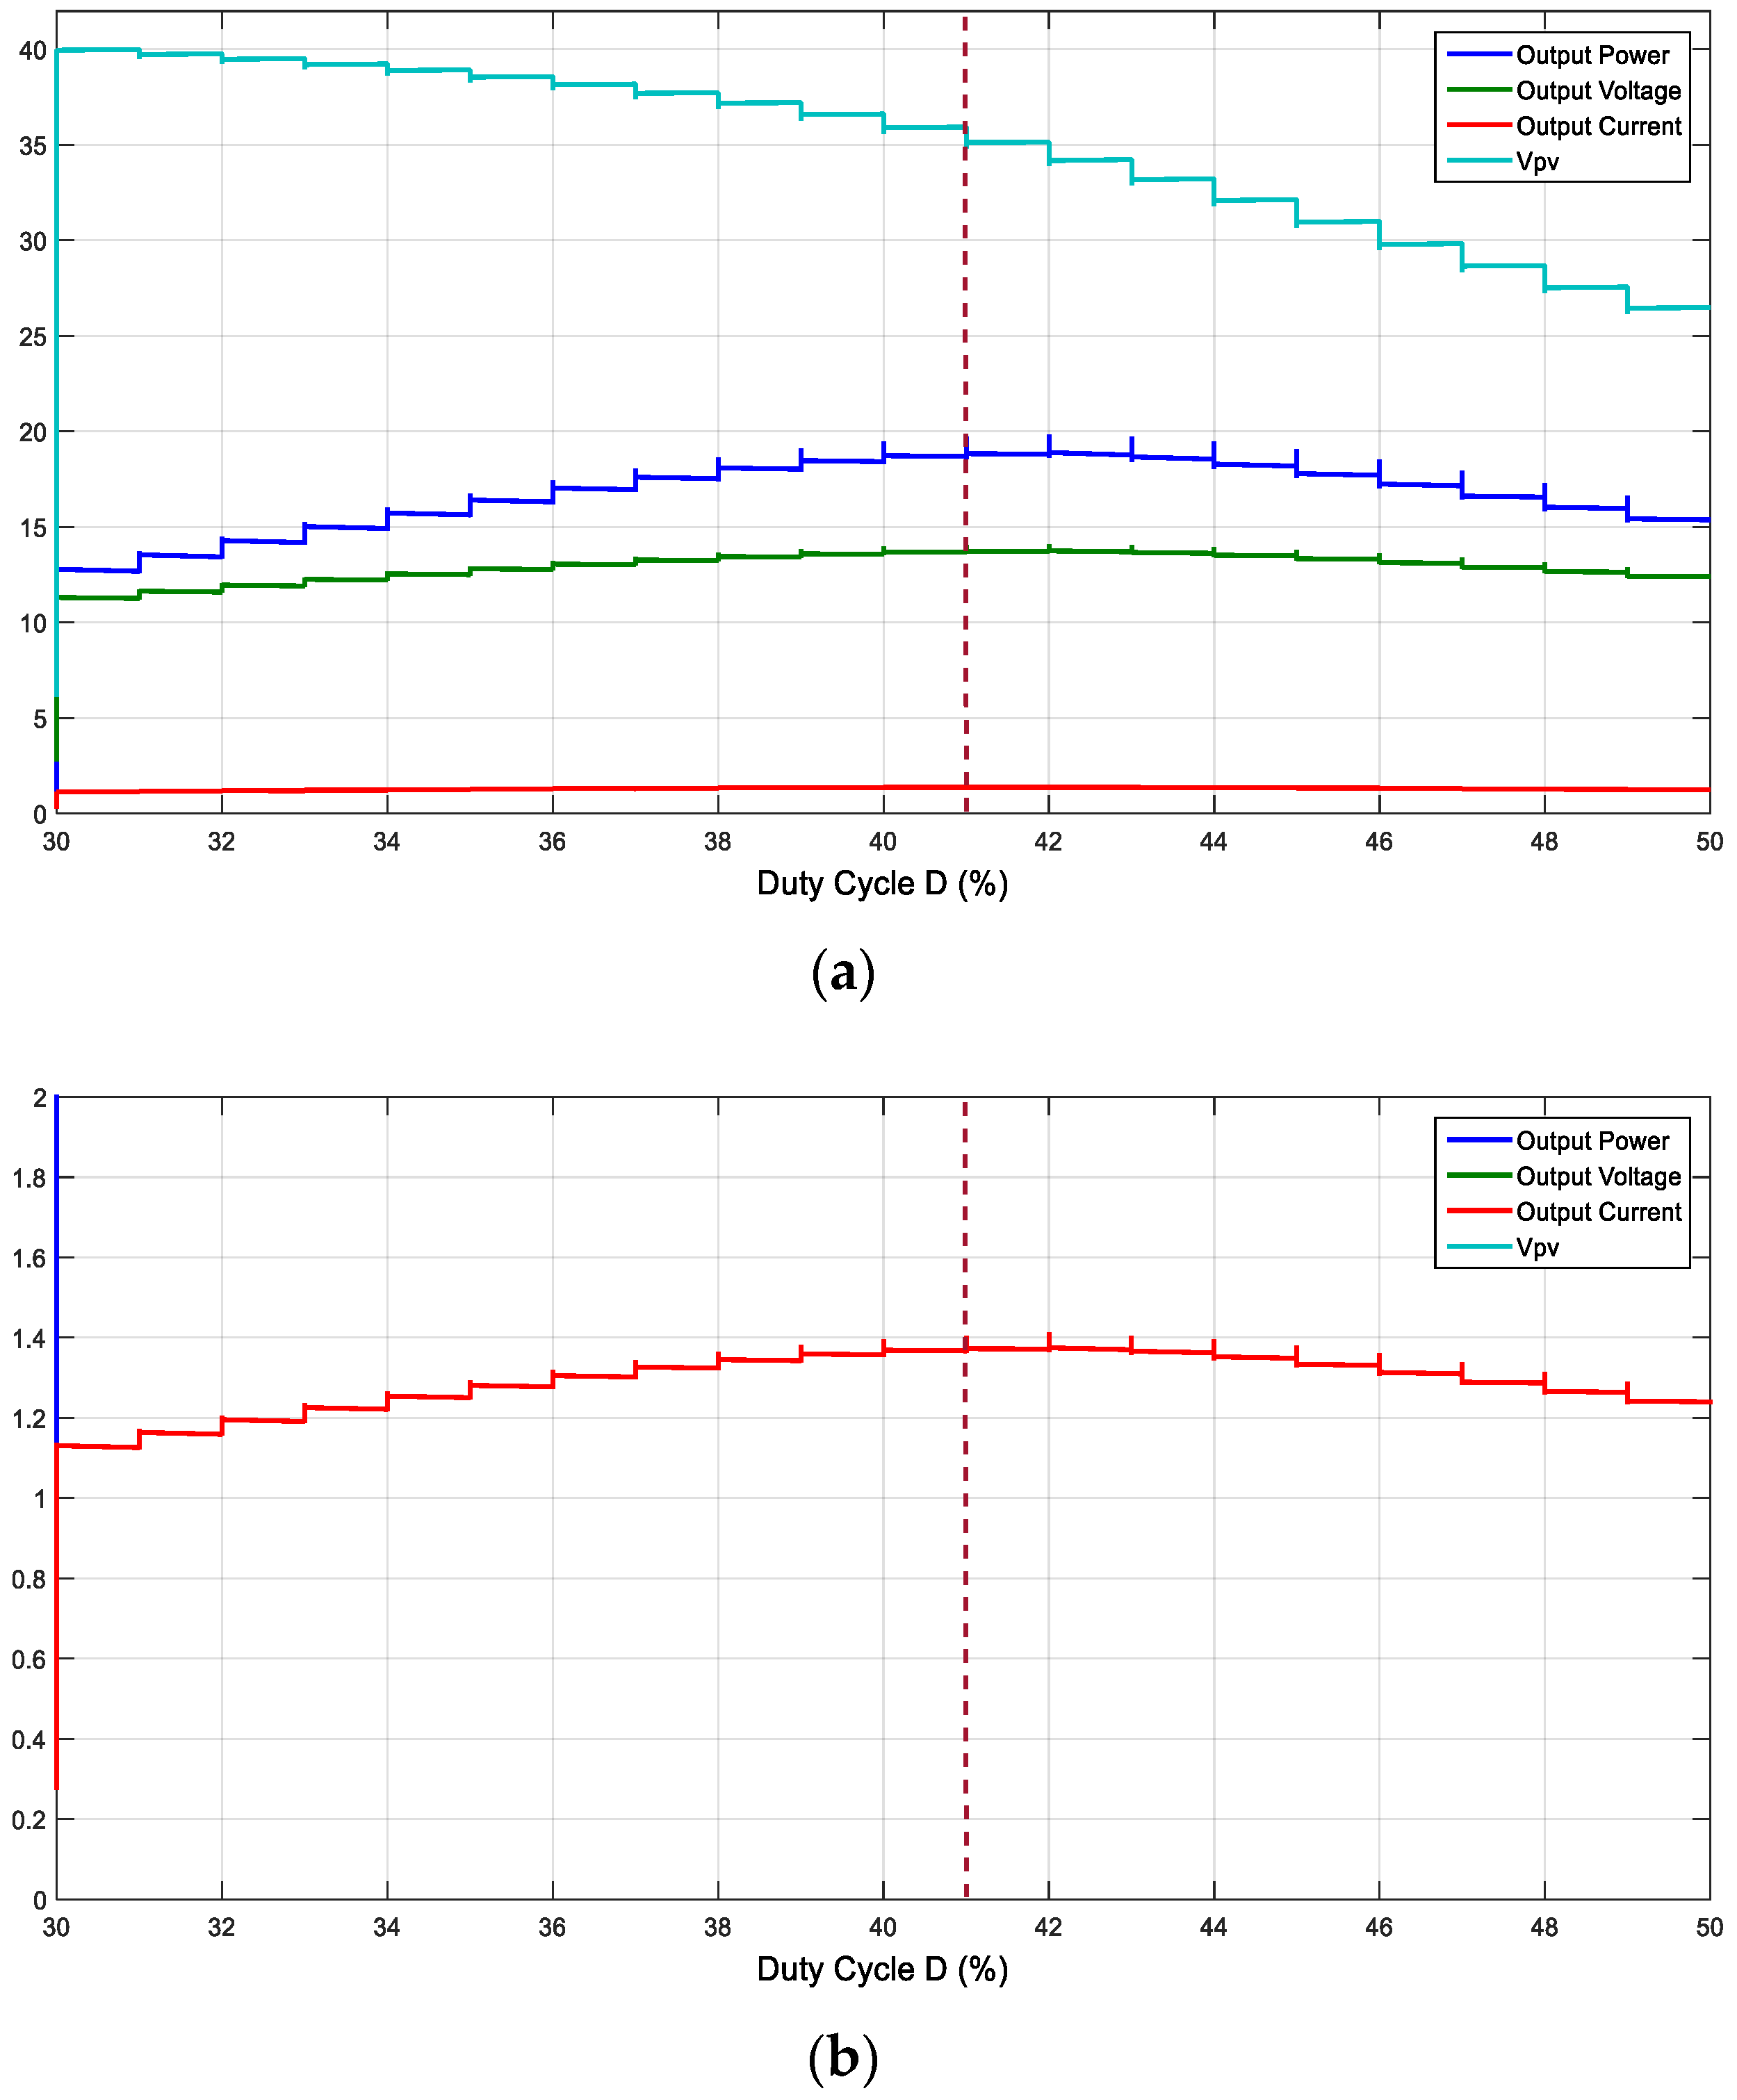
Figure 5. Buck converter: graph of output voltage, output current, output power, and VPV with duty cycle.
Figure 5 shows that the point of maximum power occurs when the load voltage is at the maximum at duty cycle D = 41% [15].
The current is also at the maximum where the power is maximum ay D = 41%, which is not visible in Figure 5a; by zooming in at the Y-axis, it is clear in Figure 5b.
5.3. Buck-Boost Converter: Graph of Output Voltage, Output Current, Output Power, and VPV with the Duty Cycle
A graph of the output voltage, output current, output power, and VPV with the duty cycle is presented in Figure 6. It shows that the point of maximum power occurs when the load voltage is at the maximum at duty cycle D = 75% [15]. The current is also at the maximum where the power is at the maximum at D = 75%, which is not visible in Figure 6a; by zooming in at the Y-axis, it is clear in Figure 6b.
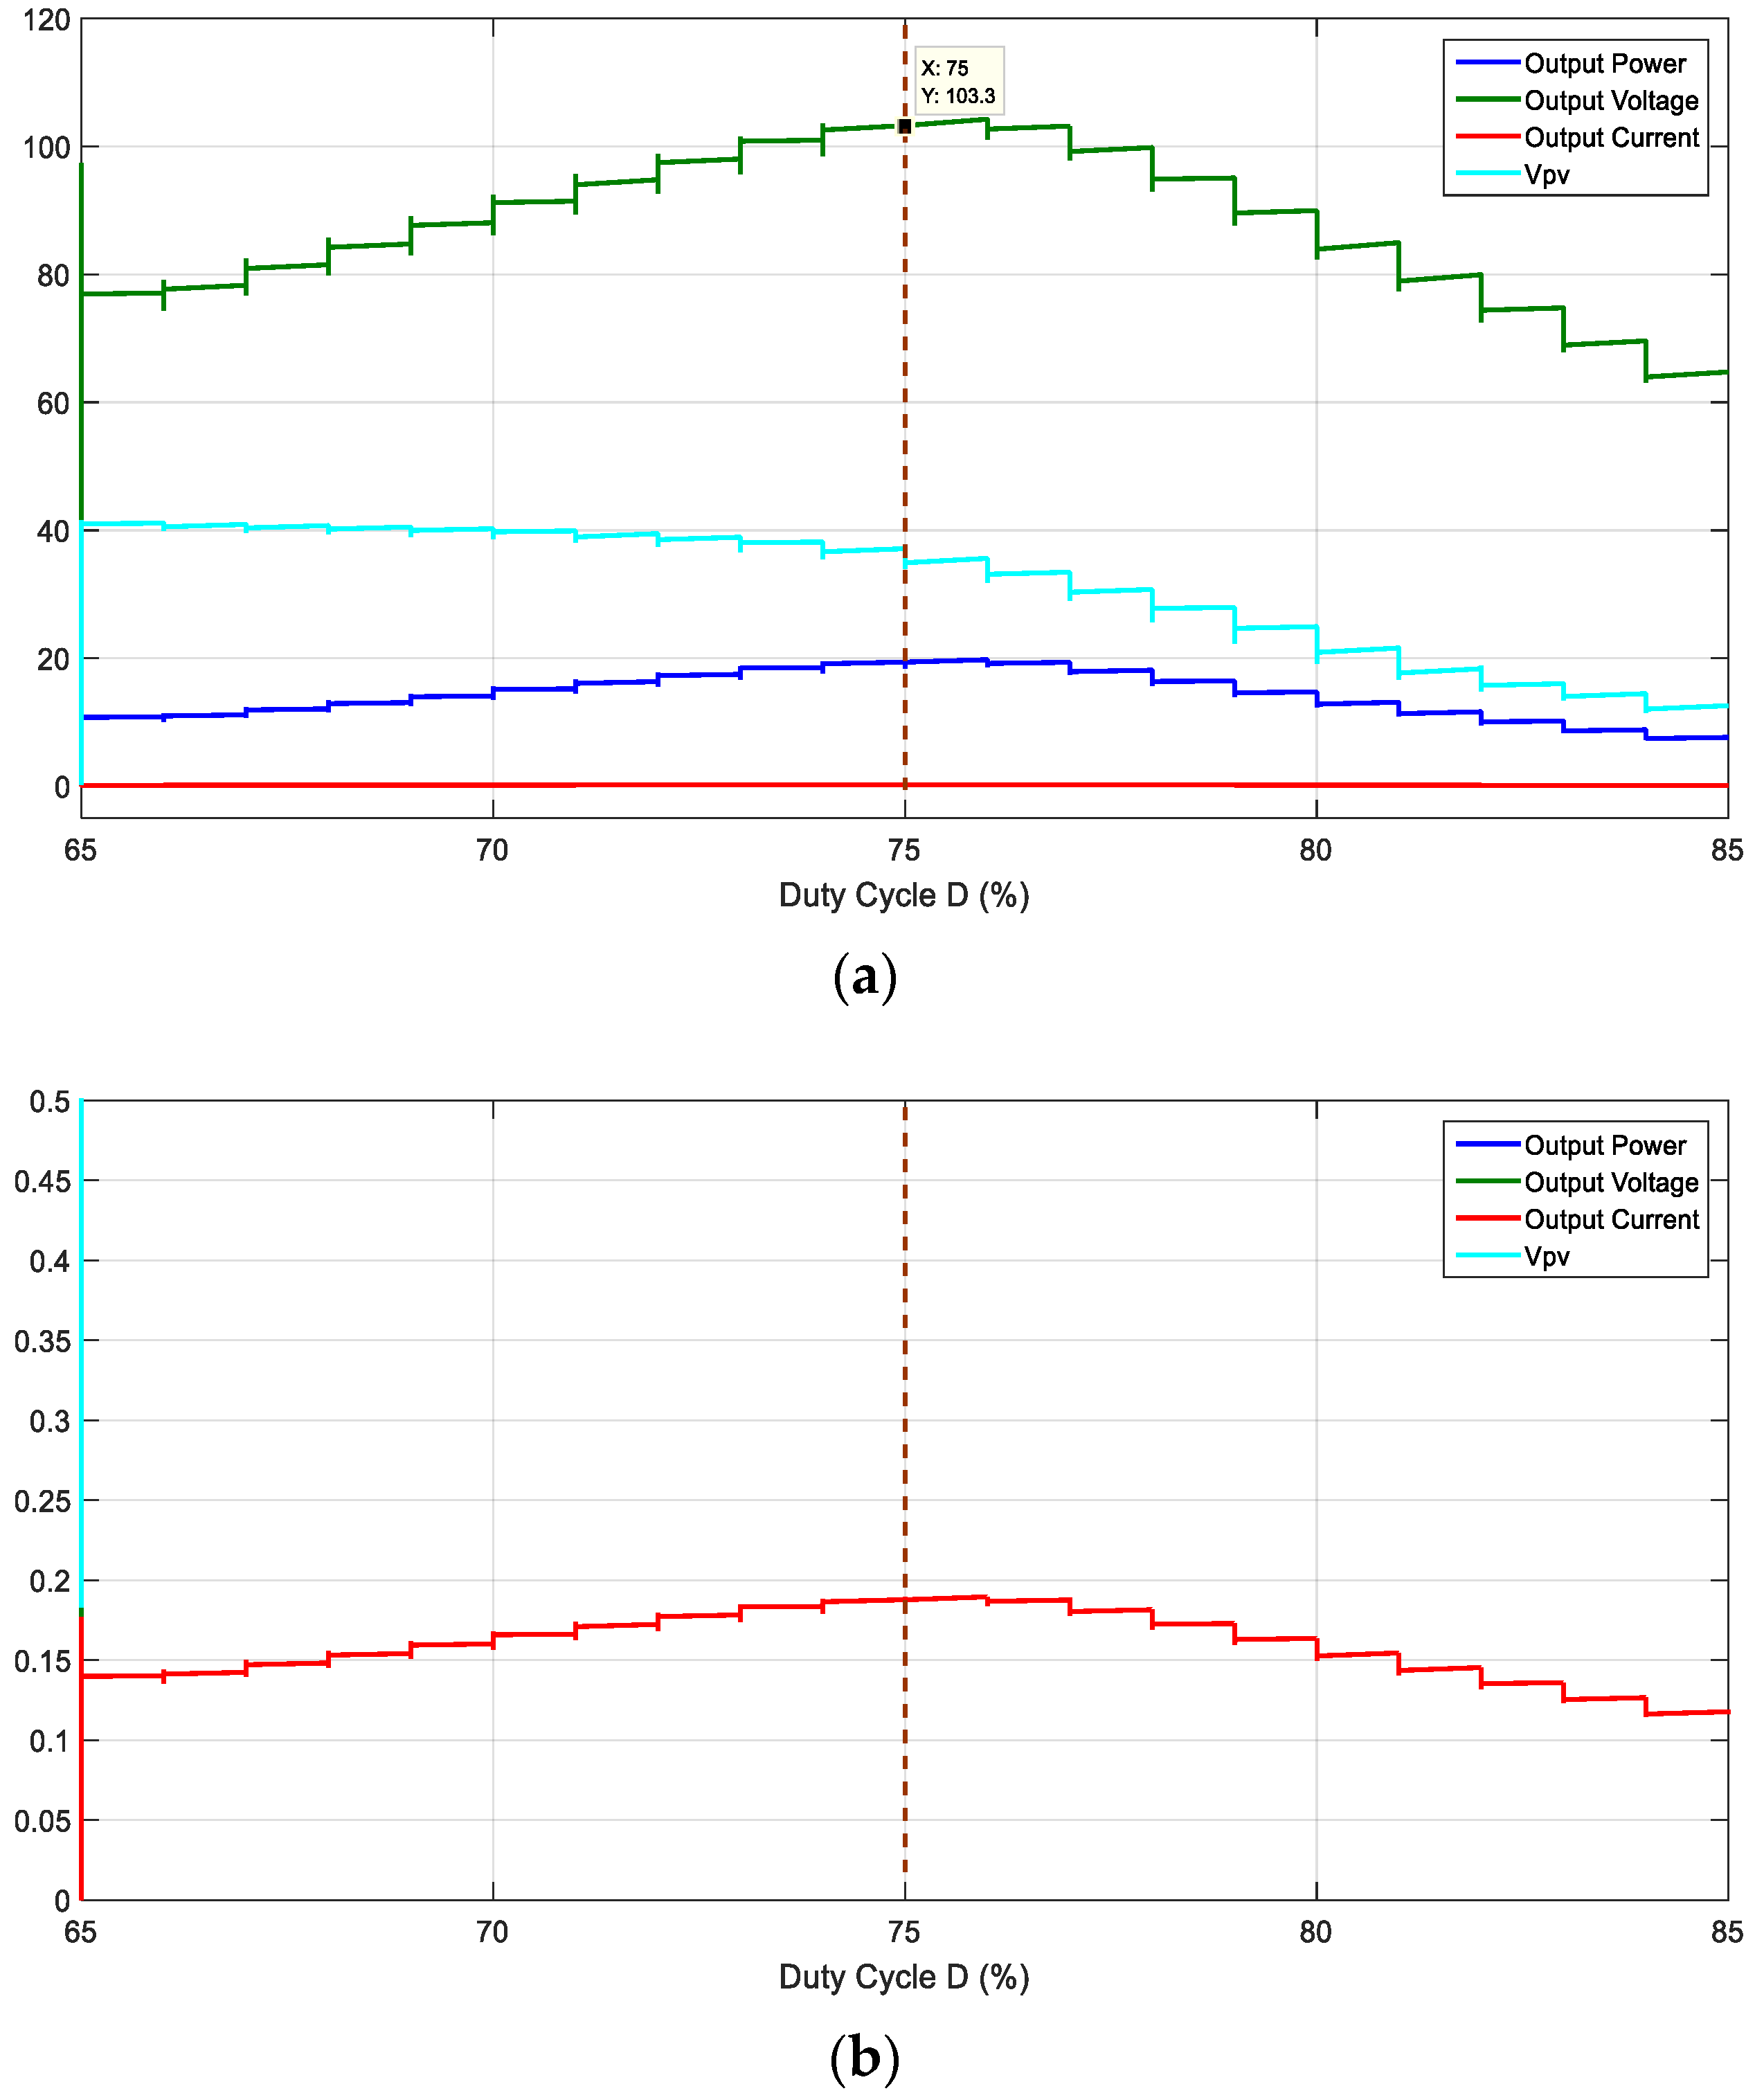
Figure 6. Buck-boost converter: graph of output voltage, output current, output power, and VPV with duty cycle.
5.4. Operating Principle of Proposed MPPT Technique
The conventional P&O method senses input parameters or PV side parameters, i.e., VPV and IPV, and compares power at different time intervals as well as keeps on oscillating around the maximum power. The maximum power will be transferred to the load when the load side voltage will be at the maximum. An MPPT technique is proposed which maximizes the load voltage in contrast to VPV in conventional P&O and causes maximum power to be delivered to the load, as shown in Figure 7. The calculated duty cycle for standard environmental conditions gives the maximum power at which the load voltage is at the maximum; this duty cycle becomes the maximum duty cycle (Dmax). The minimum duty cycle (Dmin) will be calculated by assuming the minimum set of environmental conditions, such as, for example, an insolation of 50 W/m2 and temperature of 25 °C. Calculation of Dmin and Dmax depends on the location of the solar PV array. In the proposed MPPT technique, the perturbation of the duty cycle is done within the range of Dmin to Dmax to maximize the load voltage; in this way, the proposed method becomes the PV array-dependent method. Nevertheless, the response time to achieve MPP becomes less.
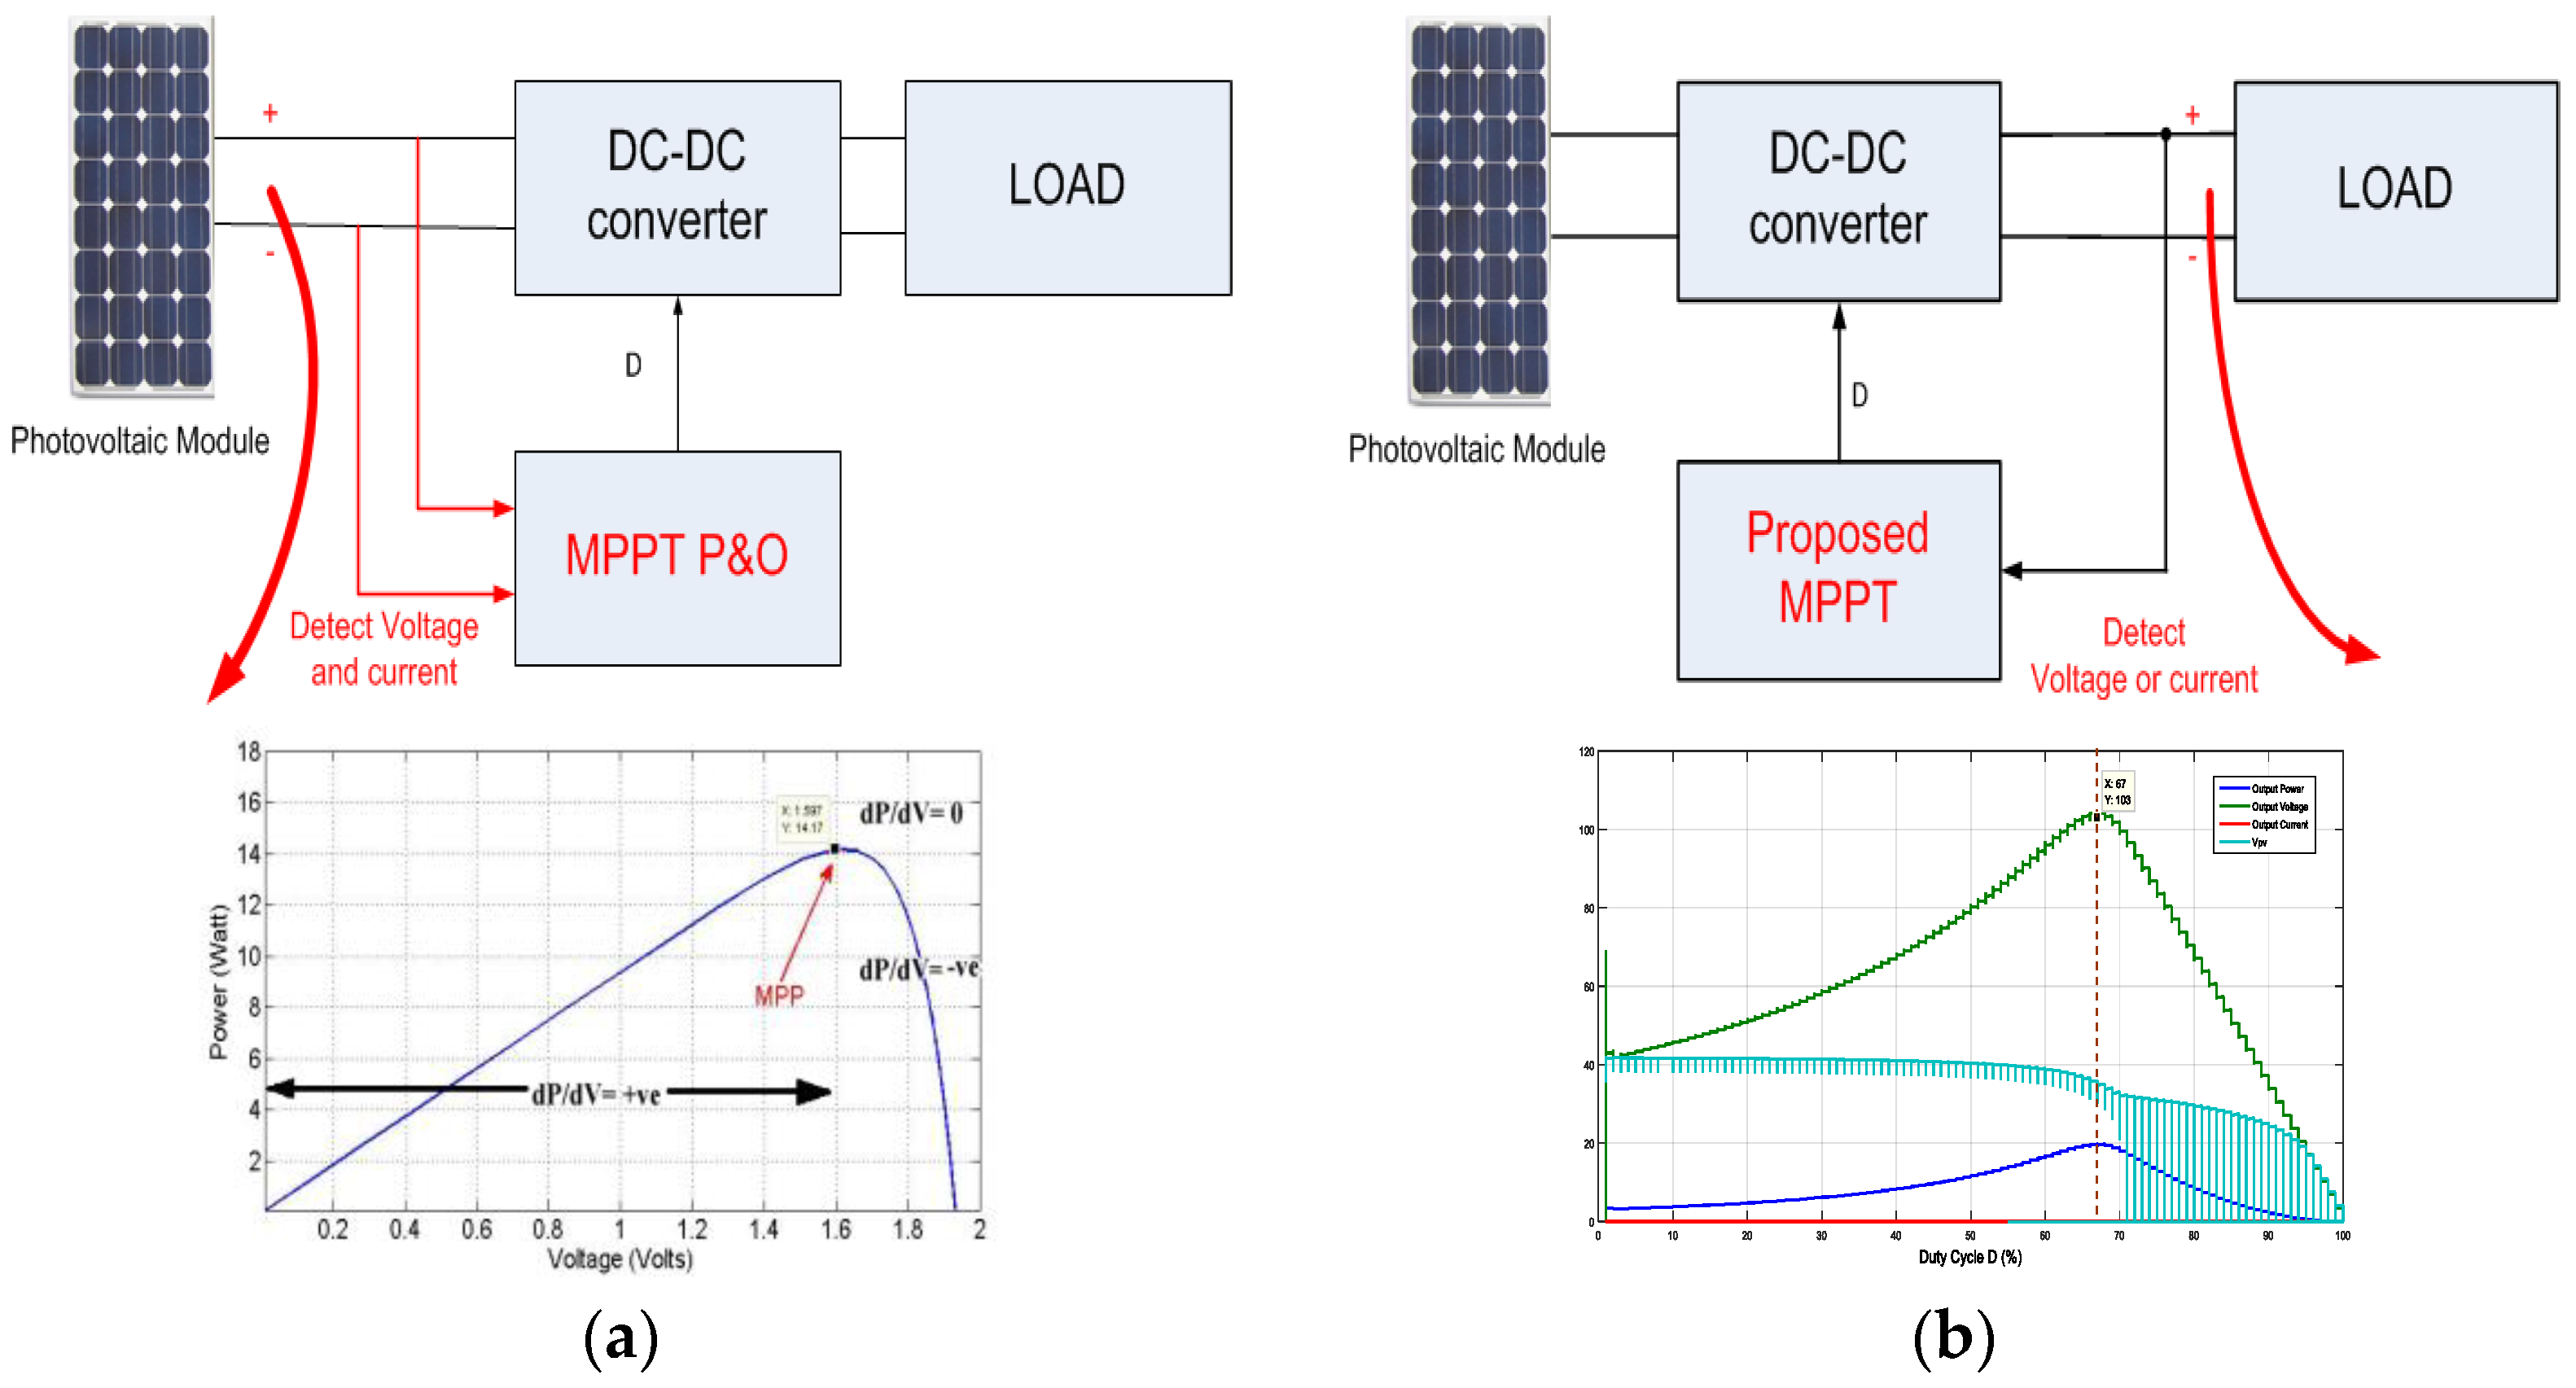
Figure 7. Comparison of (a) conventional P&O method with (b) proposed method in terms of sensing parameters.
This novel method is applied by perturbing the duty ratio at regular intervals and observing the load voltage, thus oscillating around the point, i.e., MPP. The operation is explained in Figure 7 and Table 2.
Table 2. Methodology of the proposed method.
| Perturbation | Change in Load Voltage | Next Perturbation |
|---|---|---|
| (+) Positive | (+) Positive | (+) Increment in duty ratio ‘D’ |
| (+) Positive | (−) Negative | (−) Decrease in duty ratio ‘D’ |
| (−) Negative | (+) Positive | (−) Decrease in duty ratio ‘D’ |
| (−) Negative | (−) Negative | (+) Increment in duty ratio ‘D’ |
5.5. Flow Chart of Proposed MPPT Algorithm
Figure 8 shows the flow chart of the proposed MPPT method. The method applies the perturbation in the duty cycle within a predetermined range (Dmin to Dmax) to regulate the output voltage of the converter or the load side voltage. The initial conditions are assumed to be zero, which means the previous value of the voltage and duty cycle is zero. The algorithm starts with the minimum value of the duty cycle (Dmin); senses the load voltage, which is is Vnew; and compares it to the previous value of the load voltage (Vold) if Vnew > Vold and Dnew > Dold. Then, the next perturbation is the positive increment of the duty cycle. The MPPT operation follows the methodology presented in Table 2.
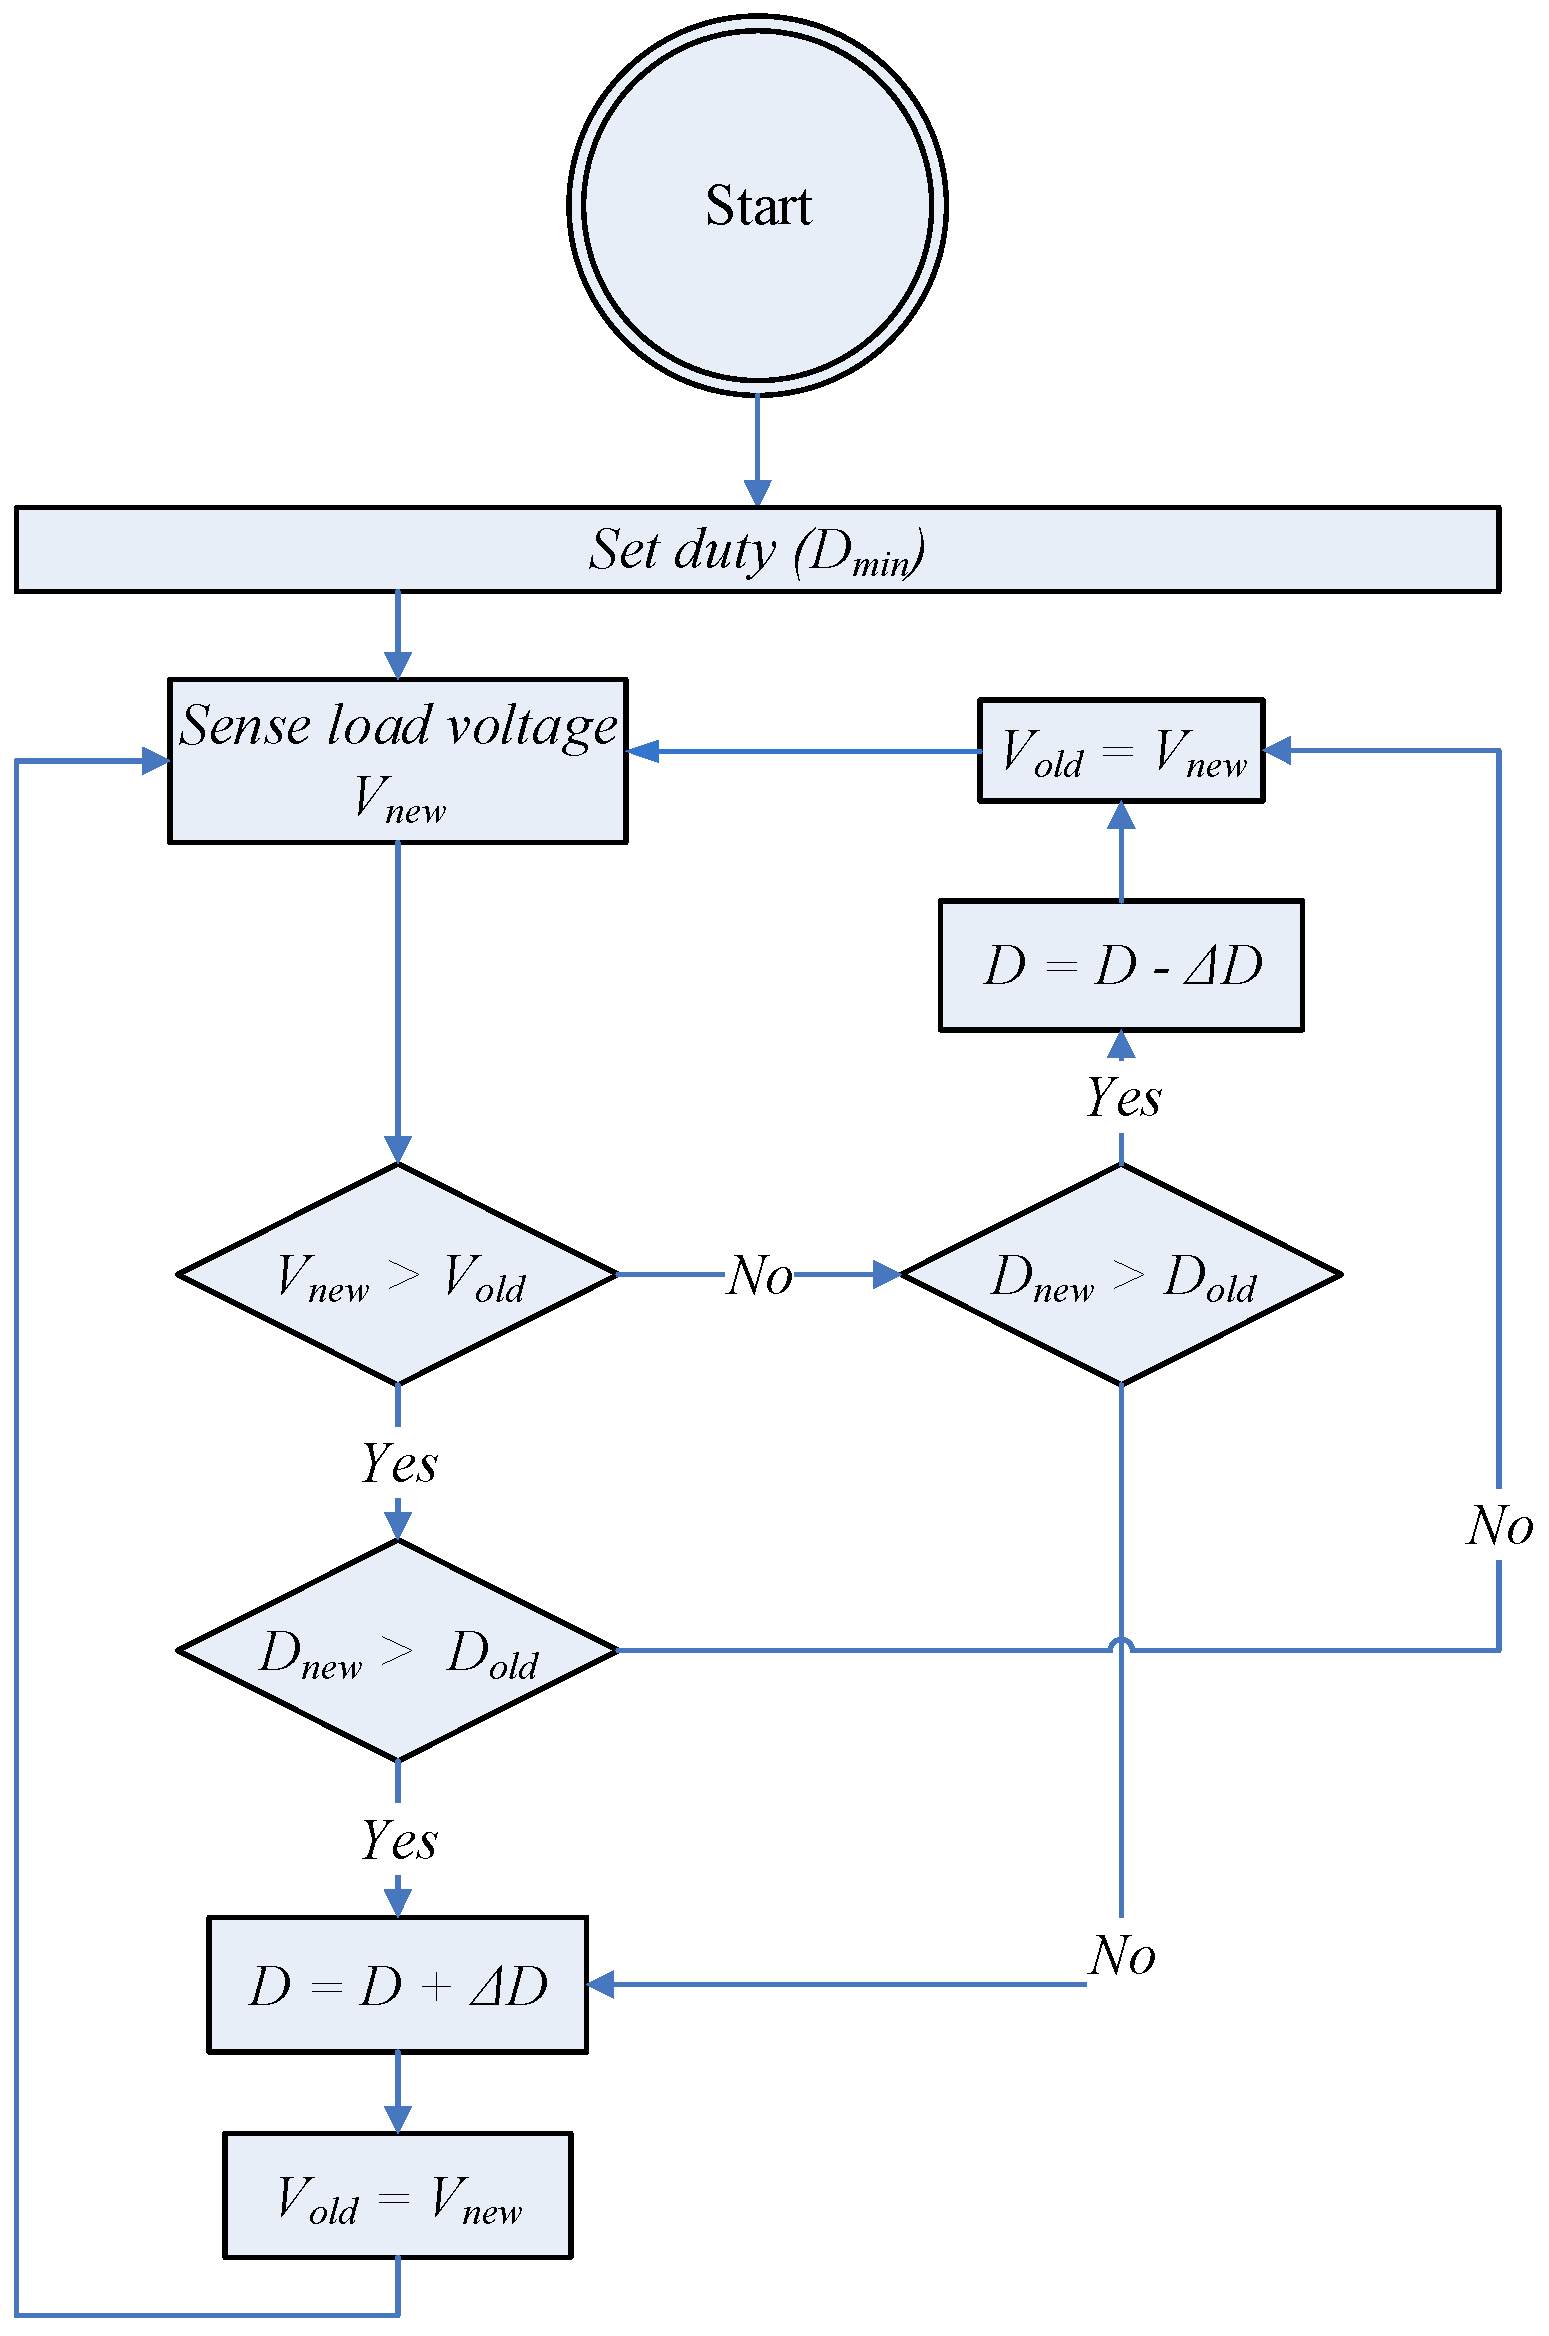
Figure 8. Flow chart of proposed MPPT algorithm.