Hepatic vessel skeletonization serves as an important means of hepatic vascular analysis and vessel segmentation. Skeletonization provides an effective and compact representation of an image object by reducing its dimensionality to a centerline while preserving the original topologic and geometric properties. Hepatic vascular analysis plays a critical role in the diagnosis and treatment of many liver diseases, classification of liver function regions and inquiry into the nature of vascular growth. Hepatic vessel skeletonization serves as an important means of hepatic vascular analysis, particularly because a hepatic vessel is a kind of thin tubular object satisfying the growth principle of Murray’s law.
1. Liver Diseases and Vasculature
Concretely, the liver is an extremely vital organ in our human body, which is vividly compared to being the “chemical plant” inside the body. It is an important functional module to maintain the normal metabolism of human body, playing the role of oxidation, regulating blood, storing liver sugar, manufacturing bile and so on
[1][2][3,4]. Subsequently, the liver is also the multiple “zone” of human diseases; in addition, liver diseases belong to clinical common diseases and frequently occurring diseases. In particular, the incidence of viral hepatitis, liver cirrhosis and liver cancer is relatively high, which seriously endangers people’s health. Therefore, the medical community considers the prevention and treatment of liver disease as a key research topic
[3][4][5][6][7][5,6,7,8,9]. Among them, liver diseases have many similar pathological changes, such as the rich vascular lesion, liver focal lesion, liver diffuse lesion, calcified liver lesion, liver lesion with bleeding, intrahepatic tumor lesion and liver hemangioma. The occurrence of these hepatic diseases and subsequent treatment process will generally be involved in hepatic internal tree vascular tissues
[5][8][9][7,10,11].
In terms of human liver diseases, liver cancer is one of the most common malignant tumors. The incidence of liver cancer accounts for 4343.7%
of the global total, and the number of deaths accounted for 45%
.
7% of the global total, and the number of deaths accounted for 45%. Its insidious onset, high recurrence rate and poor prognosis make liver cancer one of the cancers with the highest death rates. Currently, the treatment methods of liver tumor mainly include surgical resection, chemotherapy, radiotherapy, microwave ablation, radiofrequency ablation, etc. It is necessary to fully consider the blood supply relationship and mutual position relationship of the lesion area and vessels
[10][11][12,13]. In addition, as the blood vessels inside the liver fill the entire liver as a rich tree structure, the treatment of many liver diseases needs to involve the analysis and treatment of blood vessels; of course, this also includes the treatment of vascular diseases such as hemangioma
[5][12][13][7,14,15]. At the same time, the division of liver functions, such as the division of liver segment (see
Figure 1)
[14][15][16,17], the progress of liver segmentation and resection, the division of hepatic portal vein and hepatic vein
[16][18], etc., also rely on the accurate analysis and calculation of vascular tissue.
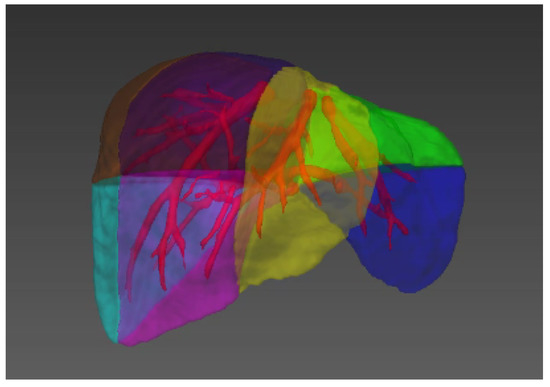
Figure 1. Illustration of the liver segments, a visual implementation based on the criterion of Couinaud’s liver segments. Couinaud scheme uses the horizontal portal vein axes and the three vertical hepatic veins axes to divide the liver into eight functionally independent segments
[14][15][16,17]. For liver surgical planning and treatment, the structure of hepatic vessels and their relationship to tumors are of major interest
[17][19].
2. Image Modality for Hepatic Vessels
Medical imaging has long been a crucial method for clinical diagnosis. In recent years, hardware design and software development have greatly promoted the development of medical imaging. The purpose of medical image analysis is to highlight some characteristic information in an image or to classify images. The significance is to help the radiologist or clinician conduct accurate diagnosis and treatment of the disease
[18][38]. In addition, the quality of medical imaging and the performance of medical image analysis is quite important since it directly affects the process of clinical diagnosis and treatment.
Table 1 illustrates the main components of medical imaging systems, including Computed Tomography (CT), Magnetic Resonance Imaging (MRI), ultrasound (US), Optical Coherence Tomography (OCT), Positron Emission computed Tomography (PET) and X-ray. The six image modalities have different strengths and application scenarios. For instance, the types of medical imaging for the liver blood vessels are CT
[19][20][21][22][23][24][39,40,41,42,43,44] and MRI
[25][26][27][28][29][30][45,46,47,48,49,50] in most cases and then US
[31][32][33][51,52,53]. Moreover, the process of medical imaging for hepatic vessels usually requires contrast agents for image enhancement; otherwise, the visibility of blood vessels will be very poor. Only a few researchers
[34][54] chose non-contrast images and conducted research experiments on hepatic vessels using X-ray
[35][55].
Table 1. Main image modalities in medical imaging [18]. Main image modalities in medical imaging [38].
| Imaging System |
Imaging Method |
Imaging Basis |
Advantage |
| CT |
Mathematics reconstruction |
Absorption coefficient |
High density resolution |
| MRI |
Mathematics reconstruction |
A variety of parameters |
Multiple functions |
| US |
Mathematics reconstruction |
Acoustic impedance interface |
Safe, dynamic and repetitive |
| OCT |
Mathematics reconstruction |
Based on interferometer principle |
High resolution |
| PET |
Mathematics reconstruction |
Using positron radionuclide labeling |
Accurate location and high clinical value |
| X-ray |
Transmission projection |
Density and thickness |
Strong penetrability |
34. Skeletonization Approaches Based on Vessel Segmentation
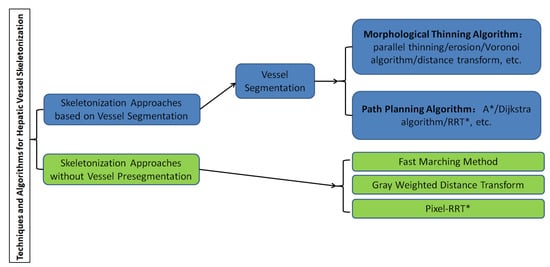
A graphical representation of the overall classification of techniques and algorithms for hepatic vessel skeletonization is shown in
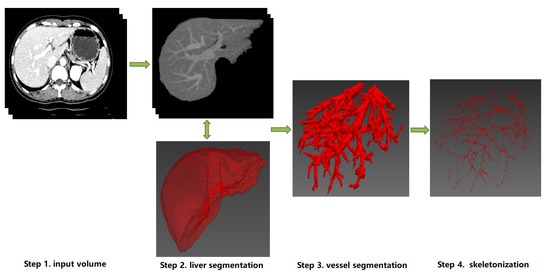
Figure 24, which helps readers gain a comprehensive preliminary understanding at first. Approaches of hepatic vessel skeletonization follow a uniform pipeline, as shown in
Figure 35, where the input volume of CT slices acts as a demo of multiple image modalities mentioned in the previous section. Techniques and algorithms for hepatic vessel skeletonization can be grouped into two major categories based on their calculation schemes and input types: (A) skeletonization approaches based on vessel segmentation and (B) skeletonization approaches without vessel segmentation. The first category (A) will be given an overall description in the following paragraphs of this section, and then a comprehensive introduction of the second category (B) will be given in the next section. As demonstrated in
Figure 35, category A contains entire stages, while the workflow of category B will skip the third step.
Figure 24.
Classification of techniques and algorithms for hepatic vessel skeletonization in medical images.
Figure 35. The schematic diagram of a uniform pipeline of hepatic vessel skeletonization. It represents two classes of skeletonization approaches (Category A and B). Category A: from Step 1 to Step 4, the datailed skeletonization methods executed between Step 3 and Step 4. Category B: Step 3 will be skipped, and the skeletonization outputs can be directly computed from the image data of Step 1 or Step 2. Note that the 3D visualization of Step 2, Step 3 and Step 4 can be implemented by ITK
[36][69], VTK
[37][70] and MITK
[38][71].
Skeletonization approaches are based on vessel segmentation; that is, the liver blood vessels are segmented and extracted from the image in advance, and then the skeleton is extracted based on the results of blood vessel pre-segmentation. Before blood vessel extraction, with the help of liver segmentation algorithms, the liver parenchyma is generally extracted from the initial input image such as the DICOM gray scale so as to obtain the effective Region of Interest (ROI) of blood vessel segmentation, which is convenient to the next step of image processing. Based on the obtained binarization image results of liver vascular segmentation, the vascular skeleton could be extracted by the representation methods described below. Before
thwe
researchers delve into the details of every skeletonization approach based on vessel pre-segmentation,
the researchers we provide a brief overview of hepatic vessel segmentation approaches, which can be divided into two classes of traditional methods and machine learning-based methods.
3.1. Hepatic Vessel Segmentation
4.1. Hepatic Vessel Segmentation
The main approaches of hepatic vascular pre-segmentation are briefly described in this section. Currently, with the rapid development of deep learning techniques, the main approaches can be roughly grouped into traditional methods and machine learning-based methods
[39][40][41][72,73,74].
The traditional methods are mainly represented by the combination of a Hessian matrix for vascular multi-scale enhancement and threshold algorithm
[42][43][44][75,76,77] or active contour model (ACM)
[25][45][46][47][48][45,78,79,80,81]. The Hessian matrix is a matrix composed of image pixels corresponding to second derivatives in an image space, which represents the gradient change degree of image gray scale. For the actual three-dimensional medical image, the Hessian matrix has three eigenvalues and three corresponding eigenvectors. The three eigenvalues represent the anisotropy of the image changes in the direction indicated by the three eigenvectors. The point structure in the image has isotropy, while linear structure has anisotropy. Therefore, the linear vascular structure in the image can be enhanced by the filter function designed by the eigenvalue calculation of the Hessien matrix. Then, based on the results of vascular enhancement, classical threshold algorithms such as region growing
[49][50][51][82,83,84] or graphcuts
[52][53][54][85,86,87] can be used to complete the task of vascular segmentation. Due to the complexity of vascular structure of hepatic vessels, the imaging quality of small vessels and other factors, it is difficult to guarantee the continuity and even correctness of vascular segmentation results, which is one of the main problems faced by traditional vascular segmentation methods, and of course, it is also the focus of machine learning-based methods in recent years.
3.2. Morphological Thinning Algorithm
4.2. Morphological Thinning Algorithm
Based on the binarization image results after vascular pre-segmentation, the entire image consists of only a foreground and background. The vascular region is the foreground, and its pixel value is generally set to be 1, while non-vascular region is the background and its pixel value is generally set to be 0. Therefore, it is much easier to carry out further vascular skeleton extraction based on the vascular region in the foreground, among which there are many classical methods in the literature. Here, an overview of the relevant methods of morphological image processing is provided.
It is very important to thin out binary images in target recognition. The core of parallel thinning algorithm is the thinning algorithm. The parallelism is a result of the parallel program and it can be developed in the structure of the algorithm to greatly improve the efficiency of the original thinning algorithm. Morphological thinning (that is, the input of the binary image) the foreground target area strips the contour points layer by layer, but it still retains the original shape until the image centerline skeleton is obtained. The thinning algorithm is generally implemented by morphological thinning
[55][56][57][58][99,100,101,102], erosion
[59][103], Voronoi algorithm
[60][61][104,105] or distance transform
[62][63][106,107] based on the connected domain, in which the algorithm of
[64][108] is the most classical one. It deletes or retains the corresponding pixels based on the distribution of pixels in eight neighborhoods and finally reasonably ensures connectivity after thinning and maintains the basic morphology of the original image, but the thinning results cannot be strictly guaranteed to be a single pixel. In 3D medical images, it is impossible to guarantee the property of a single voxel with respect to the thinning results, which brings difficulties to post-processing such as blood vessel classification. Therefore, many subsequent scholars put forward corresponding improvement schemes for these types of problems. For more information on Hilditch, Pavlidis, Rosenfeld and other thinning algorithms, please refer to
[65][109].
3.3. Path Planning Algorithm
4.3. Path Planning Algorithm
Based on the obtained binarization images of hepatic vessel segmentation, the path search based on Euclidean distance or Manhattan distance can also be performed directly for the foreground area where the blood vessels are located. Many classical path planning algorithms can be transferred to binary images for vessel skeleton searches based on vessel segmentation results. This section focuses on the classic Dijkstra algorithm, A* algorithm, RRT* algorithm and their present variants.
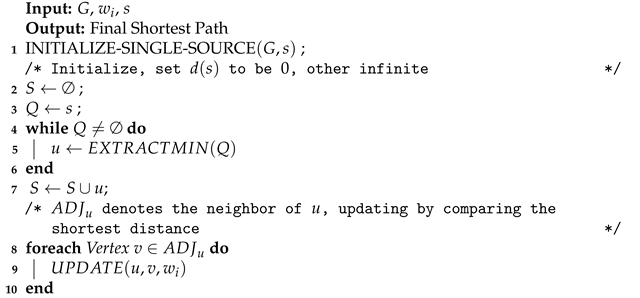
The Dijkstra algorithm [66][67] is a shortest-path algorithm proposed by Edsger Wybe Dijkstra in 1956. This method is a classical single-source shortest path algorithm, which is used to calculate the shortest path from the initial node to other nodes. Combined with the breadth-first search idea, its main characteristic is using Euclidean distance as the cost to measure the path’s length, taking the starting point as the center to expand to the outer neighborhood iteratively, until extension to the end point. The Dijkstra algorithm constructs graph G=(V, E) in the computational domain. Assuming that the length (i.e., weight) of each edge Ei is Wi, according to Algorithm 1, after iterative searcing, the shortest path from the initial vertex s relative to other points (including the target point) can be calculated. Thus, the final vessel skeleton can be obtained through path planning and the corresponding constraints. The Dijkstra algorithm [110,111] is a shortest-path algorithm proposed by Edsger Wybe Dijkstra in 1956. This method is a classical single-source shortest path algorithm, which is used to calculate the shortest path from the initial node to other nodes. Combined with the breadth-first search idea, its main characteristic is using Euclidean distance as the cost to measure the path’s length, taking the starting point as the center to expand to the outer neighborhood iteratively, until extension to the end point. The Dijkstra algorithm constructs graph G=(V,E)
in the computational domain. Assuming that the length (i.e., weight) of each edge Ei is wi, according to Algorithm 1, after iterative searcing, the shortest path from the initial vertex s relative to other points (including the target point) can be calculated. Thus, the final vessel skeleton can be obtained through path planning and the corresponding constraints.
| Algorithm 1: | Dijkstra Framework. |
 |
UPDATING. To be continued.