The tumor microenvironment (TME) surrounding tumor cells is a complex and highly dynamic system that promotes tumorigenesis. Cancer-associated fibroblasts (CAFs) are key elements in TME playing a pivotal role in cancer cells’ proliferation and metastatic spreading. Considering the high expression of the fibroblast activation protein (FAP) on the cell membrane, CAFs emerged as appealing TME targets, namely for molecular imaging, leading to a pan-tumoral approach. Therefore, FAP inhibitors (FAPis) have recently been developed for PET imaging and radioligand therapy, exploring the clinical application in different tumor sub-types. The present review aimed to describe recent developments regarding radiolabeled FAP inhibitors and evaluate the possible translation of this pan-tumoral approach in clinical practice. At present, the application of FAPi-PET has been explored mainly in single-center studies, generally performed in small and heterogeneous cohorts of oncological patients. However, preliminary results were promising, in particular in low FDG-avid tumors, such as primary liver and gastro-entero-pancreatic cancer, or in regions with an unfavorable tumor-to-background ratio at FDG-PET/CT (i.e., brain), and in radiotherapy planning of head and neck tumors. Further promising results have been obtained in the detection of peritoneal carcinomatosis, especially in ovarian and gastric cancer. Data regarding the theranostics approach are still limited at present, and definitive conclusions about its efficacy cannot be drawn at present. Nevertheless, the use of FAPi-based radio-ligand to treat the TME has been evaluated in first-in-human studies and appears feasible. Although the pan-tumoral approach in molecular imaging showed promising results, its real impact in day-to-day clinical practice has yet to be confirmed, and multi-center prospective studies powered for efficacy are needed.
- cancer-associated fibroblast
- fibroblast activation protein
- FAPi
- PET/CT
- theranostic
1. Introduction
1.1. Targeting the Tumor Microenvironment
- A small cluster of homogeneous cancer cells. These tumors evade immune surveillance as they are in a very early stage of development or because they are a newly metastasized colony.
- Tumors with lymphocyte infiltration that release cytokines and directly engage with cancer cells, recruiting blood cells to the tumor. At the same time, nearby macrophages and fibroblasts are converted into tumor-associated macrophages (TAMs) and cancer-associated fibroblasts (CAFs).
- Tumors without infiltrating lymphocytes, encapsulated by CAFs with ECMs. They are filled with many stromal cells, including TAMs, CAFs, and myeloid-derived suppressor cells (MDSCs) and do not release cancer cells into the blood circulation.
- Tumors with a subgroup of cancer cells that undergo epithelial-mesenchymal transition, which downregulate some genes (such as E-cadherin, β-catenin, cytokeratin 5 and 6) and upregulate other genes (such as E-cadherin, vimentin, Snail, Slug, Twist, ZEB1 and 2, S100A4, MMP2 and 3, α-smooth muscle actin), so these tumors become metastasized, activating mobility-enhancing genes (such as S100 CBPP) and releasing cancer cells into the blood circulation that are often chaperoned by stromal cells.
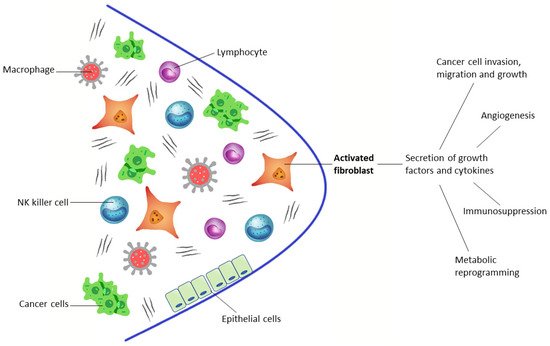
 Figure 1. The tumor microenvironment consists of tumor cells and nonmalignant cells, such as lymphocytes, macrophages, NK cells, normal epithelial cells, and activated fibroblasts (CAFs).
1.2. Developing PET Radiopharmaceuticals
2. Clinical Application of Fapi Pet in Oncology
2.1. Preclinical Studies
2.2. Pan-Tumoral Radiotracer
2.3. Gliomas, Primary Liver Cancer, and Gastro-Entero-Pancreatic Cancers
2.4. Head and Neck Cancers
| Authors | n | of Patients | Tumor Type | Clinical Setting | Injected Activity | n | Acquisition Timing | of PatientsImage Analyses | Reference Standard | 68 | Ga-FAPI Performance | Highest FAPi Uptake | Lowest FAPi Uptake |
|---|---|---|---|---|---|---|---|---|---|---|---|---|---|
| Tumor Type | Clinical Setting | Injected Activity | Acquisition Timing | Image Analyses | Reference Standard | 68 |
| Authors | Ga-FAPI Performance | 18 | F-FDG Performance | MRI Performance | ||||||||||||
|---|---|---|---|---|---|---|---|---|---|---|---|---|---|---|---|---|
| n | of Patients | Tumor Type | Clinical Setting | Injected Activity | Acquisition Timing | Image Analyses | Reference Standard | 68 | Ga-FAPI Performance | 18 | F-FDG Performance | MRI Performance | ||||
| Mona CE et al. [22] |
141 | Various cancer (14 types) | Biodistribution and kinetics | 174–185 MBq | ||||||||||||
| Röhrich M et al. [23] |
18 | Gliomas | Staging, Restaging | 54–96 min | S | HP | SE 80.9% | 150–250 MBq | Bile duct, bladder, colon, esophagus, stomach, lung, oropharynx, ovary and pancreas cancer | 30 min (FA-Pi04); 10, 60 and 180 min (FAPi-02) | S | MRI | SE 83.3%Liver, prostate, and renal cell cancer | |||
| - | SE 100% | - | SE 100% | |||||||||||||
| T: SE 84.4% | ||||||||||||||||
| N: SE 60%, | ||||||||||||||||
| Zhao L et al. [30] | 45 | Nasopharyngeal carcinoma | Staging, Restaging | 1.8–2.2 MBq/Kg | 40 min | V, S | HP, imaging follow-up | T: SE 86.7% | - | |||||||
| Kratoch wil C et al. [15] |
80 | Various cancer (28 types) | Staging, Restaging, RT planning | |||||||||||||
| Windisch P et al. [24] | 122–312 MBq | 13 | GBM | RT planning | 150–250 MBq60 min | |||||||||||
| N: SE 95% | N: SE 75.2% | N: SE 97.5% | S | HP, imaging follow-up | Low uptake (≤6): 7/28 TT; | 30 min | Mean uptake (6 > SUV < 12): 14/28 TT; High Uptake (≥12): 7/28 TT |
Lung, breast and esophageal cancer, cholangiocellular carcinoma and sarcoma (SUVmax ≥ 12) | Pheochromocytoma, renal cell, differentiated thyroid, adenoid cystic and gastric cancer (SUVmax ≤ 6) | |||||||
| S | MRI | SE 100% | Chen H et al. [32] |
68 | Various cancer (13 types) | Staging, Restaging | Guo 1.8–2.2 MBq/Kg | 60 min |
W et al. [26] | 34 | Hepatic nodules | StagingV, S | HP, imaging and clinical follow-up | T: SE 86.4% | T: liver, gastric, pancreatic and cervical cancer | T: oroesophageal and lung cancer |
| Chen H et al. [33] | ||||||||||||||||
| Qin C et al. [31 | 148–259 MBq | 60 min | V, S | HP, imaging follow-up | SE 87.4% | 75 | Various cancer (12 types) | Staging, Restaging | 1.8–2.2 MBq/Kg | 60 min | V, S | HP | T: SE 98.2% | Pancreatic, liver and oroesophageal cancers, sarcoma and cholangiocarcinoma (SUVmax ≥ 12) | Brain cancer | |
| N: SE 86.4%, SP 58.8% | ||||||||||||||||
| M: SE 83.8%, SP 41.7% |
| Authors | |||||||||||||||||||
|---|---|---|---|---|---|---|---|---|---|---|---|---|---|---|---|---|---|---|---|
| SE 64.9% | |||||||||||||||||||
| ] | 15 | - | |||||||||||||||||
| Nasopharyngeal carcinoma | Staging, Restaging | 1.85–3.7 MBq/Kg | 30–60 min | V, S | MRI | T: SE 100% | T: SE 100% | - | Şahin E et al. [27] |
31 | GEP | Staging and follow-up after treatment | 2–3 MBq/Kg | 45 min | V, S | Imaging follow-up, tumor biomarker findings, HP | SE 93.5% (patient based) | SE 71% (patient based) | - |
| SE 95.9% (lesion based) | SE 79.6% (lesion based) | - | |||||||||||||||||
| SP 92.9% | |||||||||||||||||||
| N: SE 50%, | |||||||||||||||||||
| SP 92.9% | - |
| N: SE 48% | |||||||||||||
| N: SE 100% | - | ||||||||||||
| M: SE 100% | M: SE 0% | - | |||||||||||
| Pang Y et al. [28] |
35 | GI tract | Staging, Restaging | 1.8–2.2 MBq/Kg | 60 min | V, S | HP | SE 100% | SE 43.8% | - | |||
| Chen H et al. [32] | 68 | Various cancer (13 types) | Staging, Restaging | 1.8–2.2 MBq/Kg | 60 min | V, S | HP, imaging and clinical follow-up | T: SE 86.4% | - | - | T: SE 100% | T: SE 52.6% | - |
| Chen H et al. [33] | 75 | Various cancer (12 types) | Staging, Restaging | 1.8–2.2 MBq/Kg | 60 min | V, S | HP | T: SE 98.2% | T: SE 82.1% | - | N: SE 78.6%, SP 82.1% |
||
| N: SE 86.4%, SP 58.8% | N: SE 53.6%, SP 89.3% |
- | |||||||||||
| N: SE 45.5%, | SP 76.5% |
- | M: SE 88.6%, SP 28.6% |
M: SE 57.1%, SP 85.7% |
- | ||||||||
| M: SE 83.8%, SP 41.7% |
M: SE 59.5%, SP 58.3% |
- | Jiang D et al. [29] |
38 | Gastric cancer | Staging | 111–185 MBq | 60 min | S | HP | T: SE 100% | T: SE 75% | - |