Your browser does not fully support modern features. Please upgrade for a smoother experience.
Please note this is a comparison between Version 2 by Vivi Li and Version 1 by Verônica Ghisolfi.
Freight transport decarbonization is currently an urgent challenge. Decarbonization strategies have a specific time to take effect, and it is essential to consider their time dependence. The system dynamics approach is well suited to represent feedback, lagged responses, and the time dependence of decarbonization strategies.
- freight transport
- decarbonization
- policy analysis
- systematic literature review
1. Introduction
The freight transport sector contributes to resource consumption, pollution, and climate change, mainly due to the increasing demand for, and burning of, fossil fuels [1]. Road freight alone accounts for about 7% of the world’s energy-related carbon dioxide (CO2) emissions [2], with a likelihood of increasing in the future despite progress in mobility electrification. This continued growth in emissions is mainly due to globally increasing consumption and, therefore, an increase in freight trips, which are still primarily based on internal combustion vehicles [3].
Decarbonization of the transport sector can only be achieved by combining several strategies with top-down policies [2]. The green logistics framework presents five strategies as the forward path to decarbonizing freight transportation [4]: (1) reducing freight transport demand; (2) shifting freight to lower-carbon transport modes; (3) improving assets utilization; (4) increasing energy efficiency; (5) switching to lower-carbon energy. Different policy instruments deal with the implementation of each decarbonization strategy. Modal shift, for example, can be achieved by employing fiscal measures (e.g., rail freight funding), regulatory measures (e.g., regulation of truck weight or size), and infrastructure investment [5]. Regardless of the decarbonization strategy adopted, decision makers must be aware that their policies, decisions, and actions may have second-order effects on the system, leading to the need for a macro view that enables addressing the problem in a systemic and integrated way.
To illustrate the problem, in some countries, the discussion focuses on using larger and heavier trucks to transport more freight instead of shifting to rails or waterways [6]. Increasing the payload of trucks can decrease environmental impacts, as evidenced by a case study in China [7], and operating costs of the road mode by ton–km, as evidenced by the case study of the transport of ornamental stones in Brazil [8]. However, the efficiency increase leads to a rebound effect over freight transport demand [9], worsening the system’s general state. This example demonstrates that a change in the vehicle system, without considering the freight demand mechanism, may not achieve the expected goal. Moreover, reducing road freight operating costs discourages the modal shift to cheaper modes, such as rail and waterways [6], which can hinder achieving global environmental goals imposed by climate change. On the other hand, if transport agents direct efforts toward a modal shift from road to rail, they must consider possible reactions from road haulers. Otherwise, the existing economic competition can undermine rail operation, whose competitive advantage depends on a constant freight flow. Freight transport decarbonization is a dynamic, complex system; in the decision-making process, one strategy may impact the other.
Besides the impacts of second-order effects, the system’s dynamics are also determined by the speed of change of its subsystems, i.e., the time that each decision or action takes to be implemented and take effect. In this sense, developing cleaner technologies and alternative fuels are relevant strategies for freight decarbonization, but knowing how long these technologies will take to be adopted by transport companies and used on a large scale is critical for crafting more realistic decarbonization targets and addressing the problem more efficiently. For example, in Brazil, ethanol and biodiesel have a long trajectory as national fuels, which were initially used to reduce dependence on oil imports during the oil crisis in the 1970s. In later decades, the ethanol and biodiesel industries suffered several political and economic impacts that delayed their full development [10]. Currently, the legislation requires the use of a minimum of 27% ethanol in gasoline and 10% biodiesel in diesel [11], failing to meet previously established targets.
Given the presented context, Ref. [12] highlights the importance of studies involving time-definite policy objectives and their impact on the dynamics of freight systems. The system dynamics (SD) modeling approach is suitable for investigating the effects of policies and strategies over a continuous time in complex systems [13,14][13][14]. SD has been a powerful tool for policymakers to predict system changes and future scenarios in different contexts, the most well-known being the Limits to Growth study by the Club of Rome in 1972 [15]. In Ref. [16], the authors were the first to discuss and evaluate the strengths and weaknesses of SD in relation to its suitability and appropriateness for transportation systems modeling, pointing out that it is well suited for modeling strategic issues, supporting policy analysis, and decision-making processes. In Ref. [17], a review of SD studies was presented, categorizing them by area of application in transportation studies and summarizing insights and recommendations for future application of the SD approach in this field. Interestingly, Ref. [17] mentioned just one study related to freight transport and environmental impacts. The discussion about alternative fuel vehicles was kept around the passenger transport system, which shows the lack of sufficient research in freight transport and decarbonization with this approach.
2. Reducing Freight Transport Demand
Reducing the freight transport demand requires a range of processes to minimize the physical amount of goods to be delivered, such as material efficiency, including making products last longer, recycling, digitization, designing products with less material, and postponement of product customization [4]. Other measures can include price increases, which affect transport demand according to cost elasticity. Table 31 summarizes the SD models’ objectives, policy elements, contributions, and limitations for reducing freight transport demand.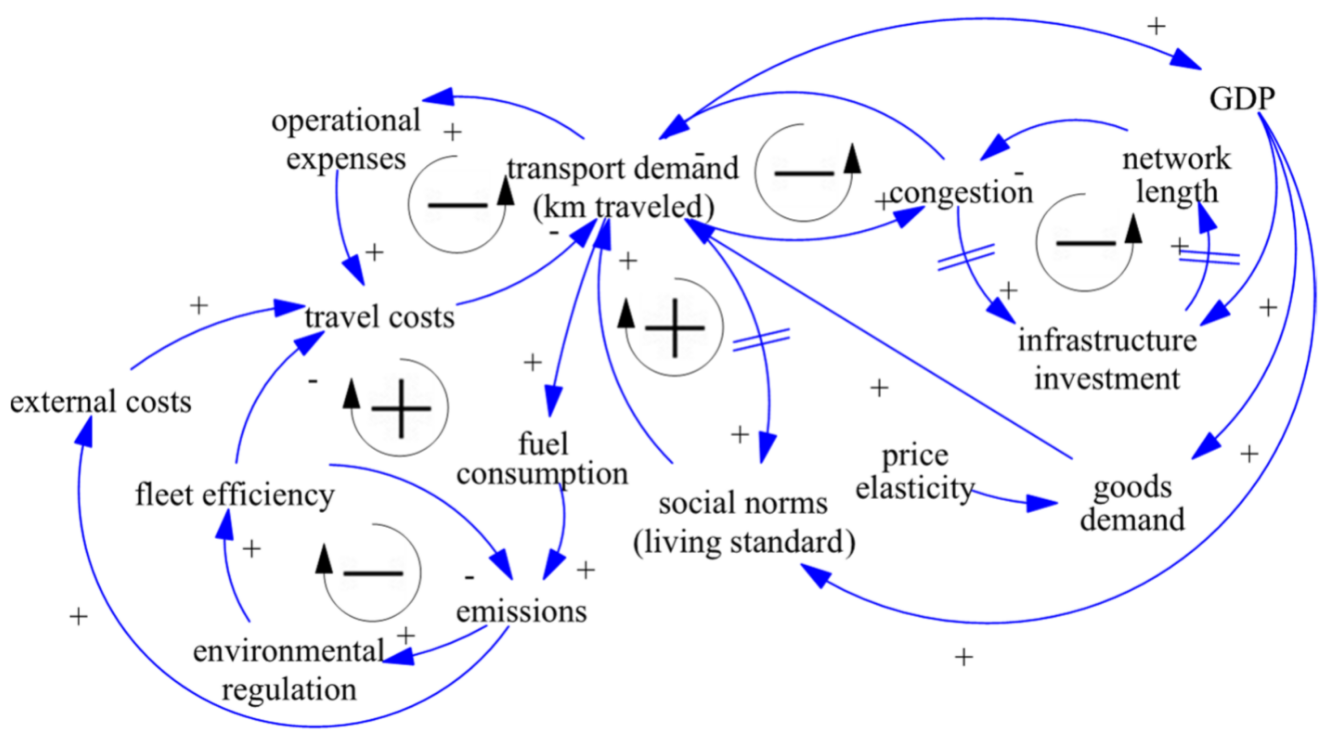
3. Shifting Freight to Lower-Carbon Transport Modes
It is important to increase the performance of railway, waterway, and combined multimodal transport in terms of the comparable price, quality, service, and flexibility of roadway transport to increase the use of alternative modes. Using synchromodality that focuses on optimal and flexible use of multiple modes is expected to contribute to this solution area [80][28]. Table 42 summarizes the SD models’ objectives, policy elements, contributions, and limitations for shifting mode modeling.
Table 42.
Contributions of SD models for shifting freight to low-carbon mode modeling.
| Authors | Objectives | Policy Elements | Contributions | Limitations |
|---|---|---|---|---|
| [68][29] | ||||
| 69][53] | To analyze the diffusion of technologies reducing CO2 emissions in heavy commercial vehicles | Investments in refueling infrastructure and R&D technologies | ||
| 62 | ||||
| ] | ||||
| [ | ||||
| 38 | ||||
| ] | ||||
| [ | ||||
| 39][40] | Evaluate alternative modal shift policies to eliminate overloaded trucking and increase sustainability | Legal weight regulation and investment in railway infrastructure | The weight regulation causes a higher total cost. Constructing a railway to shift freight away from highways is an effective option to achieve increasing sustainability | Some delays are assumed for model simplification without suitable discussion. Policies and their effects are fixed throughout the simulation period, which is unrealistic |
| [52][41] | To simulate logistics activities integrated into urban passenger rail transit networks | Different levels of infrastructure investment policy, network scale, and market competitiveness through price adjustments | The urban freight railway significantly decelerates the growth trend of external costs. However, due to the limited capacity of the system and the ever-growing urban demand, it is not sufficient to mitigate all externalities | Lack of analysis of multimodal transport system, reduction in truck damage to roads, and the benefits of land conservation, as well as the dynamics related to the policies simulated |
| [76][42] | To explore transport decarbonization considering economic, social, environmental, and transportation elements | Increase the use of alternative modes and optimize energy consumption through technological innovations | The results indicate that the mode shift is the most significant measure to reduce emissions | Dynamics for mode shift, such as company change requirements and time-lag responses, were not taken into account |
| [53][43] | Simulate the mode shift from road to rail by levying carbon emission taxes | Increasing carbon taxes and investments in the railway network | The policies investigated have a good effect on reducing carbon emissions in the transportation industry | The model does not consider important factors to the mode choice process and the time lag for the mode shift, although it does not occur instantaneously |
Analyzing the SD diagrams of the models regarding shifting freight to lower-carbon transport modes, their boundaries, variables, and interrelations that form the feedback loops or stock and flow structures can be identified.
The system dynamics model for economic assessment of sustainability policies of transport (ESCOT) was developed by Ref. [68][29] to assess the economic impacts of a sustainable transport system, considering macroeconomic, regional economic, transport, environmental, and policy aspects. The SD diagrams were not provided, but the results show that the growth of freight transport tends to be absorbed by rail and ship transport, since these alternative modes are attractive enough.
In Ref. [49][30], the authors evaluated CO2 emissions, considering factors that affect the modal share, such as freight volume, network length, fuel price, and fuel intensity. However, no information regarding the dynamics of changes in the system was provided, compromising the interactions between policies, mode choice, and emission mitigation discussions. Additionally, the modal share modeling does not consider the mode’s capacity and its influence on the mode choice.
In Ref. [40][31], the authors analyzed the modal shift process, driven by investment in the modes’ capacities. As the mode shift increases demand, it was assumed that increasing the competitiveness of the mode used would reinforce the mode shift. According to the authors, the inertia for the modal change is long; however, it was not evidenced how the pressure and policies to shift modes were quantified. The time to promote modal shift is randomly assumed as two years. However, its endogenous impact was not demonstrated, thus raising the question of how fast other decisions and actions must occur to achieve a good balance of modal share.
In Ref. [57][32], the authors explored strategies for emission reductions and determined the barriers to the mode switch, taking into account company types, decision-making behavior, generalized cost by mode, reliability, functionality, dynamic fleet model, and bands of high-, medium-, and low-cost interventions. The model was then applied, and the results show that there is more perception of reliability than cost changes [58][33]. The relationship between price and mode shift is not linear, capturing different companies’ responses, including their tolerance of cost increases, the time lag to implement the mode shift due to contractual considerations, and the need for implementing new systems.
In Ref. [77][34], the authors simulated the modal shift from road to rail through increased investments in the rail network. The benefits of this shift would include the reduction in trucks using the road network, better pavement conditions, and road safety. Such a transition would require significant investment to upgrade and maintain the rail track. The dynamic relationships could not be analyzed, since the SD diagrams were not provided.
In Ref. [33][35], the authors analyzed the emissions from the vehicle fleet on intercity highways. The scenario devoted to freight was to reduce vehicle kilometers traveled by increasing fuel price, promoting mode shift, and educating drivers to plan their routes and schedules. Therefore, this study does not provide the impact of the isolated freight scenario in freight transport demand reduction and emissions mitigation. The model description does not show the feedback loops described, and there is no clear relation between the fuel price and the average distance traveled. Moreover, it is not clear how assumptions or time lags for mode shift and route planning were designed, compromising policy evaluations.
The impact of policy measures on promoting the modal shift from road to rail, such as the increased road cost and containerization, was also examined [39][36]. Increases in the imposition of taxes generally cause an increase in the total logistics cost of road transport. In contrast, containerization causes a decrease in the entire logistics cost of intermodal transport. The rate to implement the policy measures was not provided, but the results showed that the modal shift by containerization occurred more rapidly than by all kinds of road taxation.
The mode shift and sustainability of urban transportation were analyzed by Ref. [42][37]. The model assumes that the increasing economy leads to more freight volume, truck trips, and vehicle kilometers traveled, which increases congestion, delivery travel time, and emissions, all impacting economic development. However, the increasing economy also leads to more rail investments; then, the truck trip is reduced together with vehicle kilometers traveled, congestion, delivery travel time, and emissions, resulting in better economic development. The results show that the high-density development of the rail network leads to the best performance of urban transport sustainability.
In Refs. [60[38][39][40],61,62], the authors evaluated modal shift policies to eliminate overloaded trucking. According to the initial modal share, the freight volume by mode is converted into the modal traffic, impacting congestion levels and transport time and determining the next modal split. The results show that the modal shift increases sustainability. However, the reduced freight volume of highway systems would make highway carriers react, e.g., reducing trucking prices to compete with railway transport. Further studies could address the gaming processes of multiple stakeholders.
In Ref. [52][41], the authors simulated logistics activities integrated into passenger rail networks. The growth of the rail network improves its competitiveness and market share. External benefits stimulate more investment and subsidies, which accelerate the modal shift. On the other hand, negative impacts, such as job reductions and decreases in fuel tax revenue, decrease the investments. Although dynamics have not been analyzed, the results show that the railway system mitigates emission costs.
In Ref. [76][42], the authors explored the decarbonization goal, considering that economic development increases transportation demand and provides funds for infrastructure construction. The gap between supply and demand restricts the economic level, leading to more infrastructure investments increasing transport supply. It was also assumed that economic development guarantees technological investment, improves transportation efficiency, and reduces energy consumption using alternative modes and technological innovations. The results indicate that the mode shift is the most significant measure, although time lags were not taken into account.
In Ref. [53][43], the authors simulated the mode shift by levying taxes on carbon emissions. The increasing economy leads the government to invest in railway freight transport. The government also imposes a carbon tax based on CO2 emissions, encouraging the modal shift, promoting the demand and growth of railway freight transport revenue, thereby raising the economy level and reducing road transport demand and CO2 emissions. The policies investigated have a positive effect on reducing emissions; however, exceeding the carbon levy rate will cause the transfer of short-distance trips from road to rail. This result indicates that the model could be improved by considering other relevant factors, such as trip distance and freight flow. Moreover, no time lag was mentioned for the mode shift, although the companies’ resistance, time for adaptation, and inertia play a role in the mode choice process.
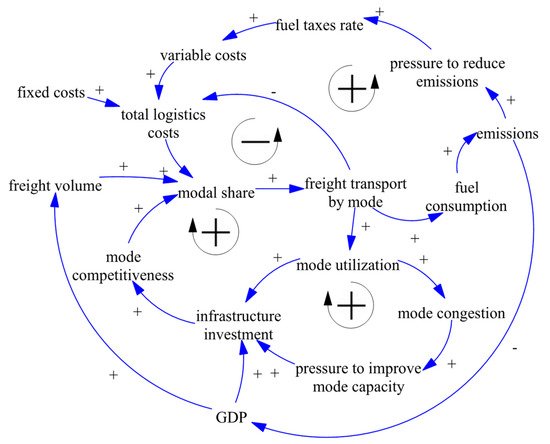
Despite the differences presented in the literature, some common variables and feedback loops that rule the dynamic relationships in shifting freight to lower-carbon transport modes can be highlighted, as shown in Figure 42. In this case, emissions and fuel consumption depend on the mode used, according to the modal share. Factors influencing modal share include logistics costs, freight volume, and mode competitiveness. Economic development and pressure to reduce emissions also play a role in the feedback loops.
4. Improving Assets Utilization
Optimizing assets utilization accommodates more freight transport demand with the same infrastructure and capital investment. It can be achieved through load optimization and consolidation, asset sharing, and better management of logistics centers, warehouses, and transport infrastructure. Transport predictability and flexibility are important enablers for this solutions area [80][28]. Table 53 summarizes the SD models’ objectives, policy elements, contributions, and limitations for improving vehicle utilization modeling.
The models differ in terms of boundaries delimitation, inputs, and outputs. Consequently, distinct structures of causal loop diagrams or stock and flow diagrams were found according to their goals. In Refs. [43[18][19],51], the authors assessed the rebound effects of efficiency gained with information and communication technologies over freight demand stimulation, which counterbalances or even outweighs positive environmental benefits.
As people get used to traveling more and having access to more goods due to gross domestic product (GDP) improvement, the social norm increases, influencing travel and consumption in a reinforcement feedback loop [45][20]. Moreover, as fleet efficiency increases, travel costs decrease, leading to a rebound effect on transport demand. On the other hand, road congestion limits the growth in transport demand. A high volume of urban transport will lead to more traffic and reduce environmental quality [56][21]. It would require legal regulations (e.g., higher taxes) to reduce transport demand. On the other hand, if the freight transport volume is high, the efficiency of logistics operations is likely to grow, improving economic performance and increasing freight transport demand.
Table 53.
Contributions of SD models for improving vehicle utilization modeling.
| Authors | Objectives | Policy Elements | Contributions | Limitations | ||||||||
|---|---|---|---|---|---|---|---|---|---|---|---|---|
| [41][ | Investment in new technologies | ICT-related efficiency improvements are not sufficient to stabilize freight demand, and other demand-side management policies are required | The SD diagrams were not presented. There is no discussion about time responses or other dynamics of policy implementation and their effects | |||||||||
| To model the economic, transport, environmental, and policy aspects that describe a path toward a sustainable transport system and its economic impacts | Higher transport prices (taxes); investment in alternative modes; investment in energy efficiency and alternative fuels | 44 | The growth of freight transport tends to be absorbed by rail and ship transport, since these modes are attractive enough | ] | To evaluate the impacts of longer and heavier vehicles on emissions and show the effect of road pricing in the market share of these vehicles compared to rail | Internalization of transport external costs; allowance of heavier trucksThe high aggregation level and the absence of the model feedback loops and related dynamics make it challenging to analyze the considered assumptions | Increased truck sizes and high road user charges can only limit truck traffic growth for a specific time. The negative impacts in the medium term are much stronger than the initial positive effects | It was not analyzed how different types of companies react to the internalization of external costs and how they decide to use railway or heavier trucks | [45][20] | |||
| [49][ | To examine the dynamic relationship between the consumption of goods and services, technological efficiency, and associated resource use | 30 | ||||||||||
| [31,32 | Investment in technological efficiency | ] | ][45][46To assess the CO2 emissions from an intercity freight transport considering the modal share, the freight volume, fuel price, and fuel intensityThe fleet efficiency induces travel consumption and more CO2 emissions. Higher fleet efficiency requires costlier travel and a reduction in travel consumption | It highlighted the need to implement a system of interventions; however, no details were described regarding the dynamics for such implementations | ||||||||
| Extension of the railway and waterway network and imposition of fuel taxes | ] | Policies simulated are very significant for CO | 2 emissions mitigation | To model the interdependencies between logistics strategies and transportation with the goal of higher utilization of trucks and modal shift to railDynamics of changes in the system were not provided, compromising the interactions between policies, mode choice, and emissions mitigation discussion | Growth of transport costs through internalization, leading to more pressure to consolidate freight | The model concentrates on operative parameters, such as order cycle frequency, amount per order cycle, and shipment amounts | The factors for the successful diffusion of CO2Inventory costs were disregarded, although this could lead to different results | -saving technologies were discussed from a stakeholder perspective | The framework was not quantified, applied, and validated | [56][21] | ||
| [40][ | To generate a holistic understanding of the potential to reduce freight transport demand | 31Application of higher transport taxes | Identifying the reinforcement loop, since economies of scale lead to more freight demand, and the balancing loop, as higher taxes discourage the freight demand increase | The model requires further discussion, as well as validation and application | ||||||||
| ] | To analyze the causal relationships influencing the modal shift from road to coastal shipping | Investment in infrastructure capacities and governmental pressure to reduce CO2 emissions | ||||||||||
| [65 | Results show that the inertia for the modal shift is long | ][47] | To simulate CO2 emissions for inbound and outbound logistics in an automotive assembly line | It was not evidenced how the pressure to reduce CO2 emissions and to shift modes were quantified. Other factors were not considered by the model, such as pricing policies, tax incentives, and subsidies to shift modes | Shipment consolidation | Unlike the majority of SD models, this study addressed operational activities at a company level | How the policy will be implemented and time response of its effects were not presented | |||||
| [70][54] | To forecast the market penetration of alternative powertrain technologies to the heavy commercial vehicles market | Investment in refueling stations and R&D for alternative powertrains. Costs of adoption and ownership are taken into account | The model is helpful to study some market dynamics and highlight the sensitive factors of the market diffusion process | [74,75][22][23] | To discuss the behavioral patterns and interdependencies of relevant stakeholders in the freight transport market at an urban level | Not considered | ||||||
| [57,58][32 | The focus was on the decision processes and behavior of the freight demand and the freight transport demand, which affects freight traffic and the environment at an urban level | ][33 | The model presents the effects of consumption patterns over freight transport demand but does not provide any policy instruments to manage or mitigate it | |||||||||
| ] | To explore the strategies for greenhouse gas (GHG) emission reductions, with a specific focus on the mode switch from road to rail | Increasing the fuel price, electricity price, carbon tax; investment in rail infrastructure; fleet efficiency | Existence of different decision-making behaviors to adopt innovations, depending on the type and size of companies | The congestion and capacity constraints were not considered, as well as the assumptions related to time responses | ||||||||
| [59][48] | To evaluate the effects of alternative truck weight regulation policies on the sustainability of a highway freight system | Alternative weight regulation policies | Social costs, such as pavement maintenance, traffic accidents, and emissions, are simulated, evidencing the sustainability of different weight regulations | [30][24] | To model the effects of fuel price on intercity road traffic volume | Increase in fuel prices | The fuel price increase is not sufficient to reduce the transport demand due to population increase, positive economic growth, and investment in road infrastructure | |||||
| [ | The dynamics of the market response, that is, the time lag that it would take between price increase and demand reduction, was not evidenced | |||||||||||
| The model considers only a single freight and truck type while neglecting the storage process. Delays were simplified, as the pavement maintenance was assumed to occur within the model time step | 77][34] | To investigate the infrastructure implications of a green economy transition for modal shift from road to rail | Increasing investments in the rail network | The benefits obtained include the reduction in trucks using the road network, better pavement conditions, and road safety. Such a transition would require significant investment in the rail track | It was not discussed how the modal shift would be implemented by companies over time | |||||||
| [73][49] | To analyze the carbon emission abatement required for the truck freight sector while investigating the uncertainty in demand and technology developments | Not considered | It simulates the total emission reduction target, and the result is the percentage of reduction needed in the transport sector. Policies are recommended but not simulated | Despite freight volume and carbon emissions target changing dynamically, the discussion about how this change occurs over time was not provided | [50][25] | Relates to the total CO2 emissions generated through urban freight volume powered by e-commerce growth | Carbon tax internalization | Development of feedback loops with general assumptions about freight transport demand variations | The model was not simulated or validated. Time-lag decisions and response delays were not considered | |||
| [33][35] | To propose an SD model for emission analysis of intercity highways, including both passenger and freight transport | Increasing fuel price, promoting alternative modes, such as railway, and educating drivers to plan their routes and schedules | ||||||||||
| [63][ | The results showed a reduction in total CO | 2 | emissions with the policy’s implementation | The model does not show the feedback loops. There is no mention of time lags regarding mode choice changes, or the adoption of intelligent systems for route planning, compromising policy evaluations | 50] | To explore the sustainability potential of last-mile logistics and distribution strategies, employing different delivery alternatives | Investments in digital applications for track and trace and to outsource the pickup to consumers | The crowd logistics concept (in which the logistics service provider decides where to pick up the parcel or whether to outsource the pickup to individuals) is the better solution | Significant factors were not applied, such as carbon taxation, inventory management, and economic parameters | [79][26] | Determines the causal relationship between road transport and social economy, population, passenger transport, freight turnover, and energy demand | Not considered |
| [39][36] | Predictions of the freight transport demand and CO | 2 | emissions simulating high and low levels of oil and gas resource and technology, oil price, and economic growth | Develop an SD model to examine the impact of policies of modal shift from road to rail | Increasing road cost or taxation and containerization | Results confirmed that the modal shift by containerization occurred more rapidly than by all kinds of road taxationThe model does not apply any decarbonization strategy, despite simulating the impact of transport demand increase over emissions | ||||||
| [[54][27] | Understanding of the relationship between product prices, fuel, number of vessels, freight, and weight value ratio | Product prices and logistic costs variation | This study shows that the cost of logistics has a significant impact on the demand for products with price elasticity greater than one | The model does not consider the dynamics of relevant policies, such as logistics collaborations, partnerships, and vertical integration |
| Warehousing and information costs of transshipment were excluded. Dynamics were not analyzed | ||||
| 48 | ||||
| ] | ||||
| [ | ||||
| 51 | ||||
| ] | ||||
| To analyze the freight flows in a distribution chain based on inventory and transport costs and the evolution of the customer order | Internalization of CO | 2 emissions tax; different levels of truck capacity utilization | Logistic decisions are taken at the supply chain level, as the loading vehicles’ rate, their loading capacity, their order cycle frequency decisions are generally taken lightly in the companies, whereas they influence the distribution costs, transport demand, fuel consumption, and emissions | The model disregarded relevant market parameters, such as financial aspects, marketing strategies to make the business greener, and others |
| [42][37] | To analyze the quantitative relationship between the mode shift from road to rail and the sustainability of urban logistics | Investment in railway infrastructure construction | The high-density development of the rail network will achieve the best indicators of performance (average speed, congestion loss, delivery travel time, and emissions) | Lack of detailed analysis of the network construction time, the secondary benefits, such as land appreciation and road safety, as well as the cost–benefit analysis for the construction of the rail network |
| [60,61, |
Different assumptions can be identified by analyzing the SD diagrams of the models, their variables, feedback loops, and stock and flow structures. In Ref. [41][44], the authors evaluated the impacts of longer, heavier vehicles (LHVs) on emissions. For the market entry of LHVs, adaptation processes in logistic sectors have to take place. An unavoidable delay between legal permission and full market penetration occurs. This delay is longer for railways, since more complex logistics processes must be refined. The results show that depending on the rail freight demand and costs by transport unit, the modal shift may take place from rail to road, undermining CO2 reduction gains. However, the discussed delays for the logistics adaptation process were not estimated.
In Refs. [31,32][45][46], the authors modeled logistics strategies toward more efficient transport operations and higher utilization of trucks. The shipment amount is influenced by the operating logistics concept (i.e., just in time), which affects the order cycle frequency and the amount per order cycle. Small shipment amount means a low utilization of trucks, which influences the transport distances traveled, the fuel consumption, emissions, transportation costs, and the pressure to consolidate. If consolidation pressure increases, the shipment amount also increases, which takes time, as companies have to identify consolidation potential. This response time has to be further explored.
CO2 emissions for inbound and outbound logistics based on shipment consolidation technique in an automotive assembly line were simulated by Ref. [65][47]. CO2 emissions were calculated based on the total number of trips made by inbound and outbound transport vehicles and the type of fuel used. However, the shipment consolidation policy and the assumptions about how it should be implemented (i.e., increasing load factor and vehicle capacity) were not presented.
The effects of alternative truck weight regulation policies on the sustainability of a highway freight system, considering economic and social costs including pavement maintenance, traffic accidents, and emissions, were evaluated by Ref. [59][48]. Three levels of weight regulation policies were considered. The best policy varies according to the importance of social costs. The model presents neither the SD diagrams nor the equations, delays, or time lags between policy implementation and results.
In Ref. [73][49], the author considered that an increase in the truck–freight demand increases emissions, which are estimated based on the total transportation volume of each truck type (light, medium, and heavy) and the carbon density over the traveled distance. The freight volume and carbon emissions target are time dependent, but the discussion about how the change occurs over time was not provided. The results suggested increasing the use of medium and heavy trucks. Further exploration of whether large or heavy trucks can replace light trucks is necessary.
In Ref. [63][50], the authors explored the sustainability of last-mile logistics with different distribution strategies. The centralized distribution case is profitable due to increased demand, while the operational and environmental costs increase. In the home delivery case, the emissions will be more significant, given a substantial increase in customers, increased transport distances, and a higher truck emission rate. The distributed network system considered crowd logistics operations relying on a sharing economy model, in which pollution will not increase sharply compared to previous options. The time that companies take to change their distribution strategies should be further explored.
In Ref. [48][51], the authors analyzed freight flows in a distribution chain based on inventory and transport costs. The logistic decisions are taken at the supply chain level, as the choice of loading vehicle rates and order cycle frequency is generally taken lightly by the companies, whereas they influence distribution costs, transport demand, fuel consumption, and emissions. Low truck utilization involves a high number of shipments, which increases road use, reduces average speed, and increases the lead time and transport costs, impacting customer satisfaction, demand, and the order quantity per year.
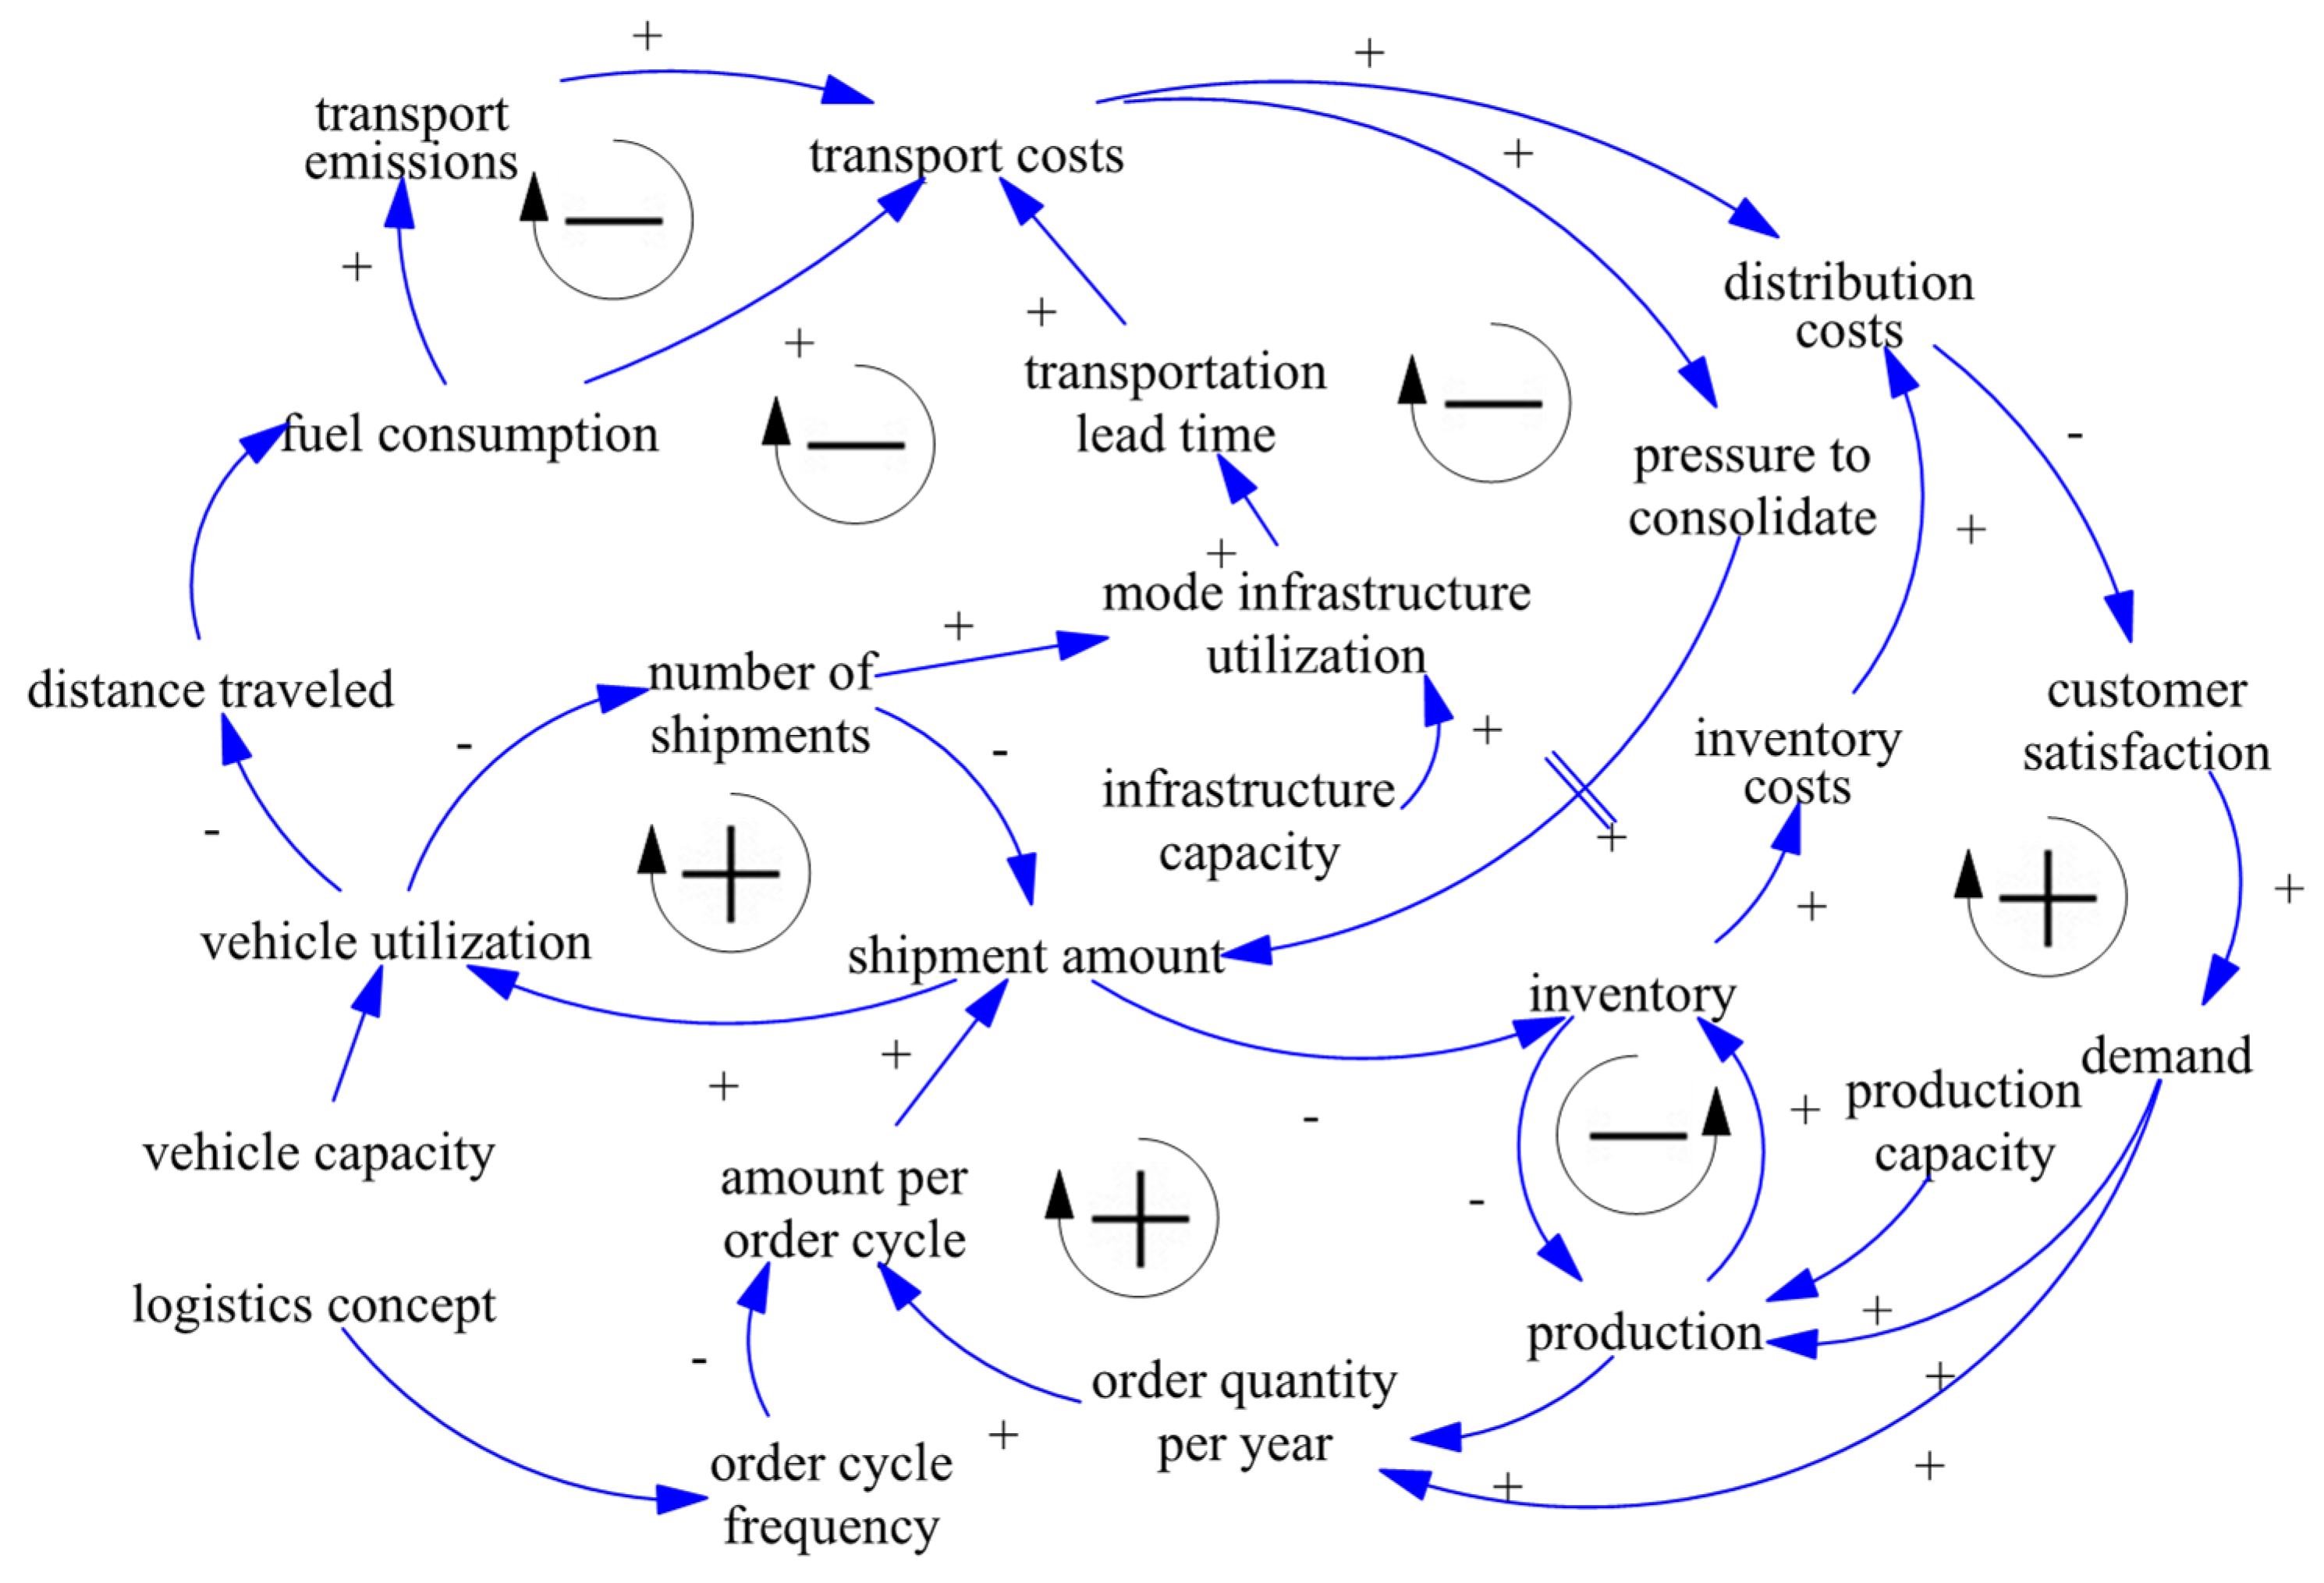
Figure 53 presents the usual variables and feedback loops that rule the dynamic relationships in the models related to the improvement of asset utilization. The logistics concept of the supply chain dictating the order cycle frequency and amount per order cycle, the distribution costs impacting customer satisfaction and demand, and the pressure to consolidate are some of the key variables forming the feedback loops. Fuel consumption and emissions are influenced by distance traveled, which depends on vehicle utilization.
Regarding the quantitative phase of the SD models, the authors in Refs. [32,63][46][50] presented the model equations in detail, and in Refs. [59[48][49],73], the authors presented some main equations, while the other studies did not provide them, showing a lack of transparency. Integration techniques or time steps used were not revealed. The only delay reported (but not quantified) was between the pressure to consolidate and the shipment amount. In contrast, uncertainties may exist related, for example, to customer satisfaction and the influence of emissions on transport costs, which requires the internalization of external cost processes. Such dynamic aspects should be further investigated.
Analyzing the SD diagrams of the models related to increasing energy efficiency and their variables, feedback loops, and stock and flow structures, wresearchers can identify different assumptions made to model the system under study. In Ref. [55][52], the authors simulated the diffusion of alternative fuels and drives within the truck market. There is a common link between the cost of trucks and their adoption, influencing the manufacturing costs via economies of scale. Investing in new technology is driven by economic forces considering the investment, maintenance, fuel, toll, taxes, and refueling costs.
In Ref. [69][53], the authors also analyzed the diffusion of technologies reducing CO2 emissions in heavy commercial vehicles. The study identified that customer preferences change with gaining market shares of innovative technologies. Therefore, the adoption decision impacts the organization by influencing the social network, supplier’s efforts, governmental regulation, and the energy supply system. The causal loop diagram presents delays between some variables, such as governmental regulation, station construction, and market share, although they are not adequately discussed in the study.
In Ref. [70][54], the authors modeled the penetration of alternative powertrain technologies to the heavy commercial vehicles market. The model presented some market dynamics and highlighted the sensitive factors of the diffusion process. However, there are several limitations due to missing dynamic empirical data.
In Ref. [46][55], the authors interrelated the regional ship emissions, economic growth, and sustainable ecosystem development. Although the causal loop descriptions do not characterize feedback loops, the model provides assumptions that determine its behavior, divided into five sub-systems: shipping, energy, environment, economic, and policy components. The results show that ship speed should be suitably reduced to achieve more significant economic and environmental benefits. The model’s limitations include a lack of proper validation and uncertainties in the variable equations and parameter values.
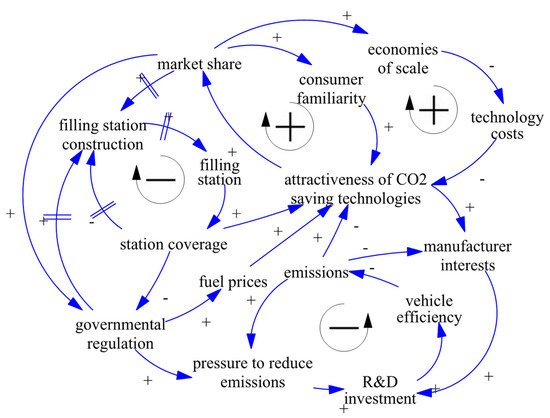
Figure 64 presents the common variables and feedback loops that rule the dynamic relationships in the models related to increasing energy efficiency. R&D investment, influenced by both manufacturer interests and pressure to reduce emissions, increases vehicle efficiency and reduces emissions. The attractiveness of CO2-saving technologies considers different factors, such as technology costs, consumer familiarity, refueling station coverage, and fuel prices.
 In the quantitative phase of the SD models, only Ref. [69][53] did not provide the equations, while the other studies provided some of them. Moreover, there is no information about integration techniques or time steps used. The diagrams represent some delays, although their estimations were not provided. Decisions related to the fleet renewal process and adoption of alternative technologies may take significant time to better investigate in future SD models.
5. Increasing Energy Efficiency
Increasing vehicle efficiency involves using cleaner and more efficient technologies, fleet renewal, and driving behavior/eco-driving, among other measures. An increase in the variety of technologies reducing CO2 emissions in heavy commercial vehicles is expected; however, this market implies multiple stakeholders, which considerably affects market dynamics. Table 64 summarizes the SD models’ objectives, policy elements, contributions, and limitations for increasing energy efficiency modeling.Table 64.
Contributions of SD models for increasing energy efficiency modeling.
| Authors | Objectives | Policy Elements | Contributions | Limitations |
|---|---|---|---|---|
| [55][52] | To simulate the diffusion of alternative fuels and show the potential of fuel efficiency technologies for conventional vehicles | Taxes on different technologies and emissions levels | Hydrogen is considered a promising technology for long-distance and regional traffic, while the light distribution traffic is predestined for electric drives | Other factors (technical attributes, range, recharging time, and refueling/recharging stations density) that influence market adoption of new technologies were not considered |
| [ | ||||
| The missing empirical data compromise the analysis of market diffusion | ||||
| [46][55] | To interrelate regional ship emissions, economic growth, and the development of a sustainable ecosystem | Speed reduction, use of shore electricity, engine improvement, and exhaust after-treatment technologies | The model provides assumptions that determine the model behavior. Ship speed should be optimized to achieve greater benefits | There is a lack of reasonable validation and uncertainties in the variable equations and parameter values |