Your browser does not fully support modern features. Please upgrade for a smoother experience.
Please note this is a comparison between Version 3 by Daniela Gheorghita and Version 2 by Dean Liu.
Nanomaterial toxicity tests using normal and cancer cells may yield markedly different results. Nanomaterial toxicity between cancer and primary human cells was compared to determine the basic cell line selection criteria for nanomaterial toxicity analyses.
- nanotoxicity
- nanomaterial
- cancer cells
- primary cells
1. Introduction
Nanotechnology has become a valuable and effective essential technology across several fields in recent years. Various nanomaterials, with sizes smaller than those of human cells, are widely used in cosmetics [1][2], sunscreens [3], food packaging [4], and pharmaceuticals [5]. However, their small size can make them toxic, posing risks to human health and safety [6][7][8].
As one of the most-produced nanoparticles (NPs) globally, silica NPs (SiNPs) are used in all aspects of life, including agriculture, food, and consumer goods [9]. In addition, the biocompatibility and stability of SiNPs make them promising candidates in various biomedical fields, such as gene carriers, drug delivery, and molecular imaging [10][11]. However, previous studies have reported on the toxic effects of SiNPs on essential organs such as the liver, lungs, brain, and kidneys [12][13]. Thus, extensive use has increased the risk of SiNPs exposure in humans.
Therefore, it is essential to investigate the safety of nanomaterials. Traditionally, toxicity studies using animals have been conducted to estimate the adverse effects of chemicals and nanomaterials on humans. However, many countries, particularly those in Europe, have recently begun regulating and limiting animal studies for ethical reasons; therefore, other test methods that estimate chemical or nanomaterial toxicity reliably are required [14]. Accordingly, human cell models that reduce unnecessary animal sacrifice and lower costs have been established. Presently, nanomaterial toxicity is being investigated using human cancer cells or immortalized cells [15][16]. Owing to their low cost, ease of handling, and excellent reproducibility, human cancer cells have considerable advantages in the rapid toxicity screening of nanomaterials or chemicals over other cells. However, unlike normal cells, cancer cells have unique characteristics, such as proliferating indefinitely due to excessive cell division from lack of cell cycle control and the apoptosis function [17]. In addition, cancer cells acquire energy by metabolizing glucose. The glycoprotein structure expressed on their membrane surface significantly differs from those on normal cells [18][19], resulting in studies raising concerns regarding the misjudgment of toxicity outcomes. Studies have associated nanomaterial toxicity with the cell lines used [20][21]. Therefore, results can be entirely different from those of normal cells when analyzing cell viability and the mechanism underlying the toxicity of nanomaterials using cancer cells [22].
2. Characterization of SiO2 NPs
For characterization of SiO2 NPs in deionized water, their morphology and size were investigated using electron microscopy. SiO2 NPs exhibit uniform spherical morphology and size distribution in SEM (Figure 1a) and TEM (Figure 1b) images. DLS (Figure 1c) and SMPS (Figure 1d) determined the hydrodynamic sizes of SiO2 NPs, which were 19.2 and 21.7 nm, respectively. Since NPs can have significant variations in size distribution in biological environments, researchers compared SiO2 NPs in deionized water and serum-free DMEM. Unexpectedly, z-average and polydispersity index are similar in the two dispersions (Figure 1e). In addition, the zeta-potential show negative charges in both conditions (Figure 1e). These results indicate that SiO2 NPs are monodispersed without aggregation.
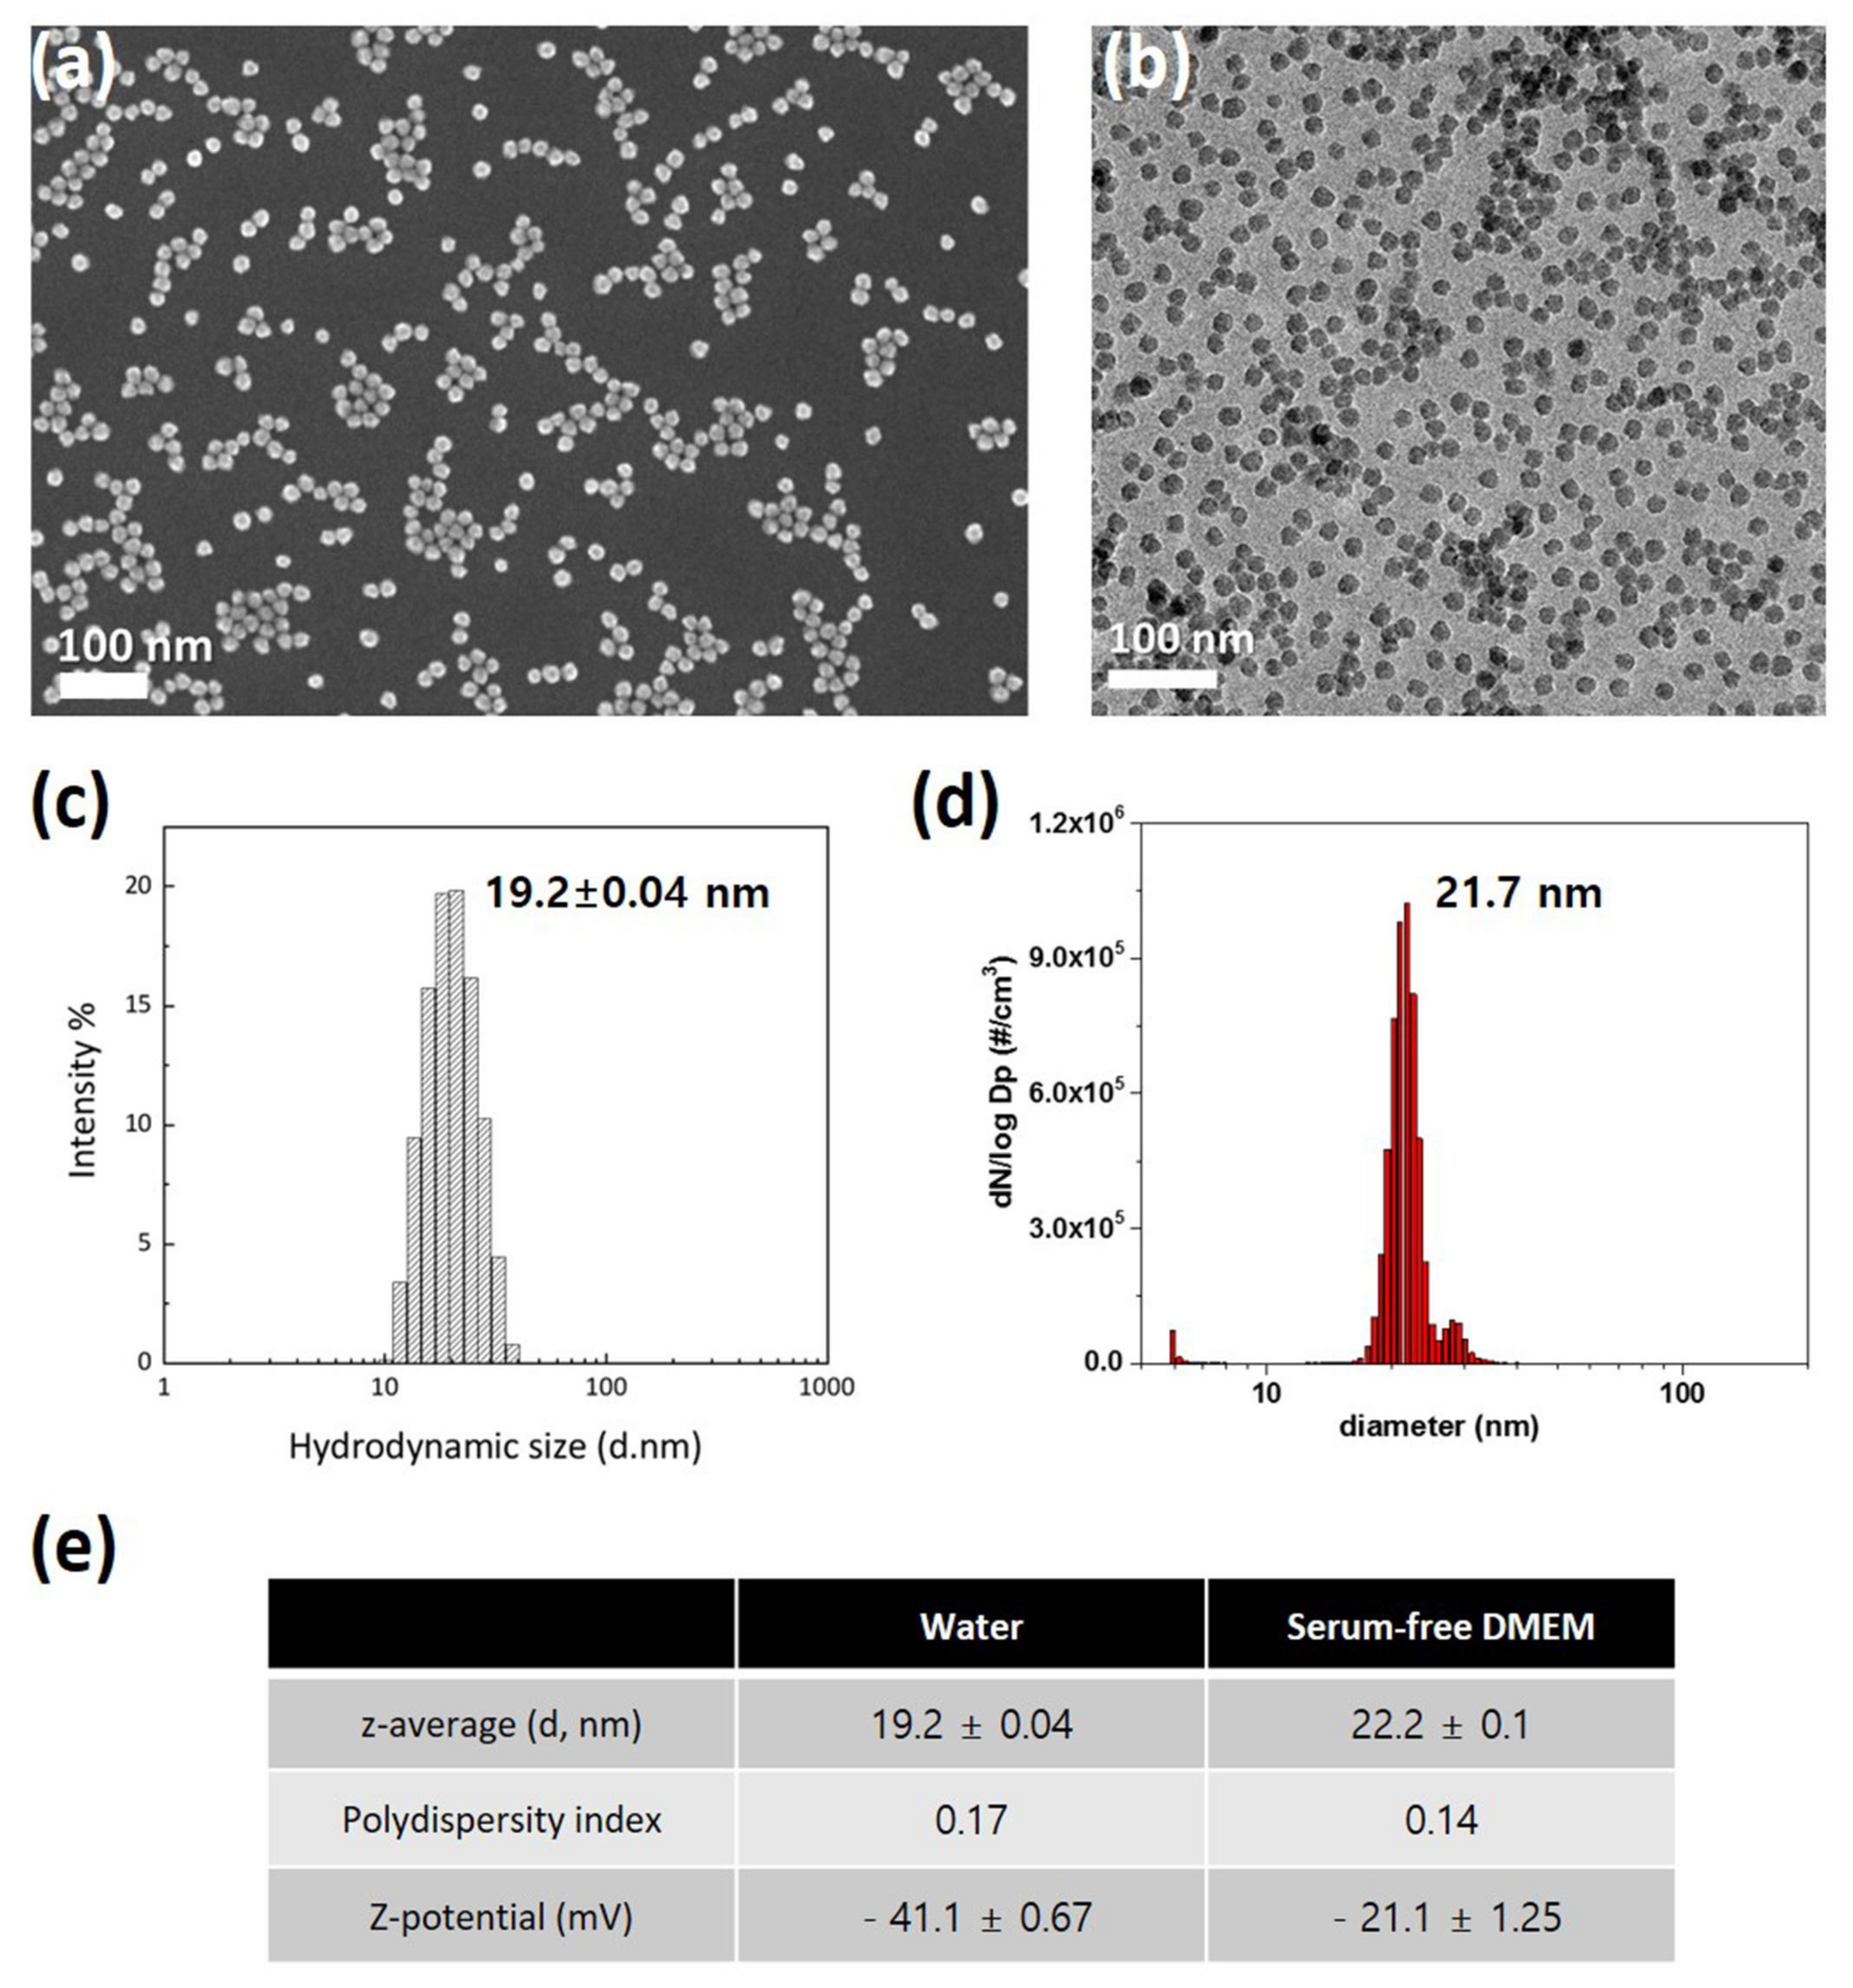
Figure 1. Characterization of 20 nm SiO2 NPs: (a) Scanning electron microscopy image; (b) Transmission electron microscopy image; (c) Dynamic light scattering size analysis; (d) Scanning mobility particle sizer analysis; (e) Performance comparison in deionized water and serum-free DMEM.
3. Cytotoxicity of SiO2 NPs
Researchers study compared SiO2 NPs toxicity between cancer (A549 and HepG2) and normal cell lines (NHBE and HH), MTS assay results revealed that the viability of all four cell lines significantly decreased depending on the concentration of SiO2 NPs in the cells (Figure 2). Notably, IC50 values of SiO2 NPs were almost similar between the lung-derived A549 and NHBE cells (Figure 2a), suggesting that there was no difference in toxicity caused by SiO2 NPs between the two cell lines. However, in the liver-derived cell lines, the IC50 values of SiO2 NPs in normal HH cells were approximately 1.5-fold higher than that in HepG2 cells, suggesting that the higher sensitivity of HH cells to SiO2 NPs was higher than that of HepG2 cells (Figure 2b).
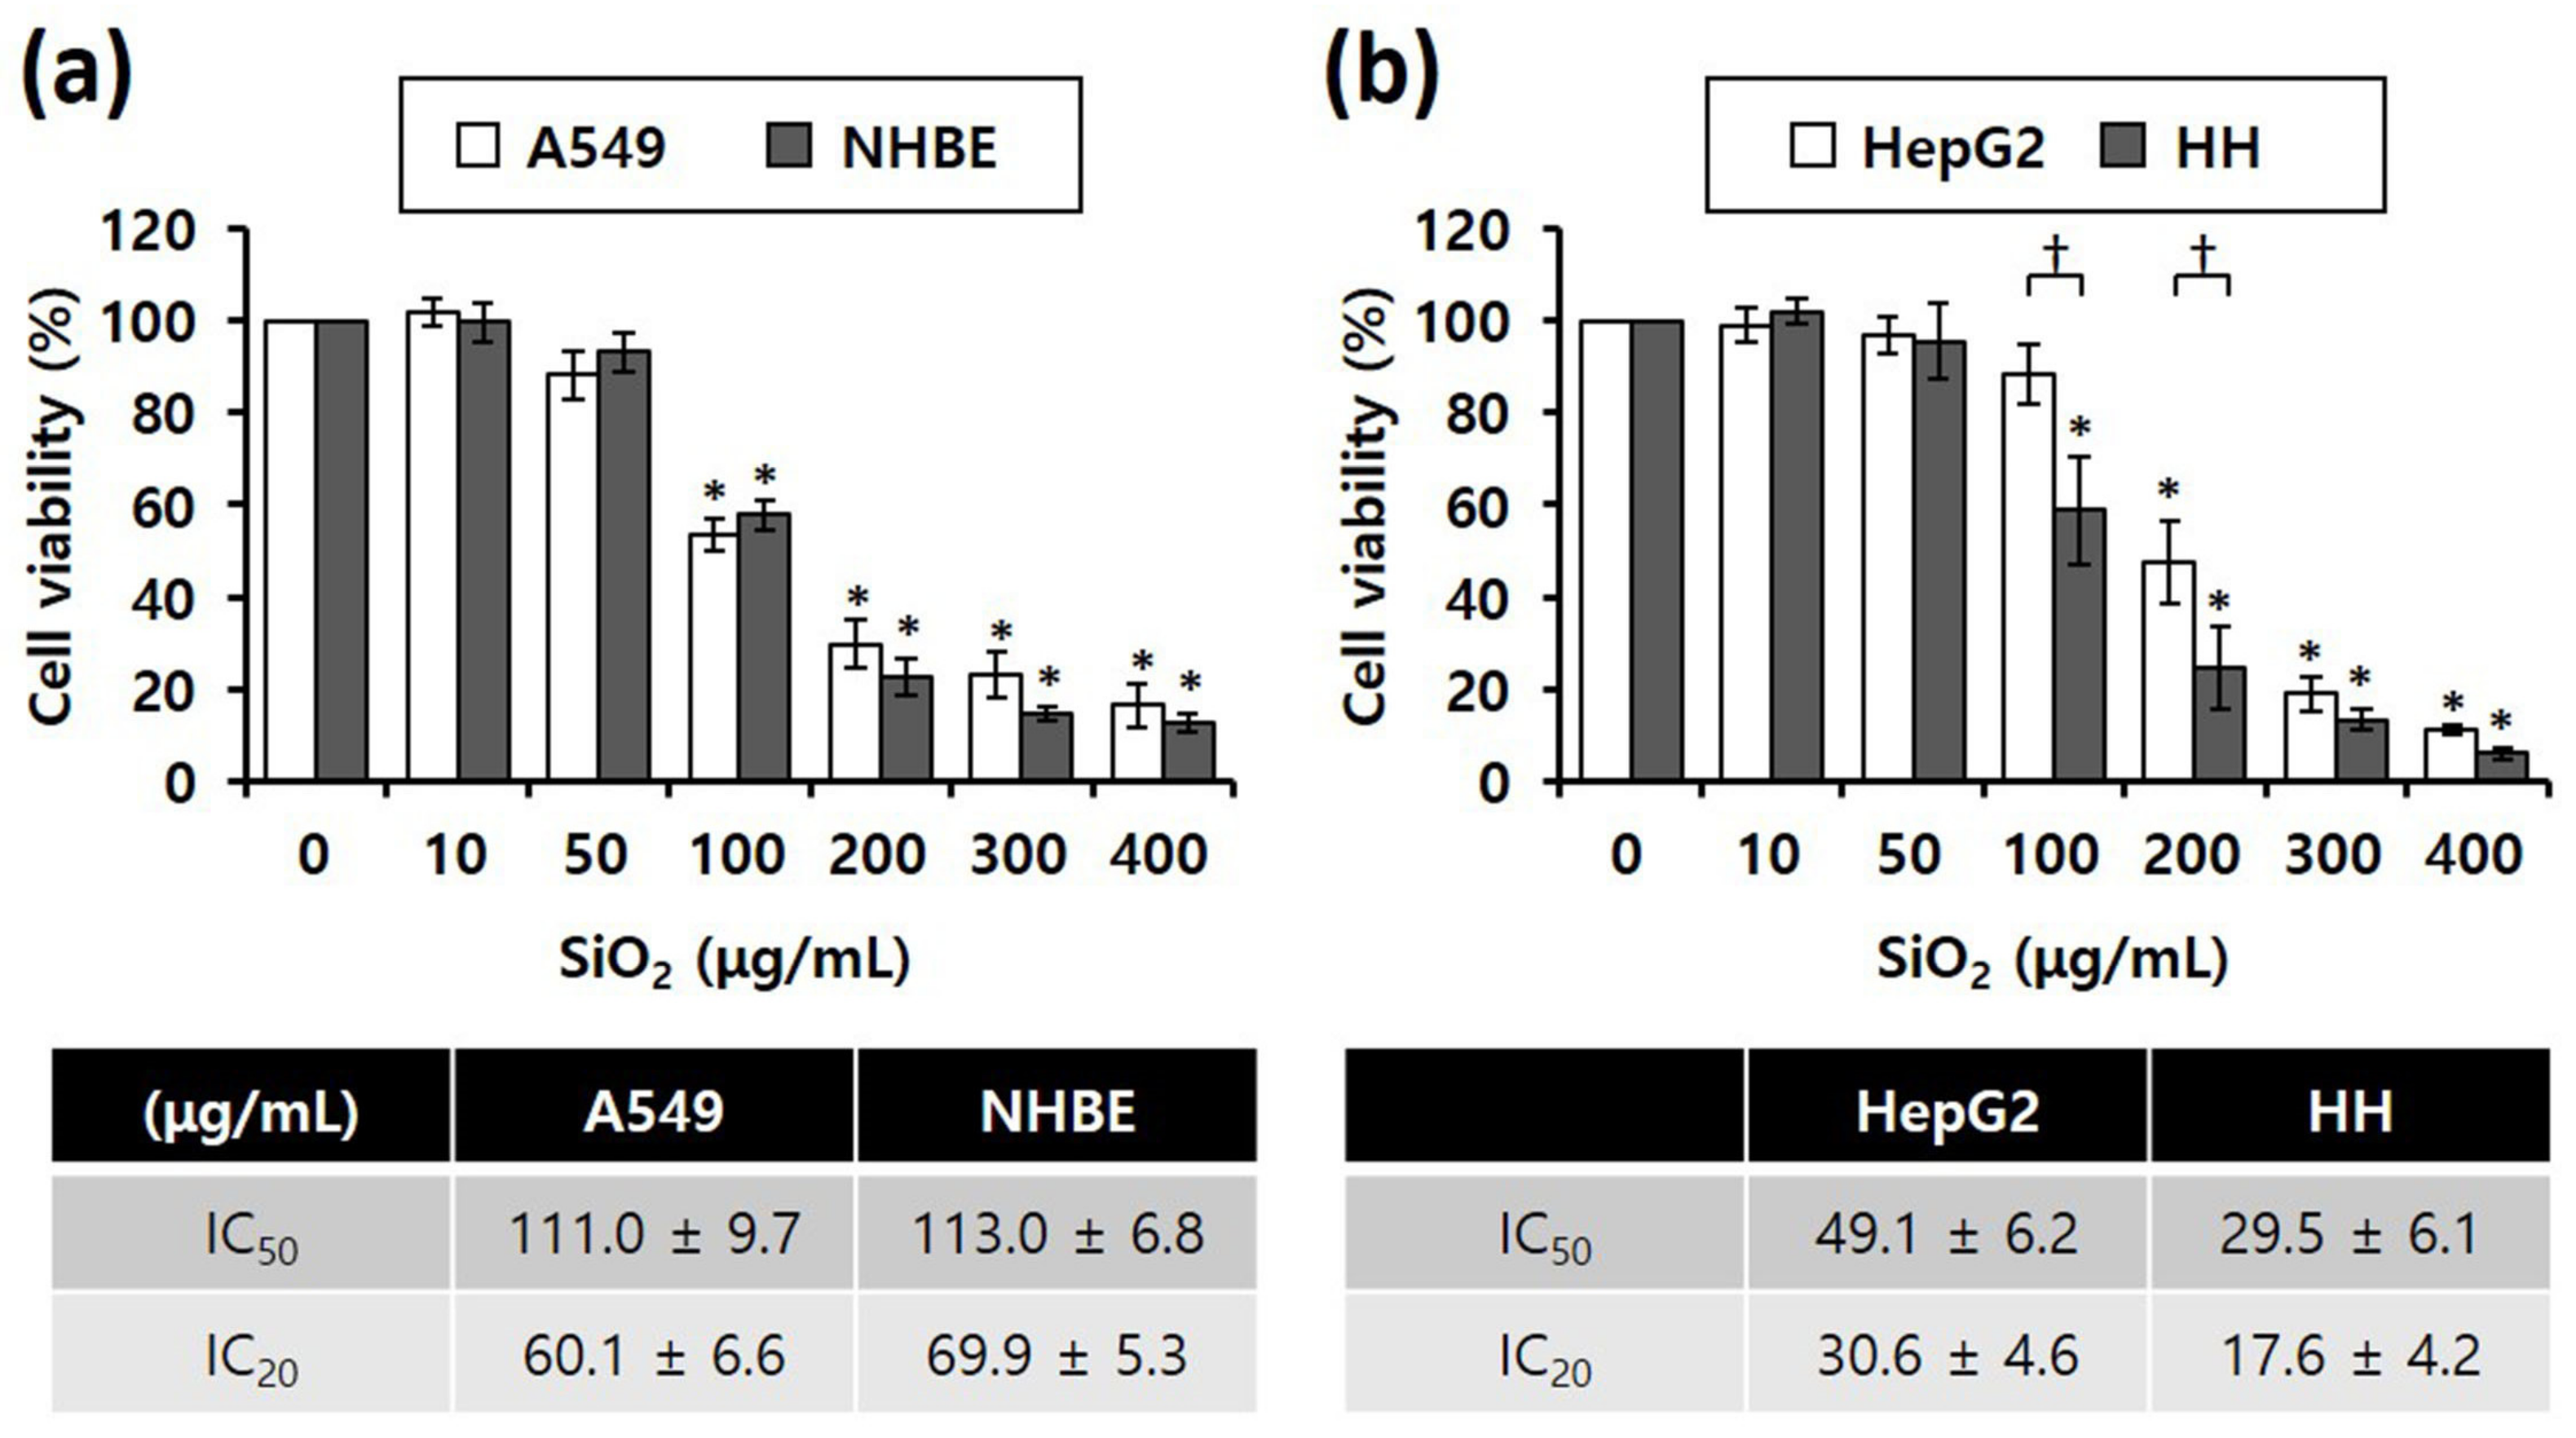
Figure 2. MTS cytotoxicity assay results showing the different inhibitory concentrations of 20 nm SiO2 NPs against cells subjected to NP treatment for 4 h (total number of replicates = 12); (a) Lung-derived cells. * p < 0.005, compared with untreated cells. (b) Liver-derived cells. * p < 0.005, compared with untreated cells; † p < 0.05, compared with HepG2 cells.
4. Cell Death Mode
Annexin V/PI staining was performed to determine differences in the mode of death caused by SiO2 NPs between cancer and normal cells. STS was used as a positive control for apoptosis, and CdSO4 for necrosis. In distinguishing the mode of cell death, Annexin V(+)/PI(−) cell populations were considered apoptotic, while Annexin V(−)/PI(+) or Annexin V(+)/PI(+) cell populations were considered necrotic. Fluorescence microscopy shows that the STS treatment increased green fluorescence intensity, while CdSO4 treatment increased green and red fluorescence intensities in the lung-derived cell lines, A549 and NHBE (Figure 3a,d). Green and red fluorescence intensities were also significantly increased by SiO2 NP treatment. Next, the mode of cell death was analyzed by sorting cells according to fluorescence using flow cytometry. STS primarily induced apoptosis, while CdSO4 and SiO2 NPs induced necrosis in A549 cells (Figure 3b,c). In NHBE cells, STS induced a mixture of apoptosis and necrosis, while CdSO4 primarily induced necrosis. SiO2 NPs induced necrosis in NHBE cells (Figure 3e,f). These results suggest that the mode of death induced by SiO2 NPs was similar in A549 and NHBE cells. Similar to the lung-derived cell lines, STS treatment increased green fluorescence intensity, while CdSO4 and SiO2 NPs increased green/red fluorescence intensity in HepG2 and HH cell lines (Figure 4a,d). Flow cytometry analysis revealed that STS induced both apoptosis and necrosis, while CdSO4 mostly induced necrosis (Figure 4b,c,e,f). In contrast, SiO2 NP treatment mostly induced necrosis in HepG2 cells and apoptosis and necrosis in HH cells (Figure 4b,c,e,f). These results suggest that the mode of death induced by SiO2 NPs in HepG2 and HH cells differ partially.
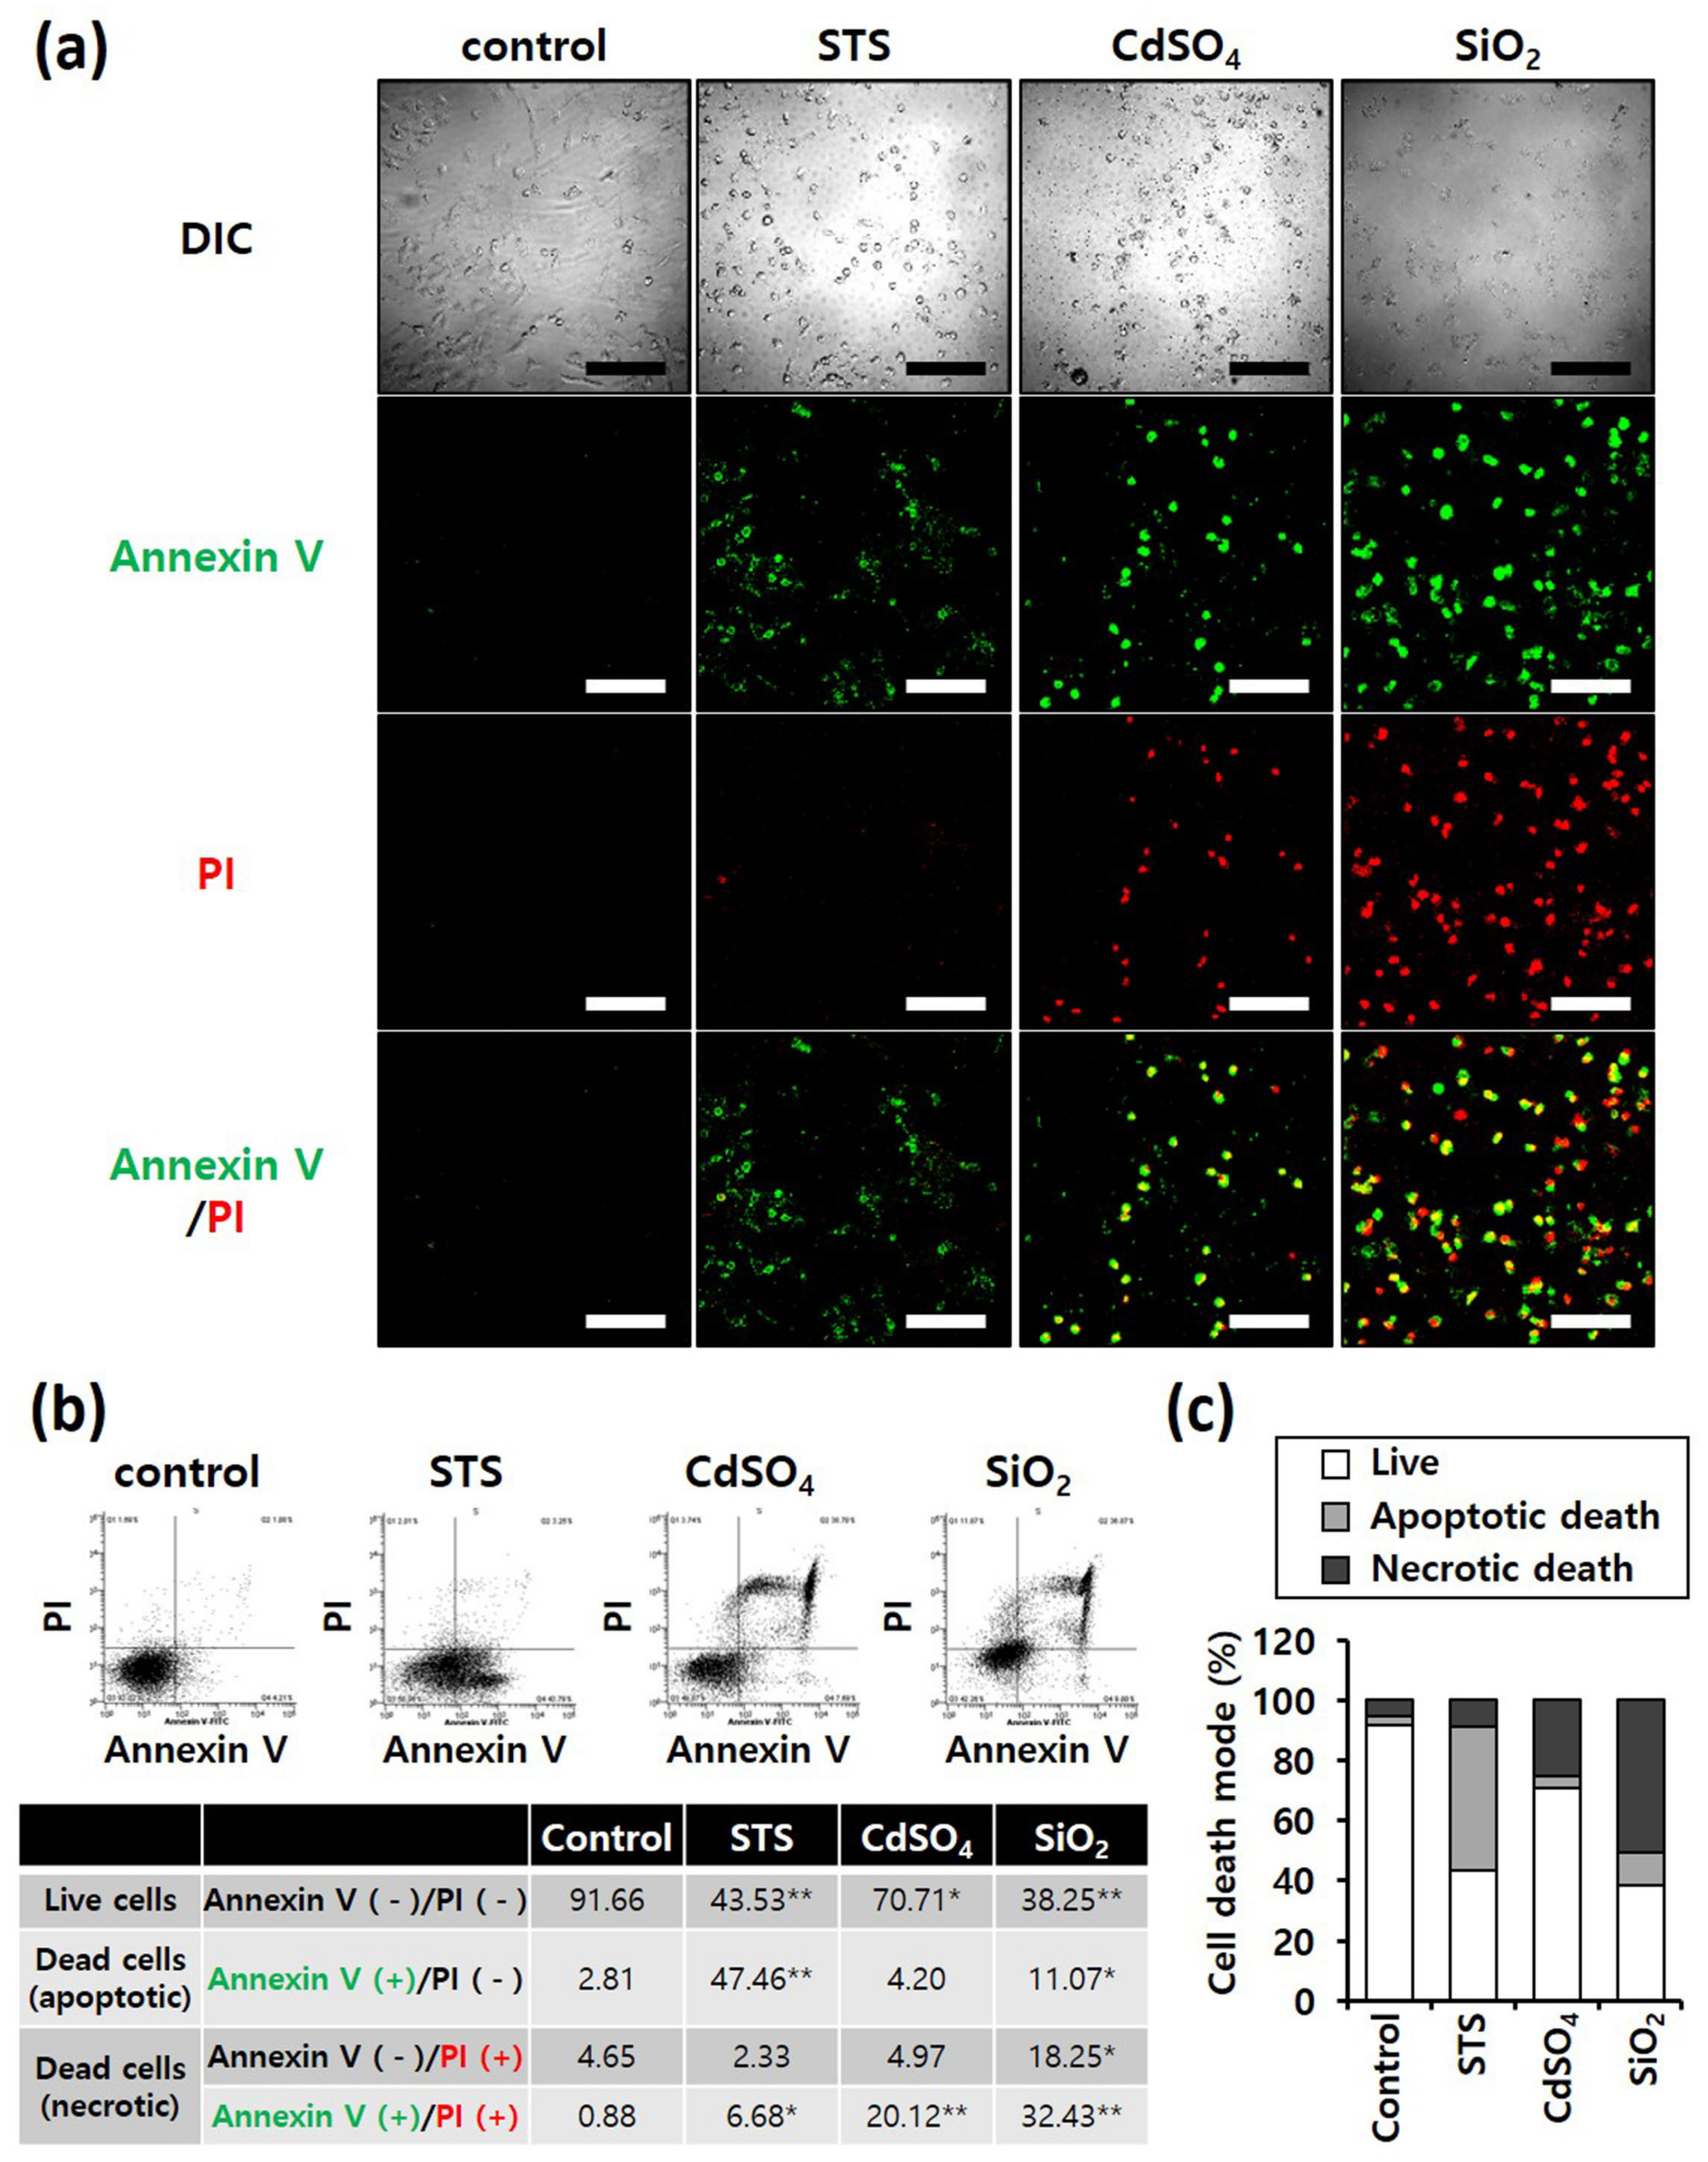
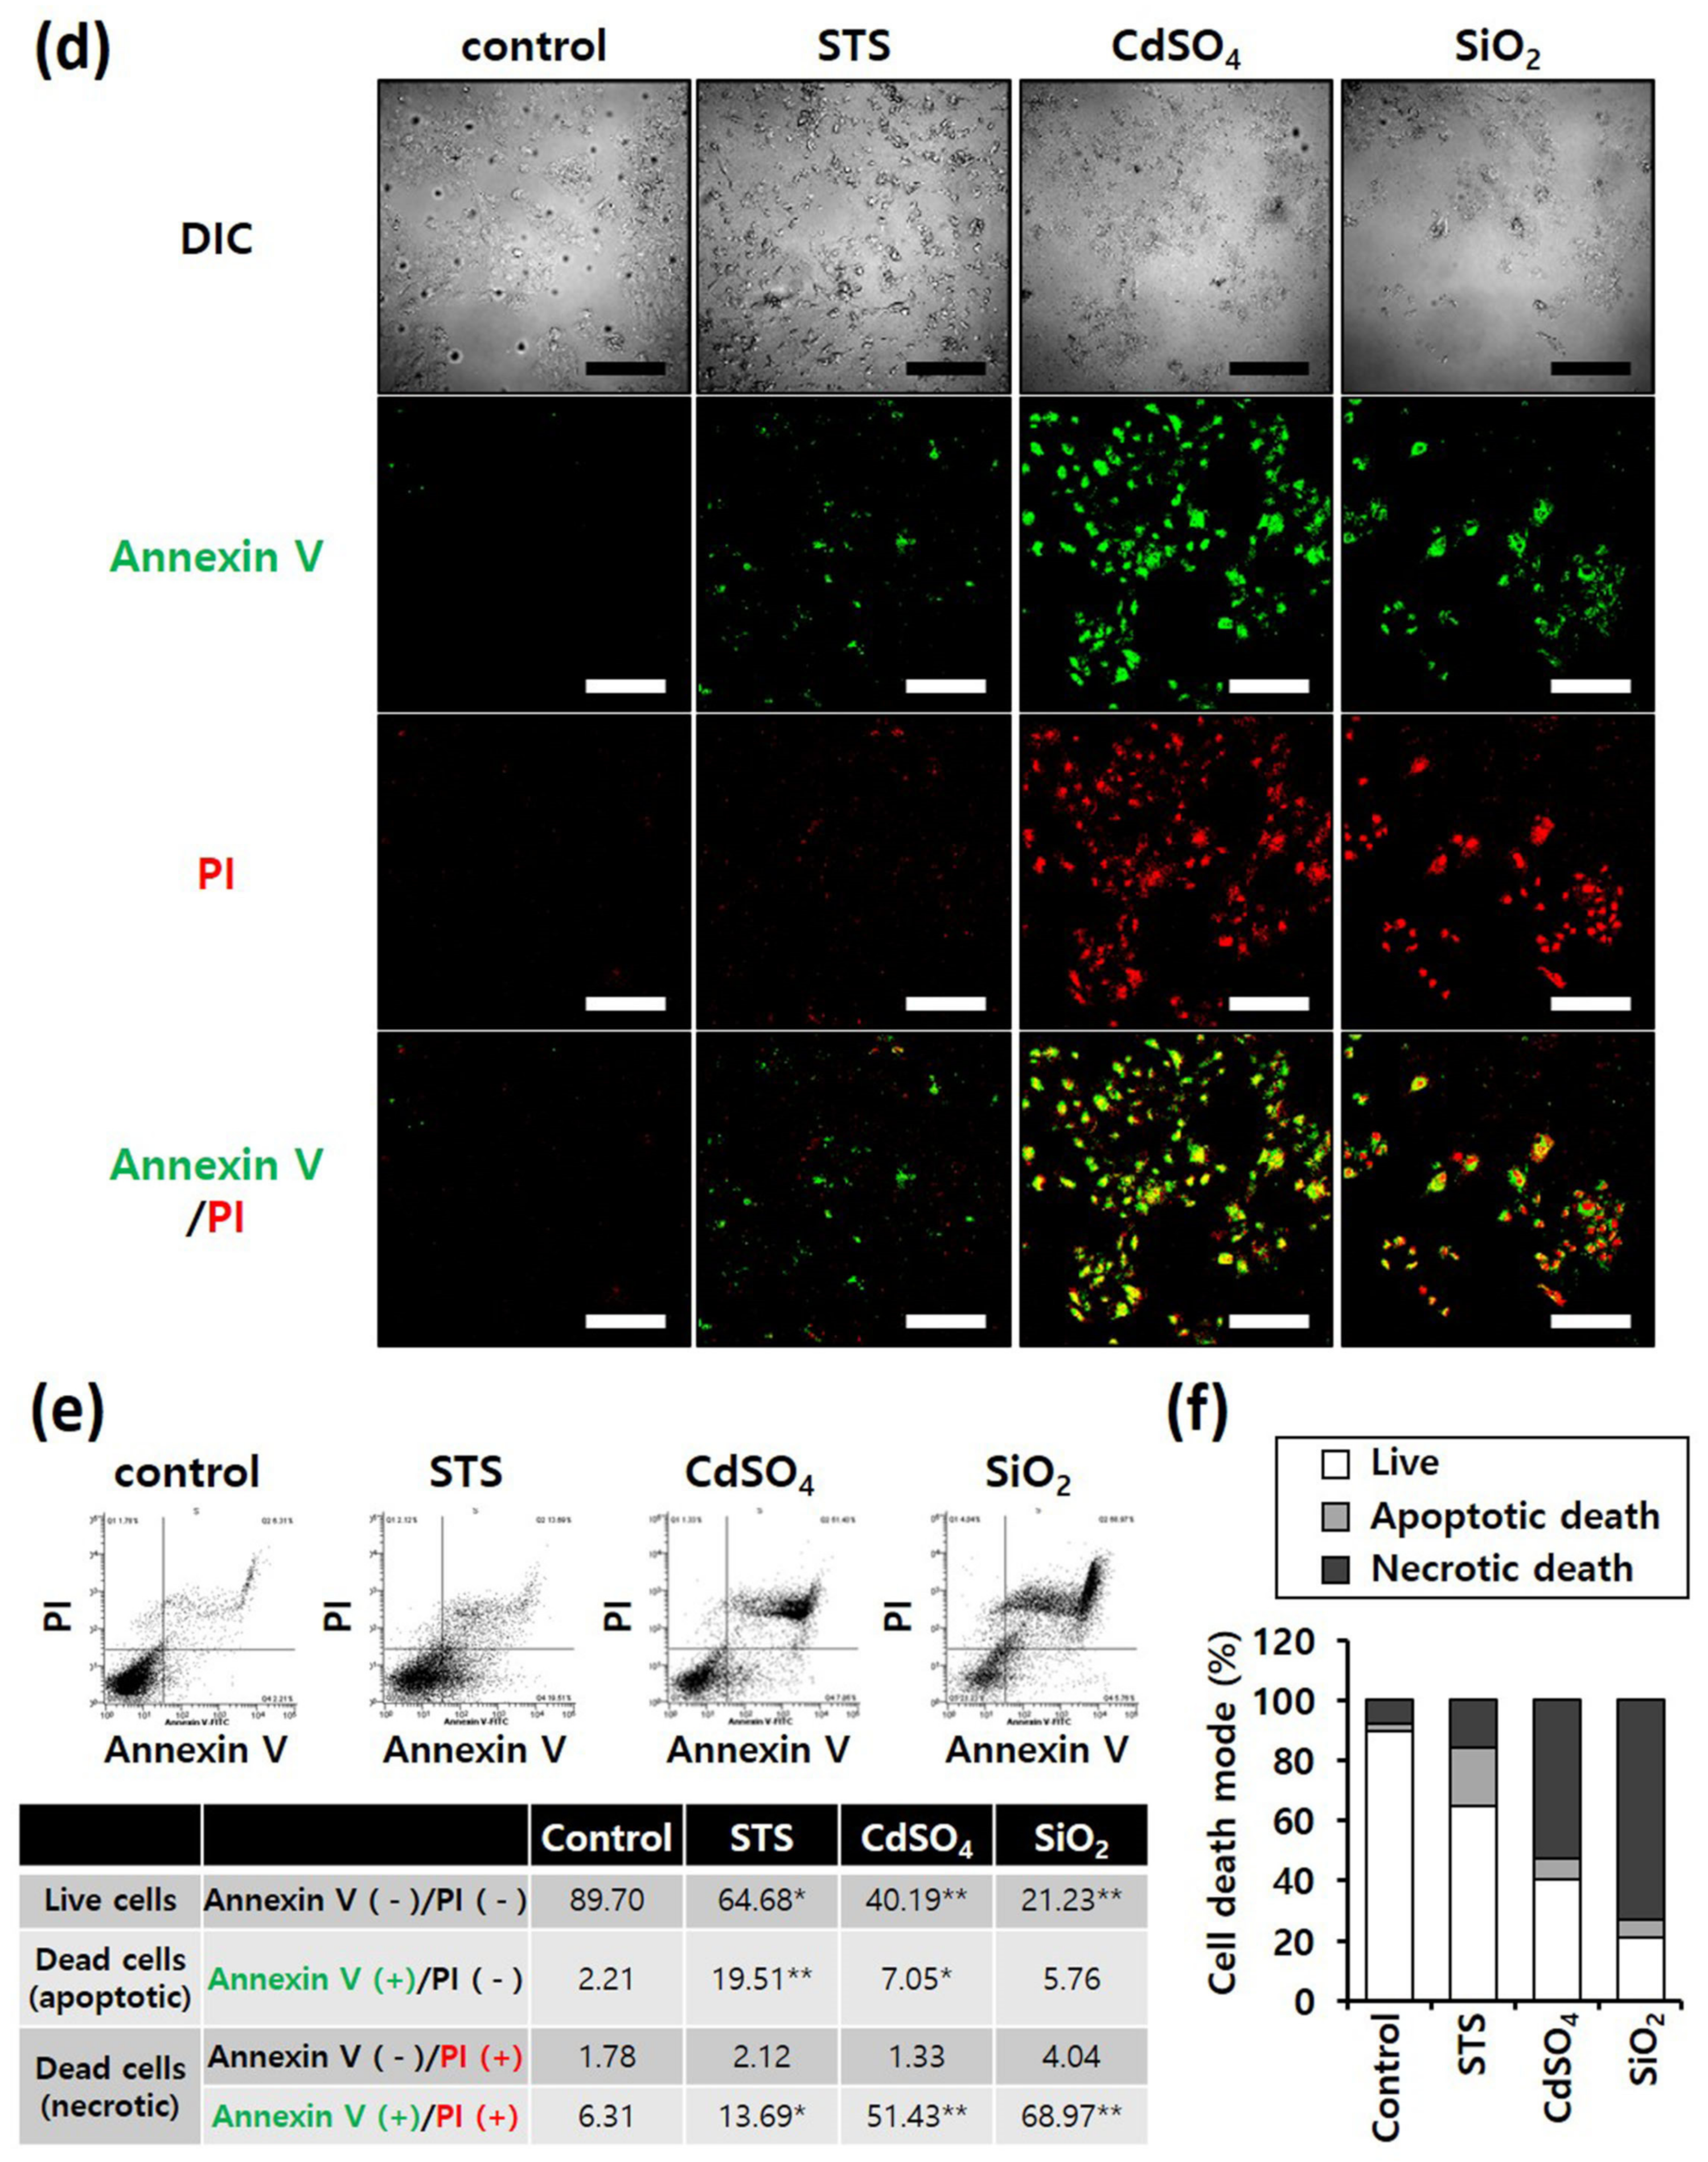
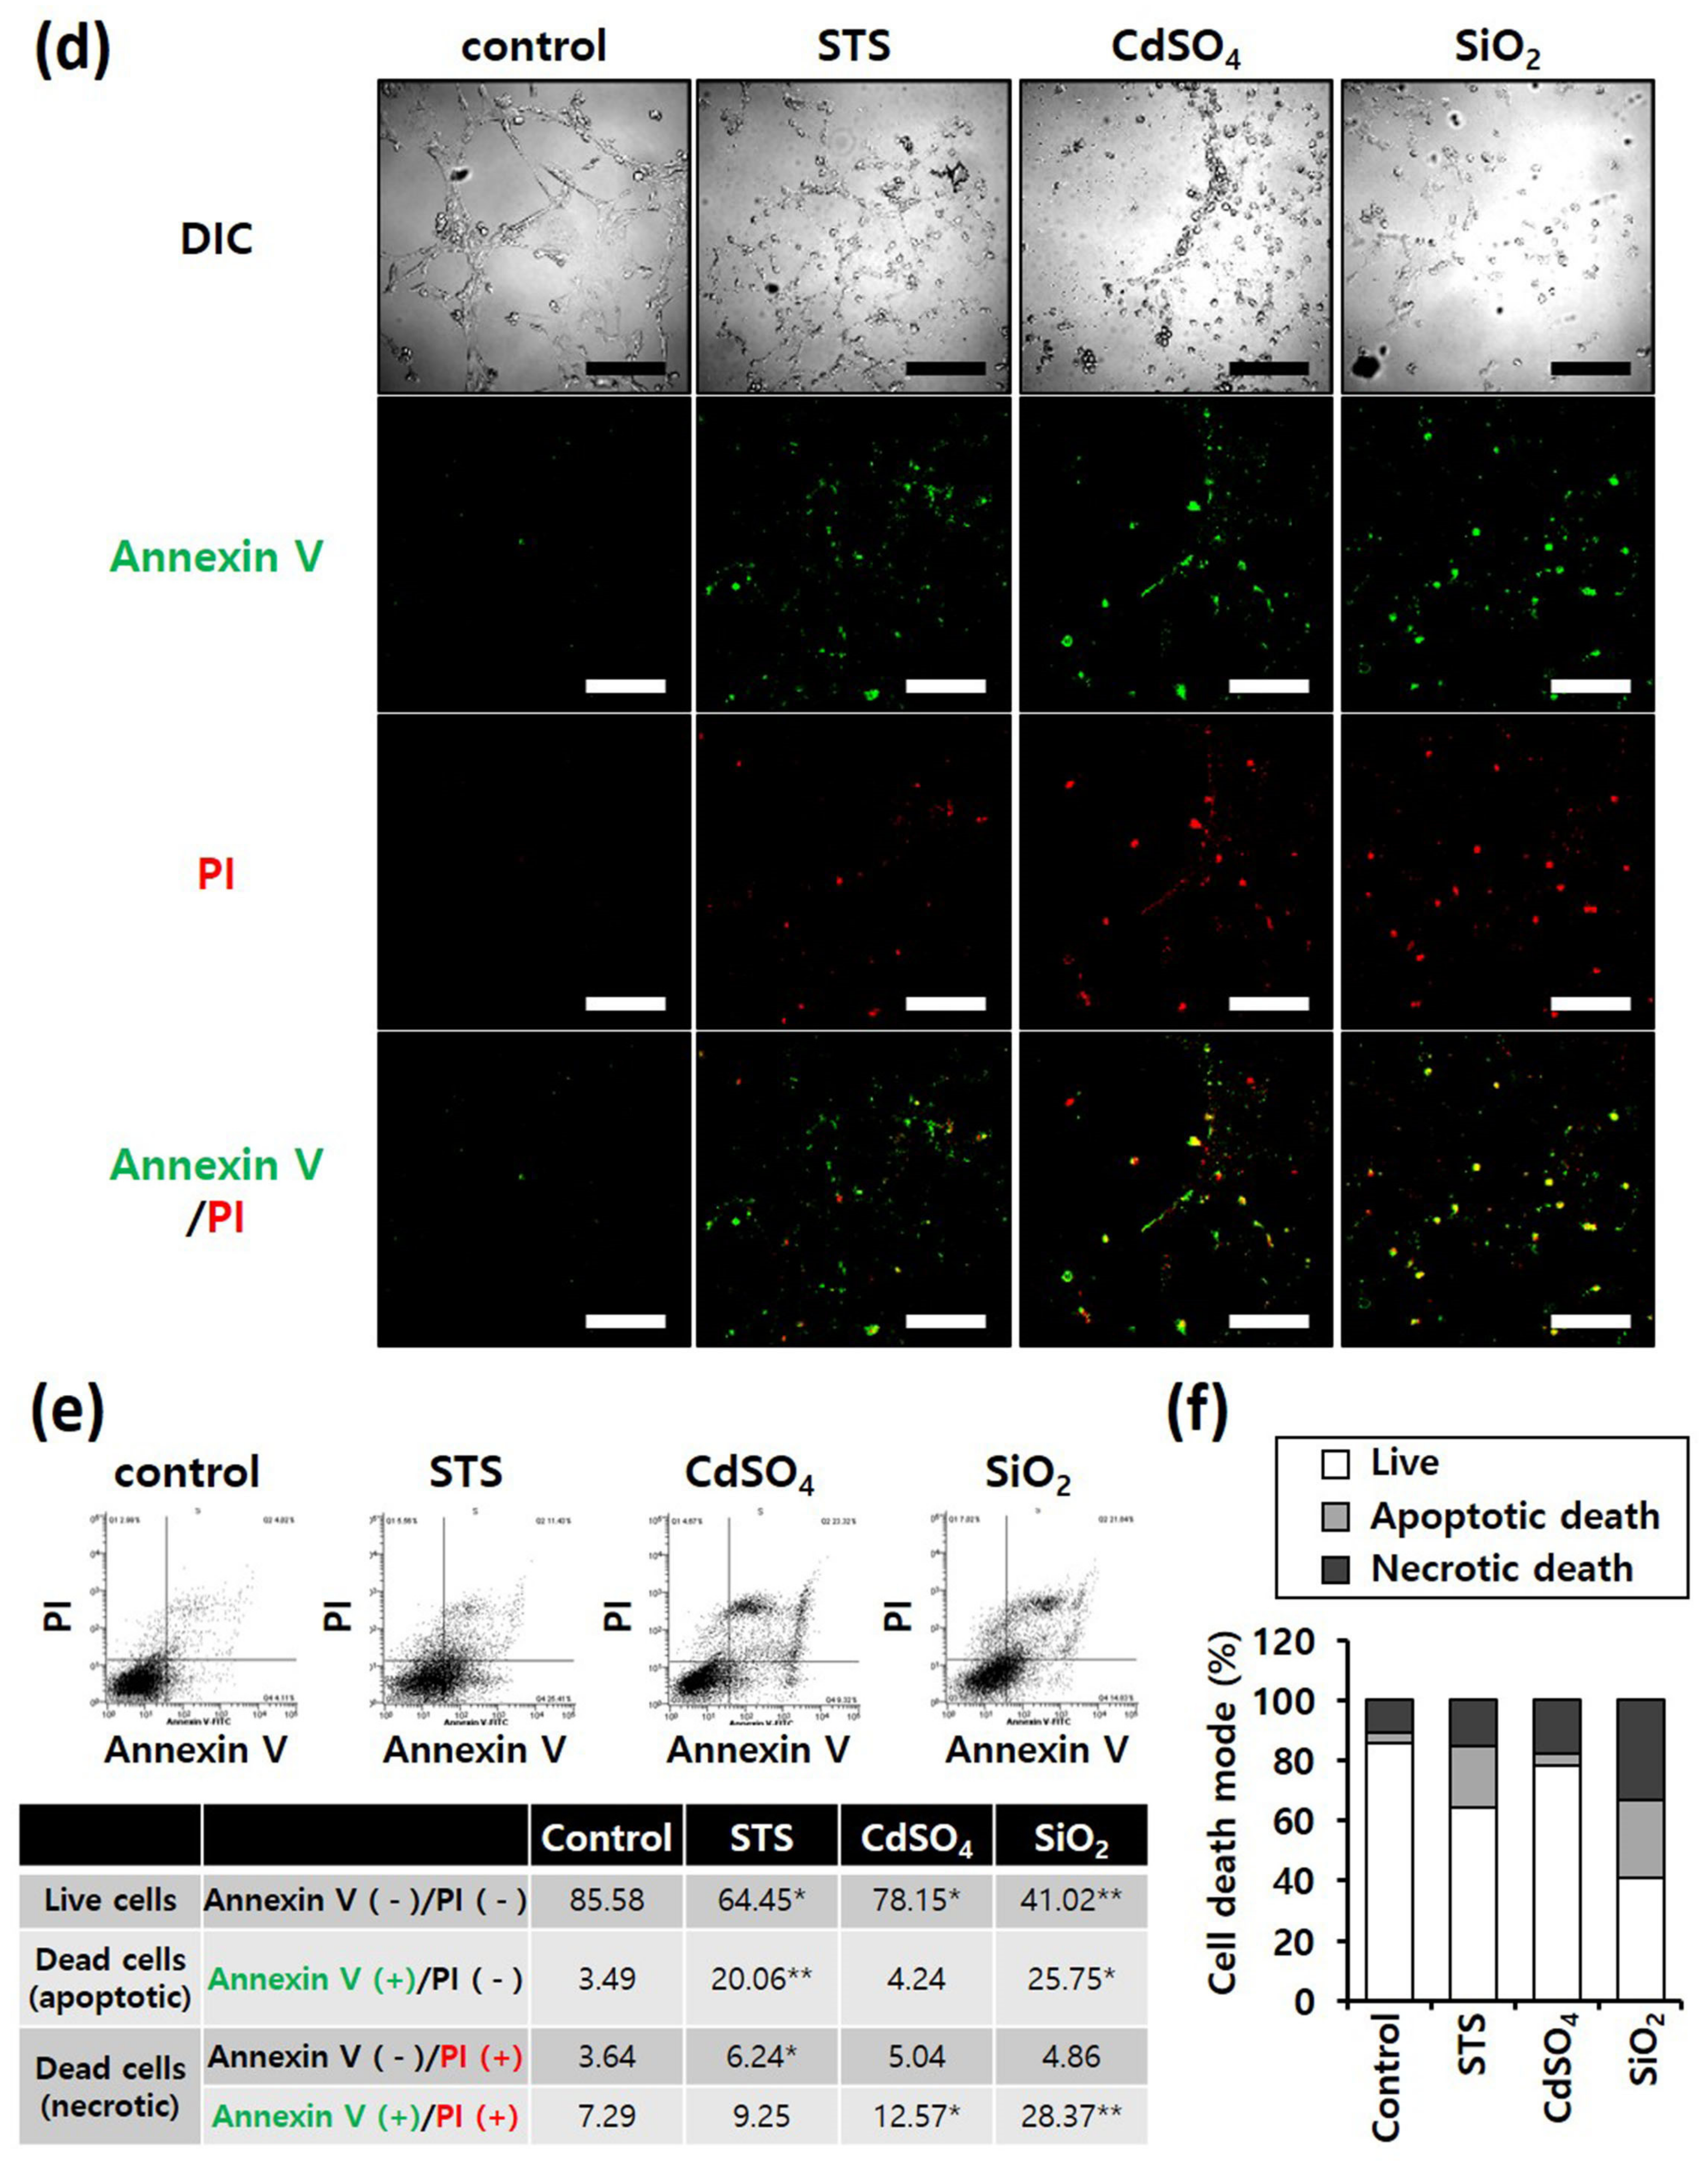
Figure 3. Annexin-V/PI double-staining assay of A549 and NHBE cells; After treating A549 and NHBE cells with SiO2 NPs (at IC50) and two positive controls, the cells were stained with annexin V-fluorescein isothiocyanate and propidium iodide and analyzed by fluorescence microscopy and flow cytometry. CdSO4 (1.0 mM) was used to induce necrosis, and staurosporine (STS; 1.0 μM) was used to induce apoptosis; replicate number = 3. (a,d) Confocal fluorescence microscopy images; scale bars represent 200 μm. (b,e) Flow cytometry analysis. * p < 0.05, compared with control; ** p < 0.005, compared with control. (c,f) Percentage distribution of necrotic, apoptotic, and viable cells.
Figure 4. Annexin-V/PI double-staining assay of HepG2 and HH cells; After treating HepG2 and HH cells with SiO2 NPs (at IC50) and two positive controls, the cells were stained with annexin V-fluorescein isothiocyanate and propidium iodide and analyzed by fluorescence microscopy and flow cytometry. CdSO4 (1.0 mM) was used to induce necrosis, and staurosporine (STS; 1.0 μM) was used to induce apoptosis; replicate number = 3. (a,d) Confocal fluorescence microscopy images; scale bars represent 200 μm. (b,e) Flow cytometry analysis. * p < 0.05, compared with control; ** p < 0.005, compared with control. (c,f) Percentage distribution of necrotic, apoptotic, and viable cells.
5. Examination of SiO2 NPs Retention in Cells
Because intracellular nanomaterials can majorly cause cytotoxicity, the intracellular accumulation of SiO2 NPs was confirmed. First, confocal microscopy revealed FITC-labeled SiO2 NPs in the four cell lines when treated with these NPs (Figure 5a). In addition, the proportion of cells containing FITC-labeled SiO2 NPs, determined by flow cytometry, revealed that more than 95% of all A549, NHBE, HepG2, and HH cells contained FITC-labeled SiO2 NPs (Figure 5b). researchers conclude that SiO2 NPs were internalized in the four cell lines without difficulty. For analysis of residual NPs, the culture medium was changed after 4 h of FITC-labeled SiO2 NP treatment (Figure 5c). The number of cells containing FITC-labeled SiO2 NPs was counted using flow cytometry at 0 and 48 h after treatment. After 48 h of treatment, FITC-labeled SiO2 NPs were less than 10% in A549 and HepG2 cancer cells and more than 30% in NHBE and HH normal cells. Thus, the removal rate of NPs from cancer cells was markedly faster than that from normal cells. Therefore, regardless of their origin, cancer and normal cells differ.
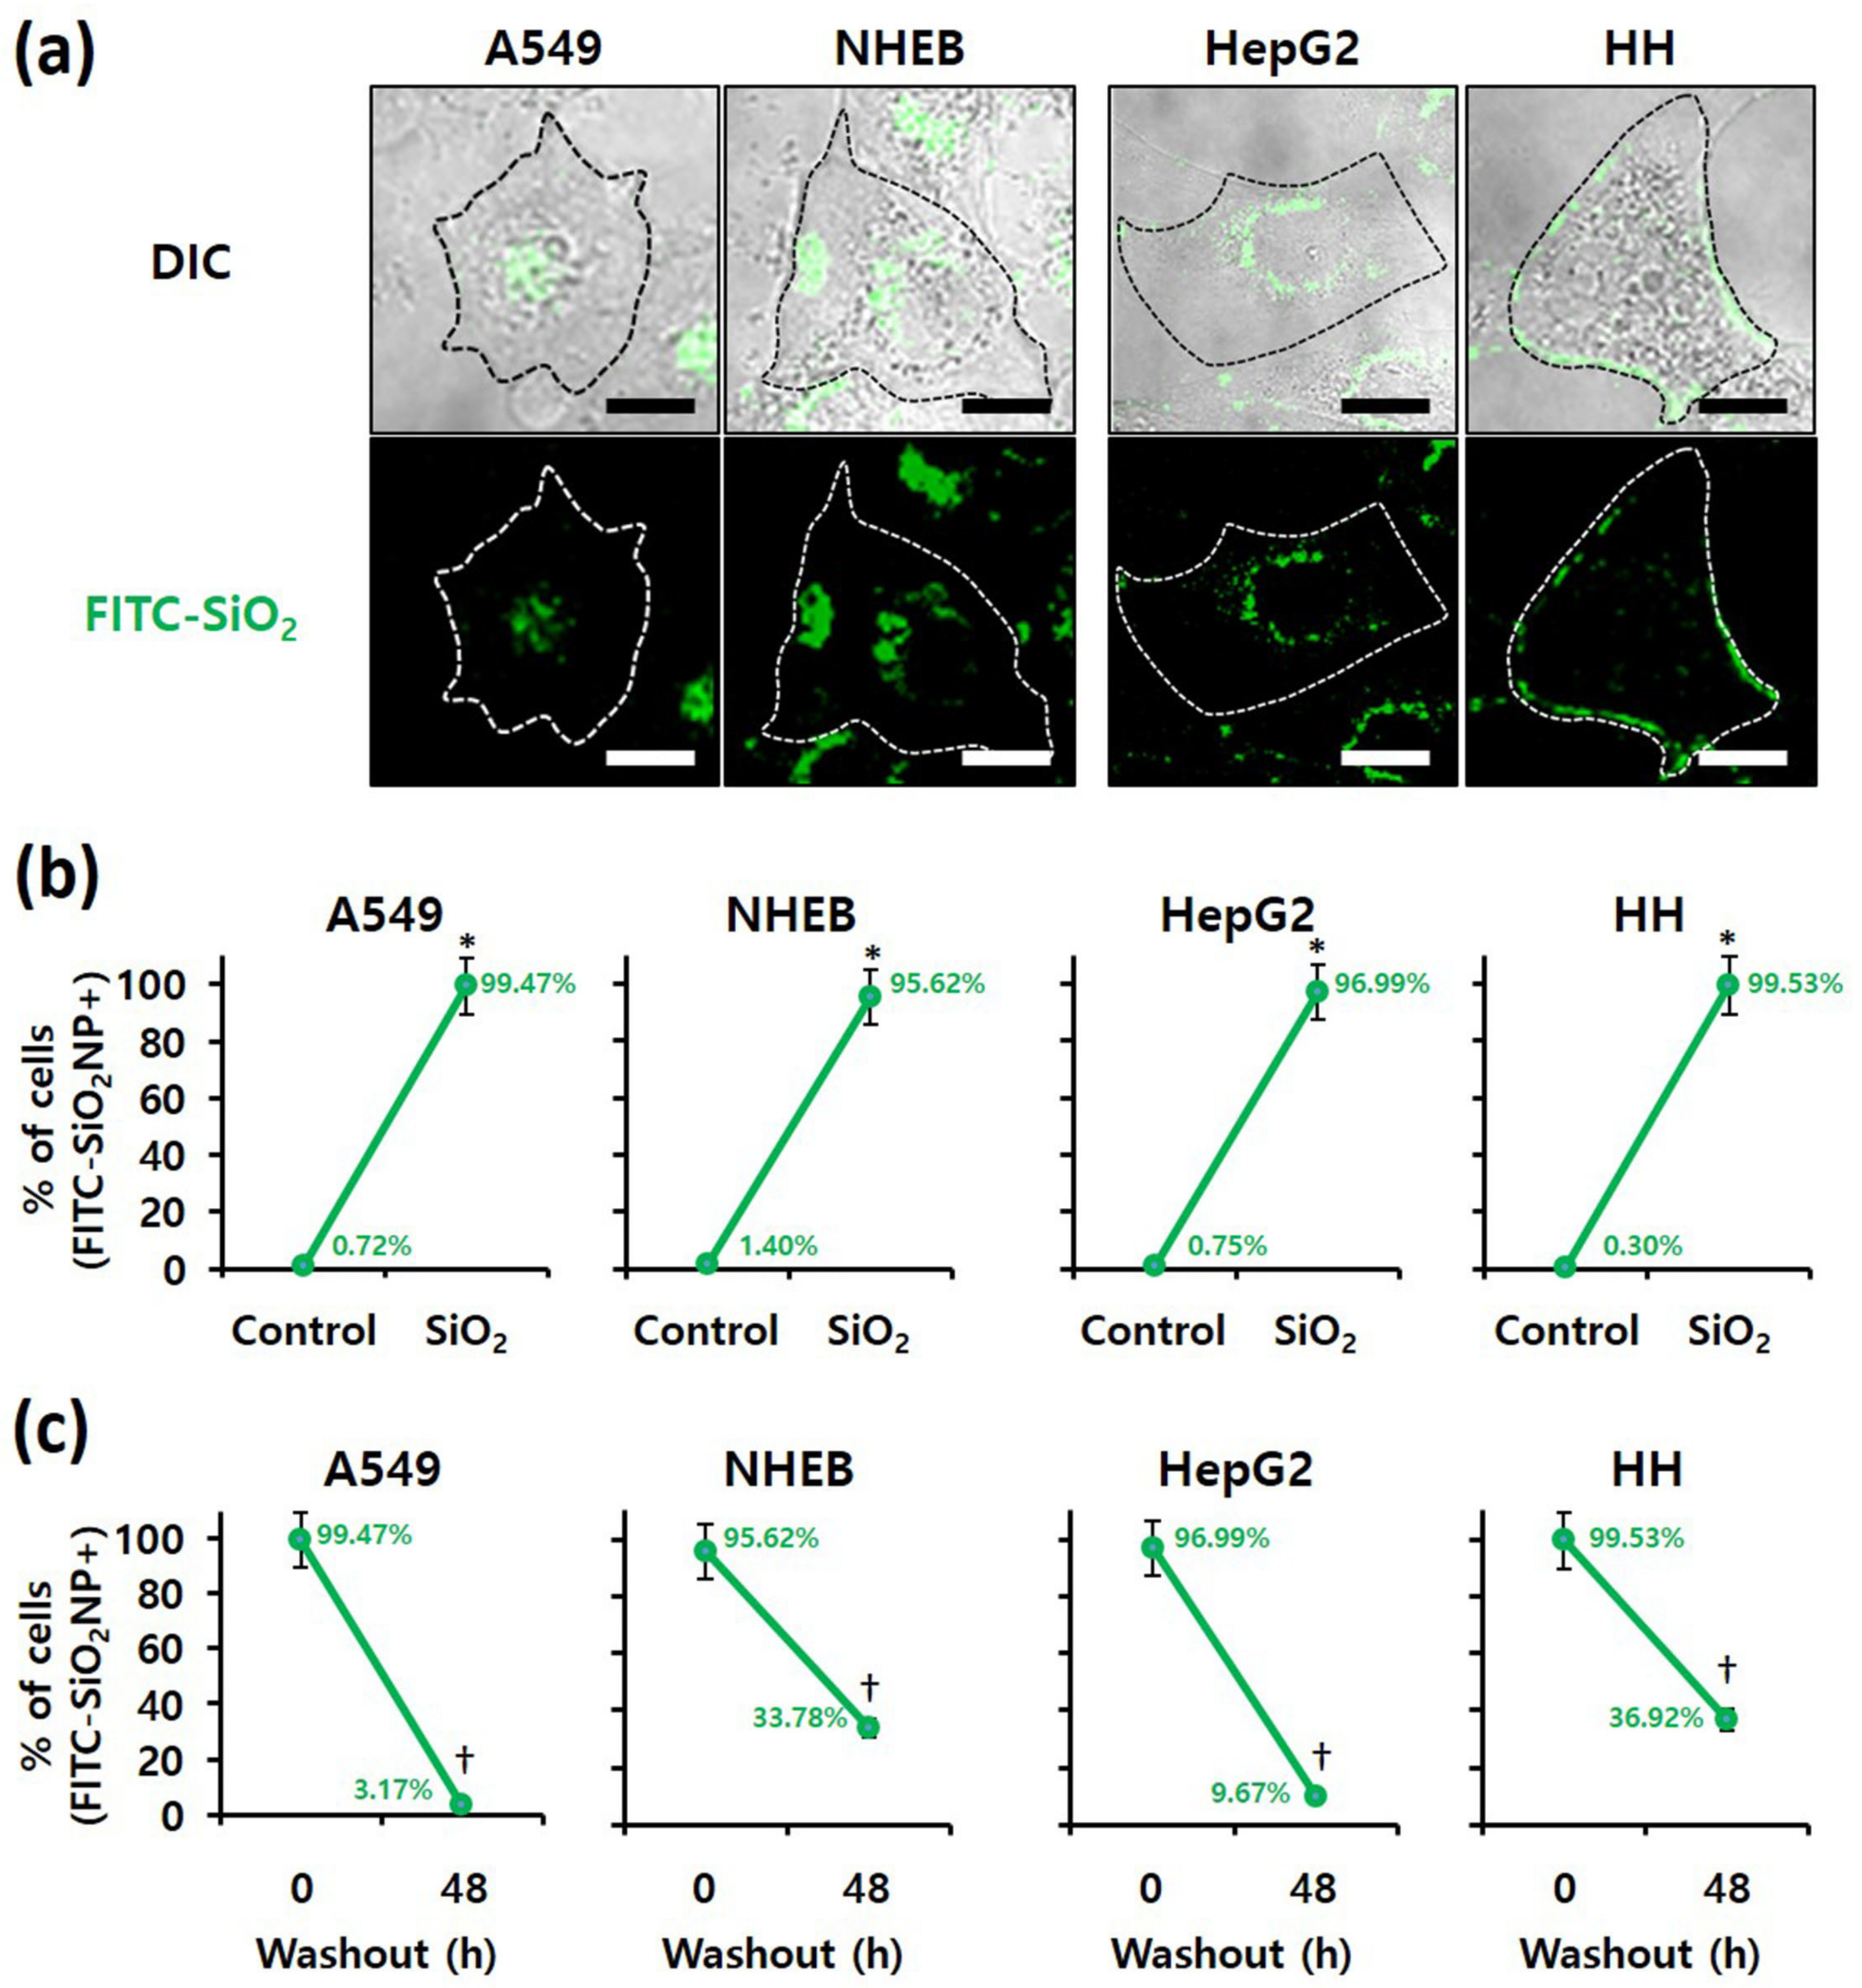
Figure 5. Examination of SiO2 NPs retention in cells; Localization of fluorescein isothiocyanate (FITC)-labeled 20 nm SiO2 NPs in each cell line, as determined by (a) confocal fluorescence microscopy (scale bars represent 10 µm) and (b) flow cytometry after 4 h of treatment. * p < 0.005, compared with control. (c) Retention of FITC-labeled 20 nm SiO2 NPs in each cell line, as determined by flow cytometry at 0 and 48 h after 4 h of treatment. † p < 0.005, compared with washout for 0 h.
References
- Fytianos, G.; Rahdar, A.; Kyzas, G.Z. Nanomaterials in Cosmetics: Recent Updates. Nanomaterials 2020, 10, 979–995.
- Raj, S.; Jose, S.; Sumod, U.S.; Sabitha, M. Nanotechnology in Cosmetics: Opportunities and Challenges. J. Pharm. Bioallied Sci. 2012, 4, 186–193.
- Nasir, A.; Wang, S.; Friedman, A. The Emerging Role of Nanotechnology in Sunscreens: An Update. Expert Rev. Dermatol. 2011, 6, 437–439.
- Chaudhary, P.; Fatima, F.; Kumar, A. Relevance of Nanomaterials in Food Packaging and Its Advanced Future Prospects. J. Inorg. Organomet. Polym. Mater. 2020, 30, 5180–5192.
- Uddin, I.; Venkatachalam, S.; Mukhopadhyay, A.; Usmani, M.A. Nanomaterials in the Pharmaceuticals: Occurrence, Behaviour and Applications. Curr. Pharm. Des. 2016, 22, 1472–1484.
- Sharifi, S.; Behzadi, S.; Laurent, S.; Forrest, M.L.; Stroeve, P.; Mahmoudi, M. Toxicity of Nanomaterials. Chem. Soc. Rev. 2012, 41, 2323–2343.
- Sukhanova, A.; Bozrova, S.; Sokolov, P.; Berestovoy, M.; Karaulov, A.; Nabiev, I. Dependence of Nanoparticle Toxicity on Their Physical and Chemical Properties. Nanoscale Res. Lett. 2018, 13, 44.
- Hassanpour, P.; Panahi, Y.; Ebrahimi-Kalan, A.; Akbarzadeh, A.; Davaran, S.; Nasibova, A.N.; Khalilov, R.; Kavetskyy, T. Biomedical Applications of Aluminium Oxide Nanoparticles. Micro Nano Lett. 2018, 13, 1227–1231.
- Liu, Y.; Li, H.; Xiao, K. Distribution and biological effects of nanoparticles in the reproductive system. Curr. Drug Metab. 2016, 17, 478–496.
- Bitar, A.; Ahmad, N.M.; Fessi, H.; Elaissari, A. Silica-based nanoparticles for biomedical applications. Drug Discov. Today 2012, 17, 1147–1154.
- Tang, L.; Cheng, J.J. Nanoporous silica nanoparticle for nanomedicine application. Nano Today 2013, 8, 290–312.
- McAuliffe, M.E.; Perry, M.J. Are nanoparticles potential male reproductive toxicants? A literature review. Nanotoxicology 2007, 1, 204–210.
- Wang, R.; Song, B.; Wu, J.; Zhang, Y.; Chen, A.; Shao, L. Potential adverse effects of nanoparticles on the reproductive system. Int. J. Nanomed. 2018, 13, 8487.
- Valic, M.S.; Zheng, G. Research Tools for Extrapolating the Disposition and Pharmacokinetics of Nanomaterials from Preclinical Animals to Humans. Theranostics 2019, 9, 3365–3387.
- Bahadar, H.; Maqbool, F.; Niaz, K.; Abdollahi, M. Toxicity of Nanoparticles and an Overview of Current Experimental Models. Iran. Biomed. J. 2016, 20, 1–11.
- Kim, I.Y.; Lee, T.G.; Reipa, V.; Heo, M.B. Titanium Dioxide Induces Apoptosis Under UVA Irradiation via the Generation of Lysosomal Membrane Permeabilization-Dependent Reactive Oxygen Species in HaCat Cells. Nanomaterials 2021, 11, 1943.
- Feitelson, M.A.; Arzumanyan, A.; Kulathinal, R.J.; Blain, S.W.; Holcombe, R.F.; Mahajna, J.; Marino, M.; Martinez-Chantar, M.L.; Nawroth, R.; Sanchez-Garcia, I.; et al. Sustained Proliferation in Cancer: Mechanisms and Novel Therapeutic Targets. Semin. Cancer Biol. 2015, 35, S25–S54.
- San-Millán, I.; Brooks, G.A. Reexamining Cancer Metabolism: Lactate Production for Carcinogenesis Could Be the Purpose and Explanation of the Warburg Effect. Carcinogenesis 2017, 38, 119–133.
- Granchi, C.; Minutolo, F. Anti-Cancer Agents Counteracting Tumor Glycolysis. ChemMedChem 2012, 7, 1318–1350.
- Stefano, D.D.; Carnuccio, R.; Maiuri, M.C. Nanomaterials Toxicity and Cell Death Modalities. J. Drug Deliv. 2012, 2012, 1–14.
- Yildirimer, L.; Thanh, N.T.K.; Loizidou, M.; Seifalian, A.M. Toxicology and Clinical Potential of Nanoparticles. Nano Today. 2011, 6, 585–607.
- Barabadi, H.; Alizadeh, A.; Ovais, M.; Ahmadi, A.; Shinwari, Z.K.; Saravanan, M. Efficacy of Green Nanoparticles Against Cancerous and Normal Cell Lines: A Systematic Review and Meta-Analysis. IET Nanobiotechnol. 2018, 12, 377–391.
More